Visibility Into Your AI Surface: A Primer

This article was written on an electronic typewriter by the author, and then polished using AI.
...don't let the noise of the AI security market convince you that you're starting from zero — because you're not.
I was recently in a room full of CISOs discussing their most pressing needs, and unsurprisingly, AI was a hot topic. What was surprising though, was that when you dug into it, the biggest fear they all shared was the fear of the unknown. Not knowing what LLMs were being deployed into their environments by their users was the number one unresolved use-case. NIST’s Cybersecurity Framework begins with Identify for a reason. Everything is rooted in understanding your Attack Surface i.e. the things you’re responsible for protecting. Not knowing creates anxiety, and cyber-risk that cannot be properly evaluated. The trouble with AI, is that not everyone has had a chance to fully digest and understand the technology. Instead, it appears as magic, and that’s something I want to dispel today.
If you look at the landscape of AI security startups today, you’d think “why is this still a problem?” — yet here we are. Organizations trying to get a handle on their AI surface are starting to look for forward-thinking solutions by AI focused startups, but prefer that their existing vendors catch up and offer something to address their needs. With that said, the problem is widespread so I wanted to share some practical insight into how LLMs and agents can be discovered in your environment today, by better leveraging some of the existing tools your organizations are already paying for.
I wanted to share some practical insight into how LLMs and agents can be discovered in your environment today, by better leveraging some of the existing tools your organizations are already paying for.
AI Interfaces
Before we dive into the detection methods, it’s worth grounding ourselves in how users actually interface with AI today, because the right detection method depends heavily on the interface.
SaaS applications in the browser (e.g. openai.com) over HTTPS— this is the majority of usage today. Network and Browser telemetry are key here.
Desktop applications use HTTPS communication — Network and Endpoint telemetry shine in these cases.
IDEs and command-line tools like Claude Code, Codex, or ollama — Endpoint telemetry is most important because you need process visibility and software installation data to identify them.
New SaaS sign-ups — Email is a great addition to network telemetry for getting a handle on what AI vendors your users are creating accounts with.
MCP - Popular protocol for how LLMs communicate with one another over HTTPS.
Quick Reference
Method - Strengths - Gaps
Network - Broad coverage, low cost, reliable detection; No visibility into prompts/responses; misses local models
Email - Catches new SaaS sign-ups as they happen; High false positive rate; regex maintenance
Endpoint - Sees installed software, processes, and spec files; Limited by agent coverage; can’t see TLS-encrypted prompts
Browser - Richest telemetry - full prompt and response visibility; Only sees browser-based interactions
Network
Network detection is one of the most reliable methods for identifying use of LLMs. Its gaps are a lack of visibility into the input and output of the LLM itself, meaning prompts and content can’t be assessed through this vector. It also doesn’t help if an LLM isn’t producing network traffic, such as a local model running through ollama.
Despite those gaps, it's one of the most comphrensive and least expensive ways to identify LLM use in your organization. Simply examine the network logs for domain names related to LLM vendors, specifically targeting the API domains which has higher fidelity:
api.openai.com
api.anthropic.com
ml.googleapis.com
ml.azure.com
...
And so on. This means you'll either have to maintain a list of the latest providers and their domains, or find one you can use to compare against your Firewall, Web Gateway/Proxy, SASE, DNS, and Router logs, to name a few. An updated list will likely capture 90%+ of the LLMs used in your environment because the majority of these are legitimate software solutions that users want to leverage to increase their productivity. As mentioned previously, you'll want to separate high-noise domains like openai.com from the ones that are most likely to indicate actual usage versus curious web browsing.
Another method that can be used is looking at all the sign-up emails flowing through your mail gateway for users who are signing up for LLM services with their organizational email address. This requires a lot of regular expression matching and can have a high rate of false positives, but it’s a great way to discover new sign-ups as they happen.
In addition, some SaaS Security Posture Management vendors have this capability already built out for many different types of SaaS vendors. After all, most non-technical employees today interface with an LLM through a SaaS service like openai.com.
Endpoint
The third pathway is the endpoint agent — a piece of software deployed on workstations and servers that can see network and process telemetry. This can either be an EDR, VM, or Asset Management agent, each with their own altitude of telemetry. Generally, all endpoint agents can spot locally installed LLM packages such as:
claude
kiro-cli
codex
ollama
...
In addition, nearly all of the LLMs used to develop software for vibecoding or SDD (Spec Driven Development) have a common filesystem structure that can be examined. For example, if you’re using Claude Code, you’ll have at least one — if not many — `CLAUDE.md` files, along with a `.claude` directory in each of your users’ home directories. Same with Kiro: each project will have a `.kiro` directory that can be easily read, identifying that a user has initiated an LLM development project. These local directories also contain permissions for your projects so you can assess agent access to determine if the agent is higher risk than other software. This is the equivalent to seeing whether users have MFA enable or disabled for all their SaaS applications.
$ jq '.permissions' .claude/settings.local.json
{
  "allow": [
    "Bash(python3 -c ' *)",
    "WebSearch",
    "WebFetch(domain:github.com)",
    "Bash(python -c ' *)",
    "Bash(python3 *)",
    "Bash(sqlite3 *)"
  ]
}
Whether your endpoint agent allows reading from specific files or has detections for this is a different question but this is a higher signal than installation alone.
Many endpoint agents, specifically with EDR functions, have the ability to examine process events such as start and stop, and can see the use of these tools through a simple SIEM or EDR query against a list of process names. Again, providing a higher fidelity signal by identifying its active usage.
Below, I am demonstrating the presence of two running claude processes.
$ pgrep -fal claude
94444 claude .
97358 claude claude/malware/
To summarize, the endpoint provides more valuable telemetry over Network and Email by being able to see the software installed and capture instances of its use. It even has the ability to examine the spec files that are sent to the LLMs, which provides analysts with helpful context. However, it’s not perfect. Endpoints today still lack visibility into the specific input and output instructions provided to an LLM interface, which are encrypted over TLS and sent to the LLM vendor. To get that detail, they’d need full visibility into the terminal buffer for terminal based interfaces, or the browser’s unencrypted client requests and responses. Another gap on the endpoint agent is deployment — your visibility is only as good as the coverage of the agent across your environment. This is where the network has the advantage in terms of broad coverage.
Browser Telemetry
Lastly, we have the browser, which has the richest set of information — but only for LLMs that are accessed through the browser. Again, this is the majority of non-technical users today, and it will be until desktop applications are uniformly embedded into operating systems.
Until then, browsers have full access to all client and server requests and responses initiated from the browser. The gap is that a browser session has to actually be used to initiate the conversation with an LLM for the browser to see it. But the browser is effectively the operating system of our time, so this isn’t really an issue if employees are using approved browsers and not circumventing them.
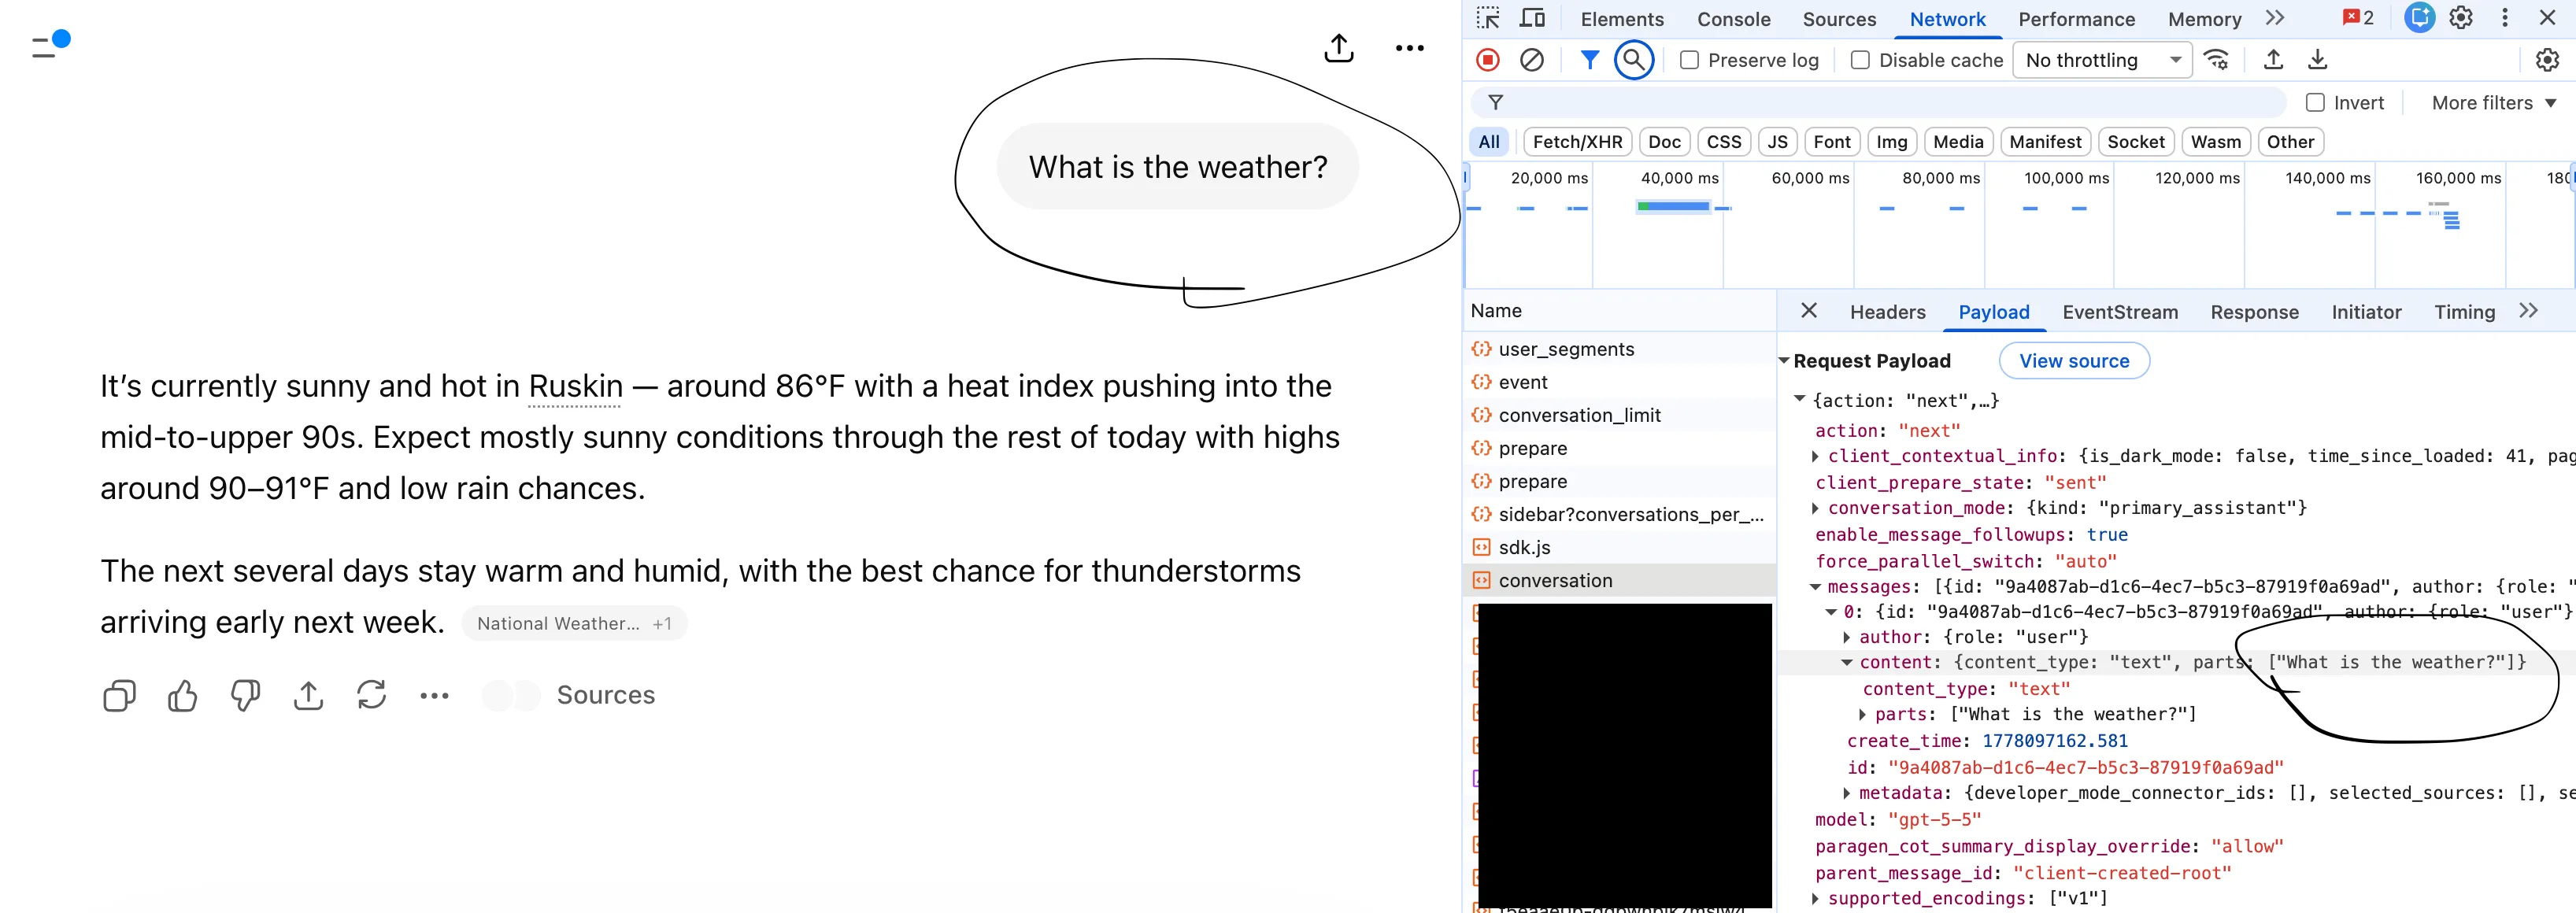
Browsers provide an API — which is what extensions use — and they can see what LLM websites users are visiting, as well as what they’re sending to the LLM (such as confidential data) and the responses coming back. So they have the ability to not just identify LLM usage, but also to Protect and Detect unacceptable and malicious behavior. All you need to do to witness this treasure trove of data is open your browser Inspector (or equivalent), choose Record Network Traffic, refresh the page, and you’ll see all the data coming in and out of the browser session. You can even search for your prompt text in your LLM session to see how the browser captured it and formatted it.
Conclusion
“You don’t need a new tool for every new problem — sometimes you just need to use the ones you have better.”
Existing tools that most organizations have deployed today — firewalls, endpoint security, vulnerability scanners, email gateways, and so on — can identify a significant number of the shadow LLMs in our organizations if we just use them to their full potential. It doesn’t require specialized AI tooling to understand your AI surface.
Once you have visibility into it, then you can make informed decisions about how to govern and appropriately protect your organization based on your risk profile. Start with what you have, layer on what you need, and don’t let the noise of the AI security market convince you that you’re starting from zero — because you’re not.