// SITE HISTORY
Changelog
Every update we ship to the site, newest first. The site is in alpha — things change often, and this page is where you can see what changed and when.
shipped updates
commits
*
Nov 1, 2026
-
Defect fix
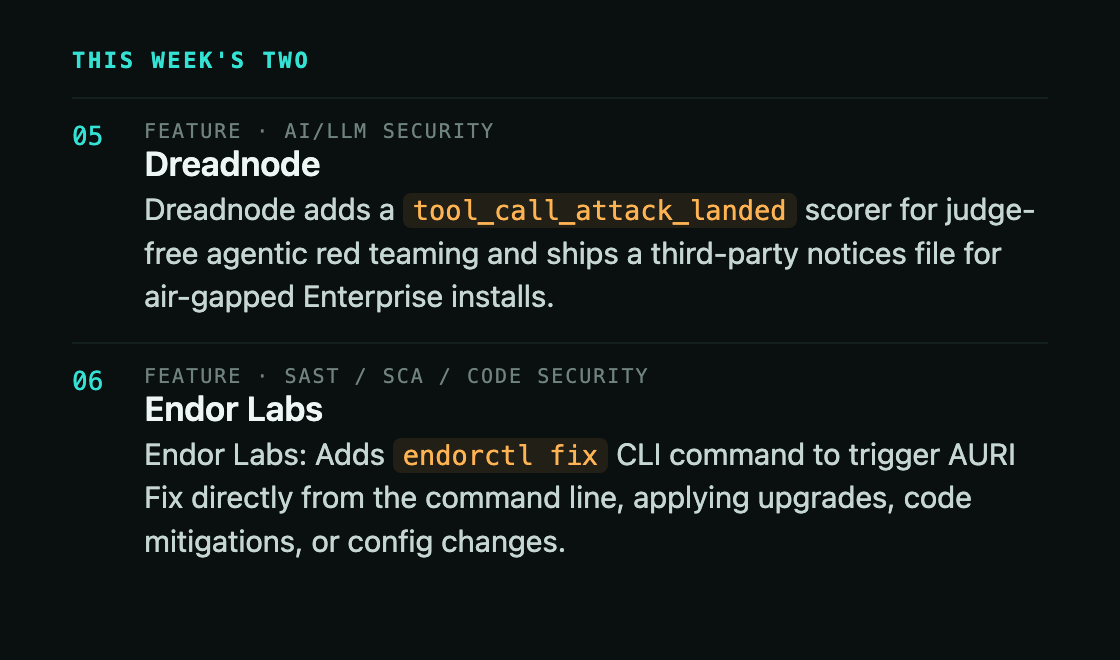
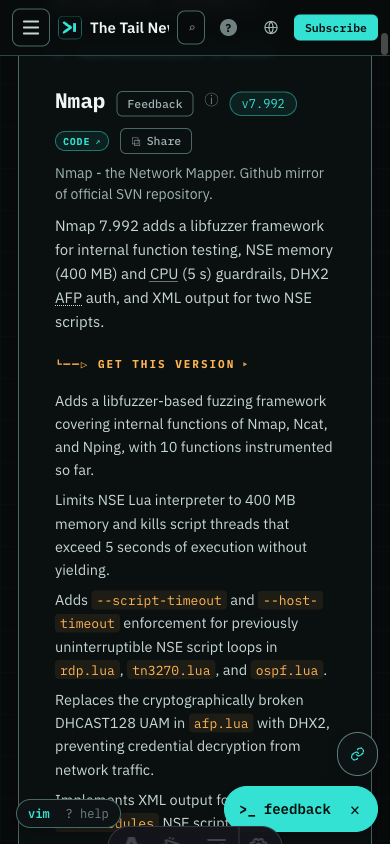
Head now shows commands, flags and function names as code, so you can spot what to type at a glance. The stray backticks are gone from the page and the email. The Tail email's picks and Try this lines get the same fix.
-
Improvement
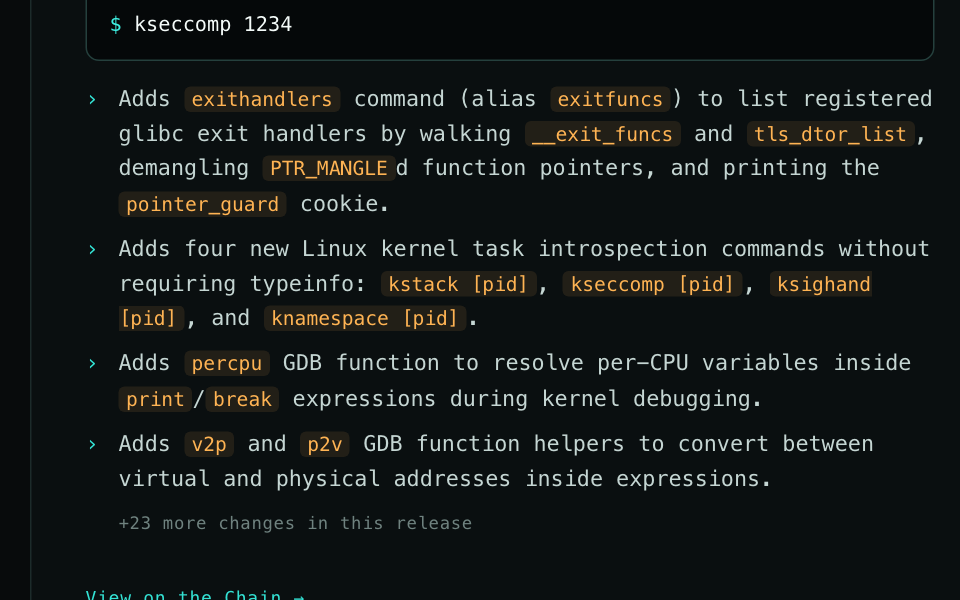
Tail emails now show the first four changes for each tool and tell you how many more there are, with a link to read them all. A tool with a long release no longer pushes everything else in the issue below the fold.
-
Improvement
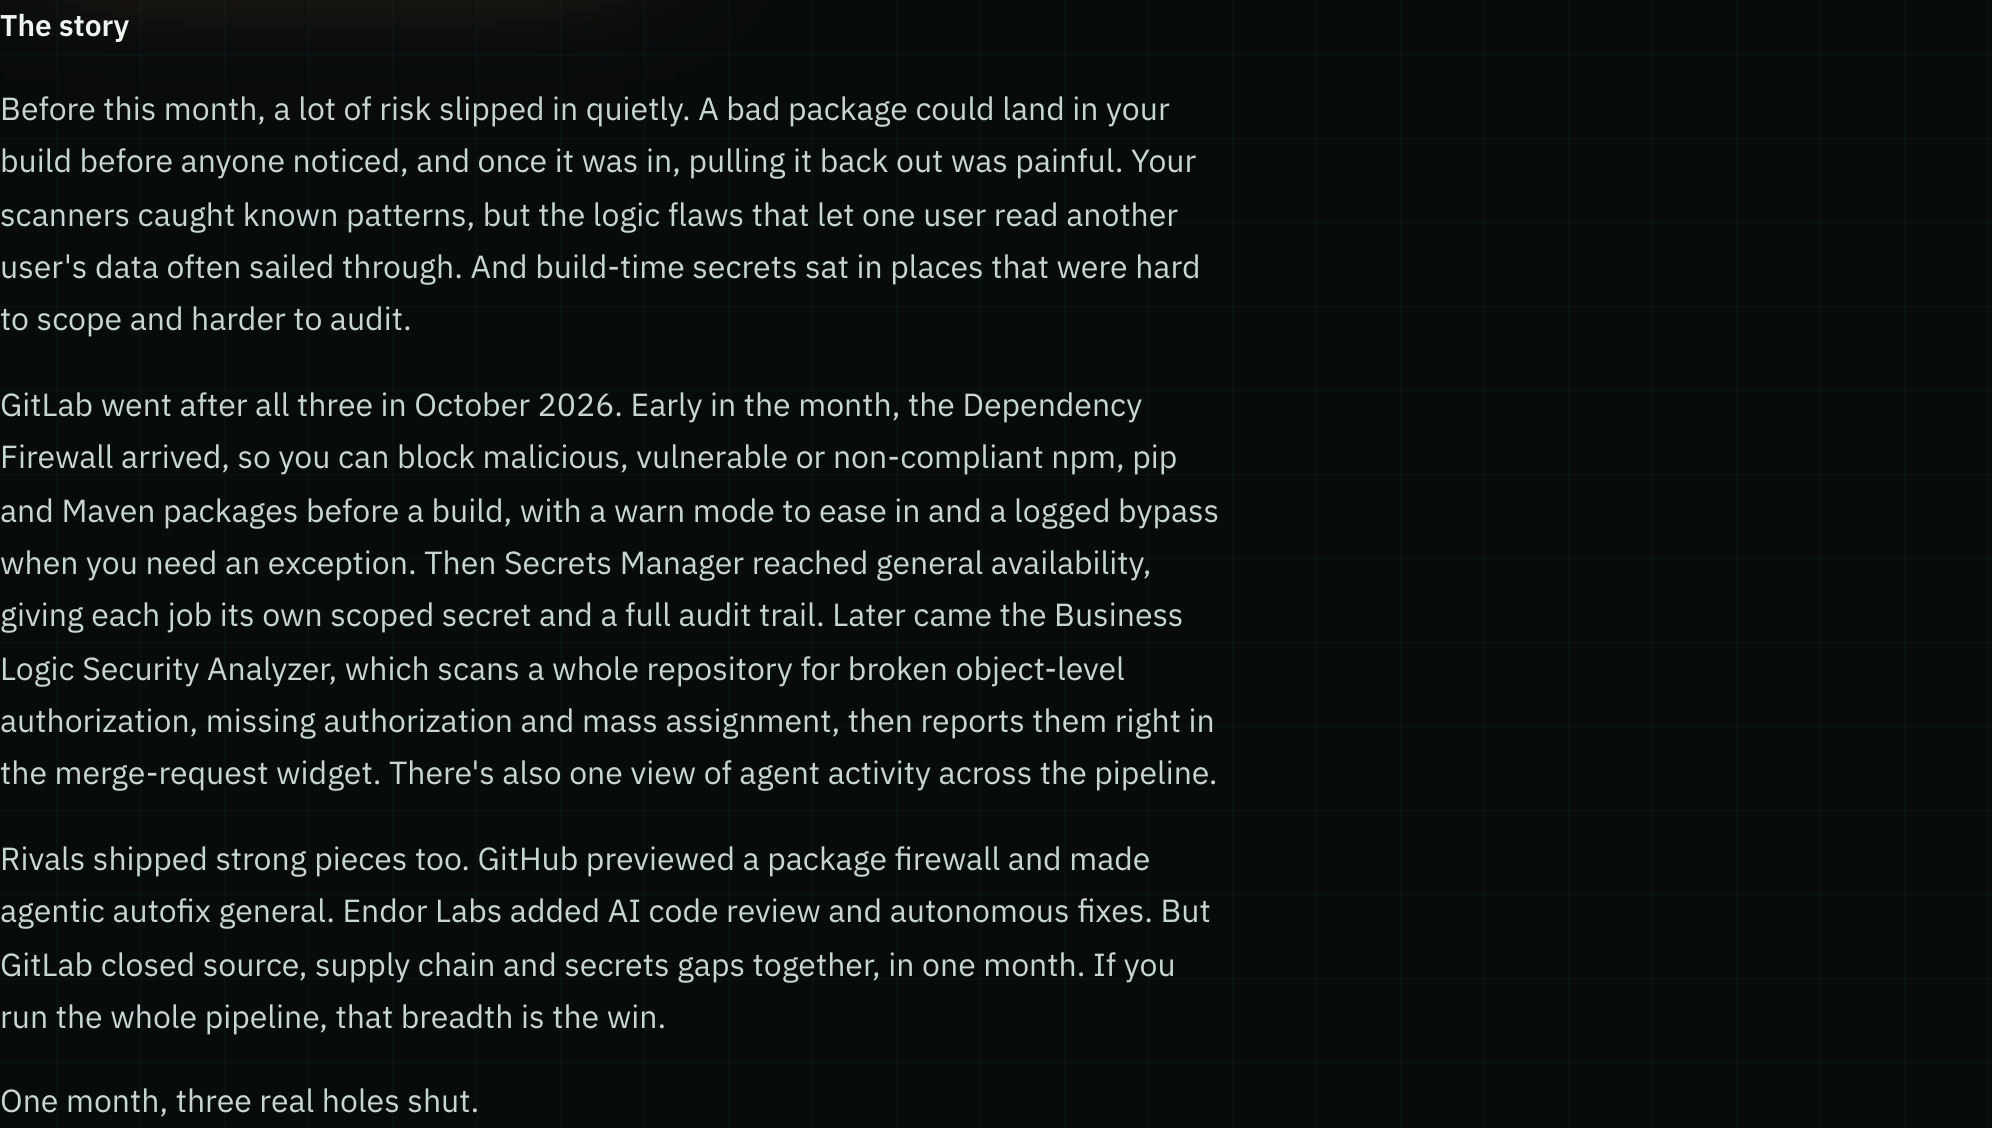
Monthly and quarterly top picks now read like a story. We start with the problem you were living with, walk through what the product shipped over the period, and say why it beat the others. The release notes come after, as examples, so you can see why it won before you read the details. It's on every top pick page now and comes to your inbox with the next pick.
- Improvement Capability Search now understands questions like "send alerts to splunk" or "forward findings to splunk". The verb no longer has to appear word for word in a tool's notes, so you find the tools that work with Splunk instead of getting nothing.
- Defect fix Typing a short name like "sso" into Capability Search while signed in, or asking your AI assistant for it, now covers every capability that name means (Single sign-on, SAML SSO and OIDC SSO), the same as on the public page, so the three places give you the same list of tools.
- Defect fix Following releases through the API or an AI assistant no longer skips ones that were published late. A release the vendor dated weeks ago, but that we only picked up today, now reaches you as new today, so a feed you poll never misses it.
- Defect fix Our privacy page now says what happens to your "Was this useful?" answers. It used to say a vote wasn't tied to your account, but if you're signed in, these are saved to it. They go when you delete your account, and the tool name goes to our analytics without your email address.
- New feature Trivy's tool page now shows the March 2026 compromise: which Trivy versions and GitHub Actions tags were poisoned, when, and what to check in your CI logs. If you scanned with Trivy that week, you can see at a glance whether your pipeline pulled an affected version.
*
Oct 31, 2026
-
Defect fix
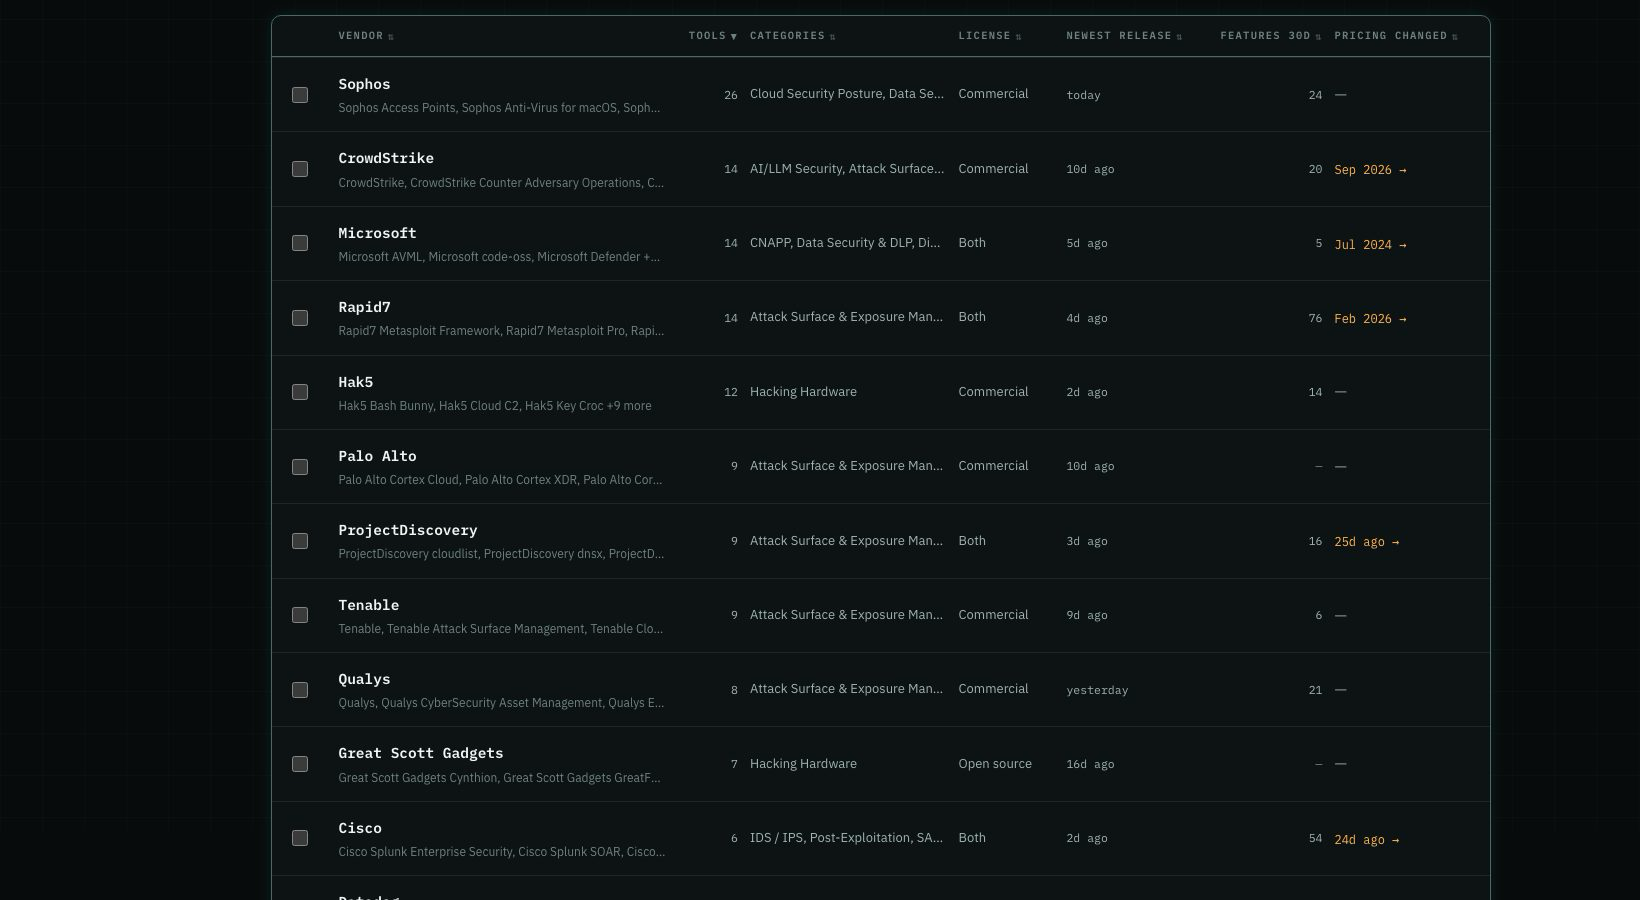
The rebrand list on Vendors now waits for changes we've confirmed, so a label on a company means what it says.
-
New feature
We now read every hardware vendor's pages we watch for what changed and what it means, not for one set phrase, so a device that lands gets a dated entry in the daily issue. A device with a date ahead of it also gets a star, so it joins the tools you follow.

-
Improvement
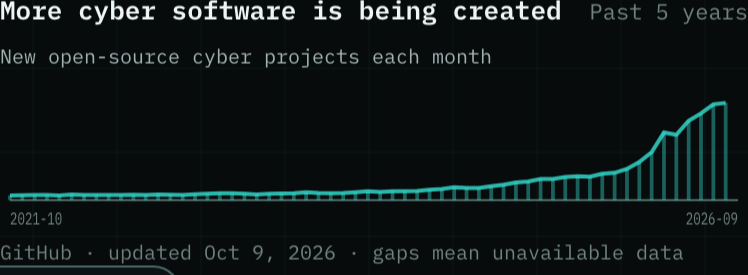
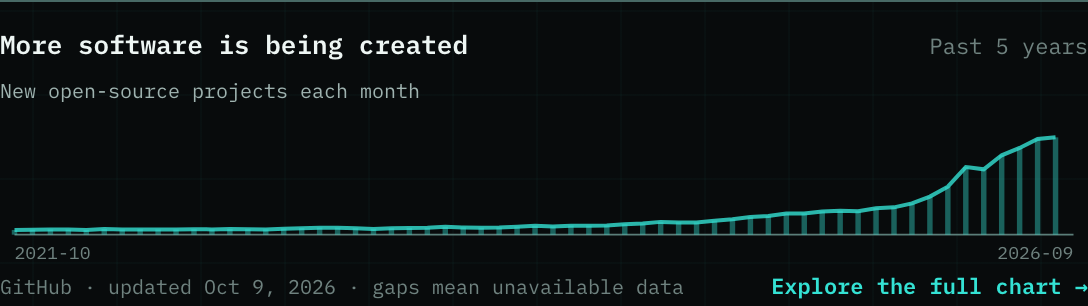
The home page chart now says what it counts: new open-source cyber projects each month, so you can see that cyber software specifically is growing, not software in general.
-
New feature
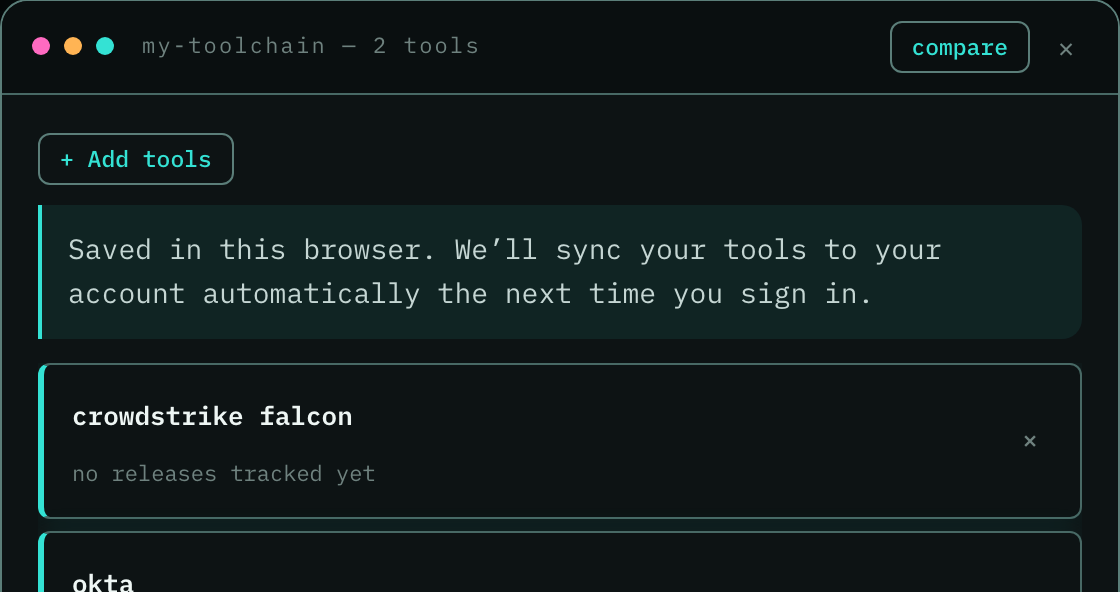
Your tools now follow you. Sign in and the tools you’ve saved sync to your account automatically, so they’re there on your other devices. Not signed in? We keep them in your browser and sync them the next time you sign in. Your email stays exactly as you set it.
- Defect fix Docs lead time is gone from every tool's signals, the compare table and the score card. It was built from when our crawler first saw a documentation change, and a new release makes us crawl sooner, so it mostly measured us and not the vendor. Breaking-change discipline now scores only how rarely a tool's releases break you, so a tool is no longer marked down or up for documentation timing we can't see.
*
Oct 30, 2026
-
Improvement
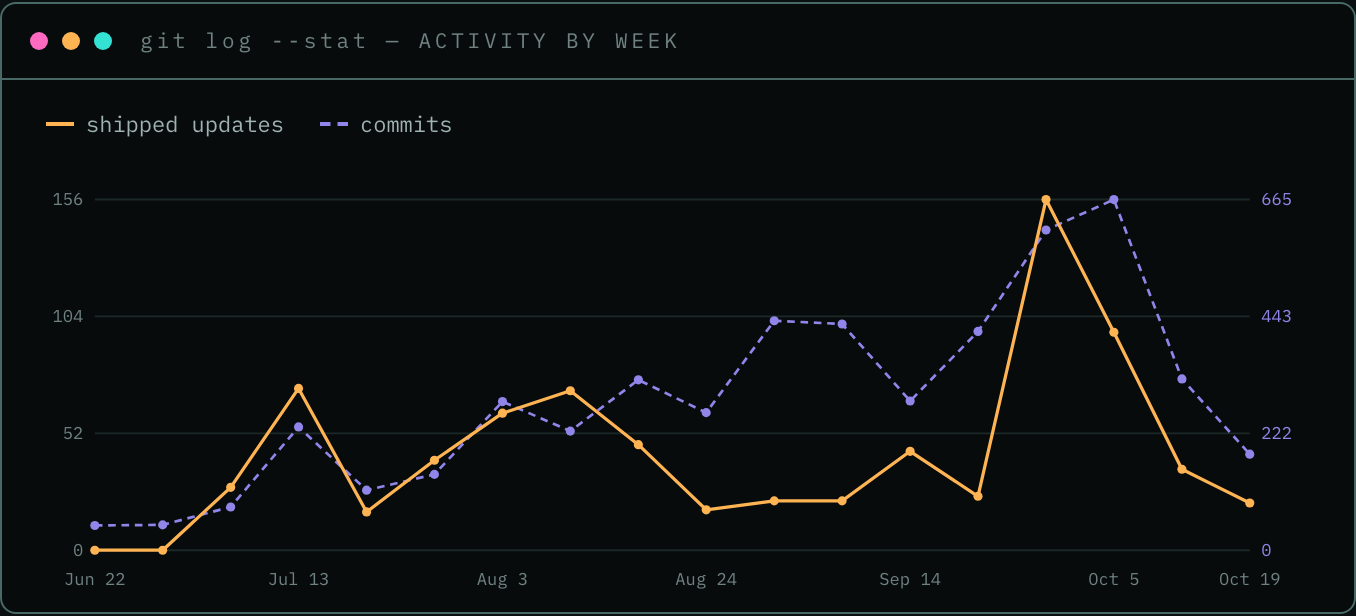
The weekly New on the Toolchain email now opens with the same activity chart as the changelog, in your email theme, so you can see how much we shipped each week without leaving your inbox.
-
Defect fix
Opening an entry at Briefed showed its first line twice. Now you get it once. Tools we've only read one release of no longer mark every option "new in", a marker that led nowhere. And the plans button on Samples now looks like every other paid label, so you can tell at a glance it's a plan and not a free signup.
-
Improvement
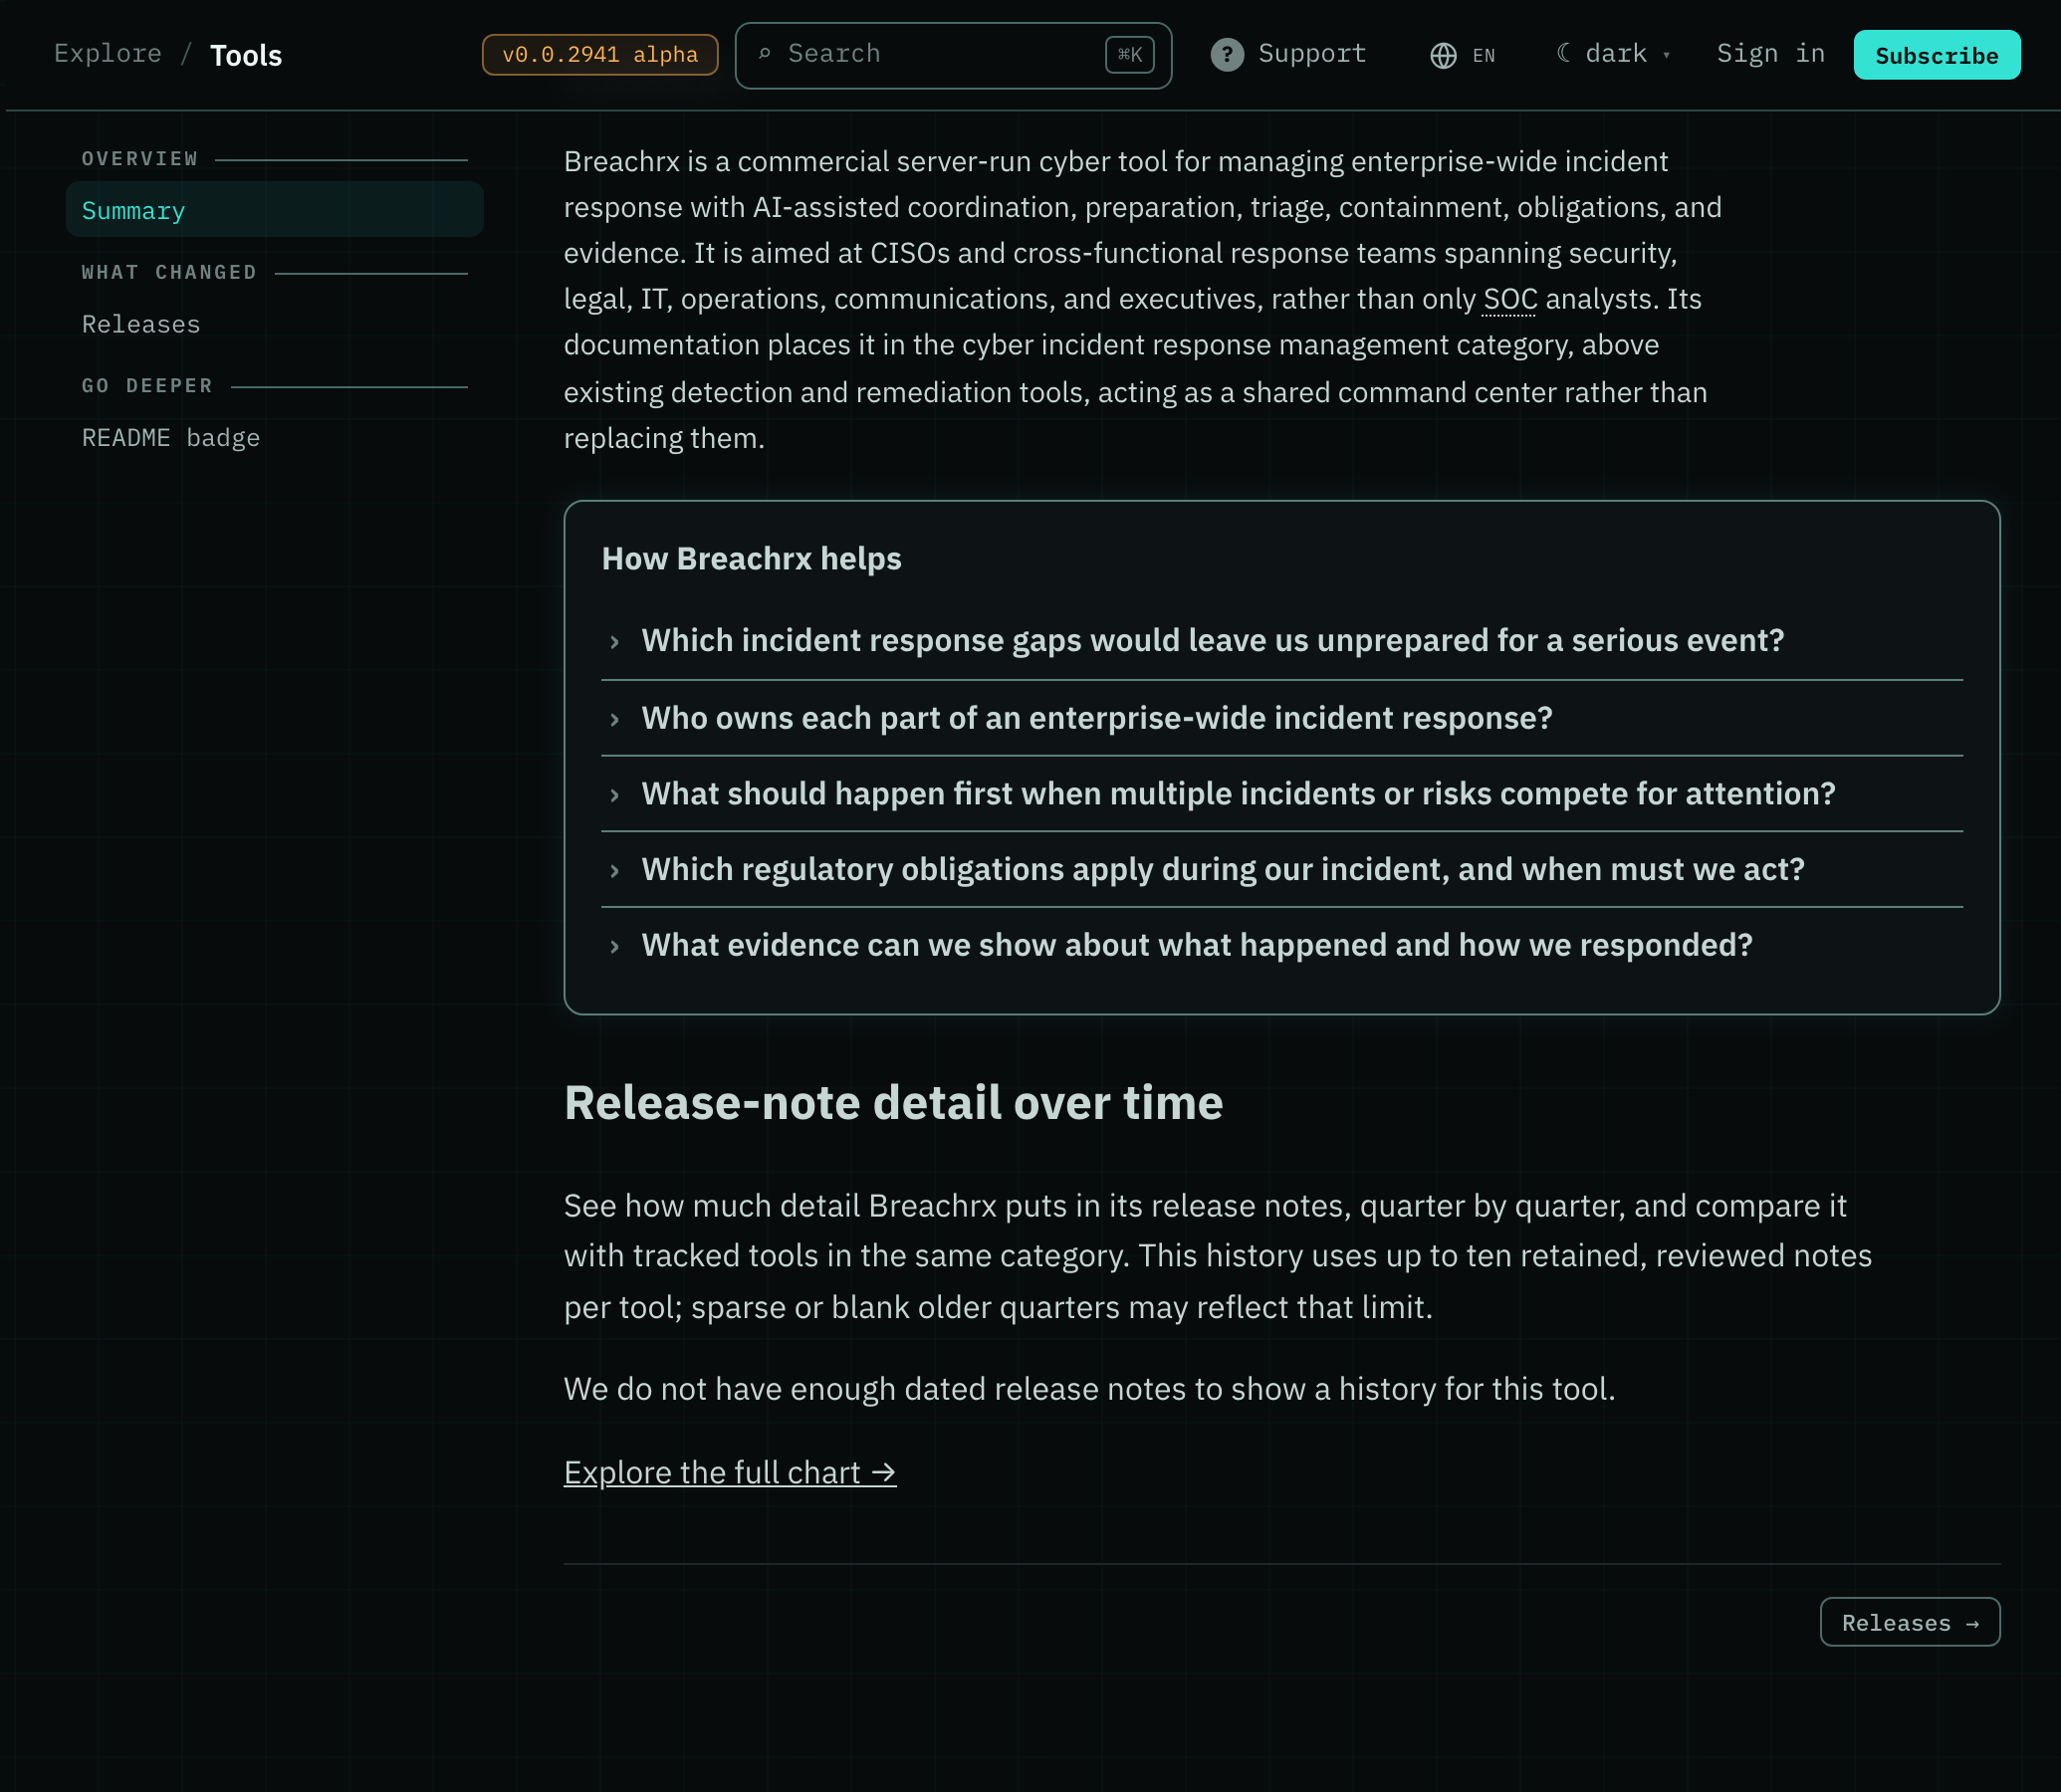
Every tool page now has its summary and its How it helps answers. 133 tools across our two sites were missing them, because our weekly refresh only rewrote pages that already had one. We also taught it to read the vendor's homepage when a tool has no release feed, so products without public notes get a page too.
- Defect fix Capability Search answers again. Since yesterday every search stopped with an error, so you couldn't see which tools match. Now your question gets its full answer, with the proof behind each match.
- Defect fix Compare links show the public facts again. If you opened a shared compare link without a plan, the table could stay empty because the full tool list hadn't arrived yet. Now it fills in as soon as the list loads. Anything you type in the tools search during that moment counts too, so you don't have to type it twice.
- Defect fix Switching language now translates the whole Tools table and the Threats list. Before, only the first screen of tools changed, and Threats stayed in English however you set it. The rest of the site's main pages are filling in now, ahead of tool pages and older issues.
- Defect fix Release histories for 17 tools are complete again, including Abnormal AI, Veracode and Palo Alto Networks. On October 13 a history merge treated releases that shared a title, like weekly update posts, as one release and dropped 157 of them. They're back, and a merge that drops rows now gets stopped before it publishes.
*
Oct 29, 2026
- Defect fix Account changes stay consistent across tabs, so an older request cannot undo a newer sign-in or sign-out.
*
Oct 28, 2026
-
New feature
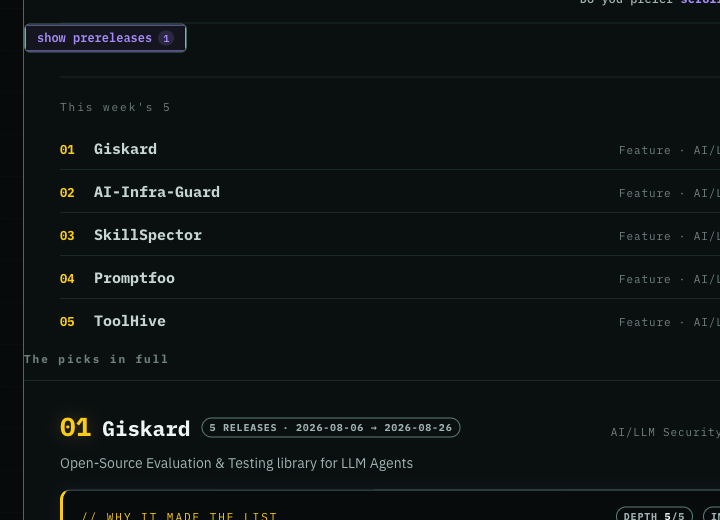
Release candidates, betas and nightly builds are now hidden on the newsletter pages until you click show prereleases, so the issue you read is what you can actually run today. We remember your choice. In email they stay off unless you turn on Include prereleases in my emails under Customization on your account, and the Developer edition includes them already, because people building on a tool want to see what's coming.
-
Improvement
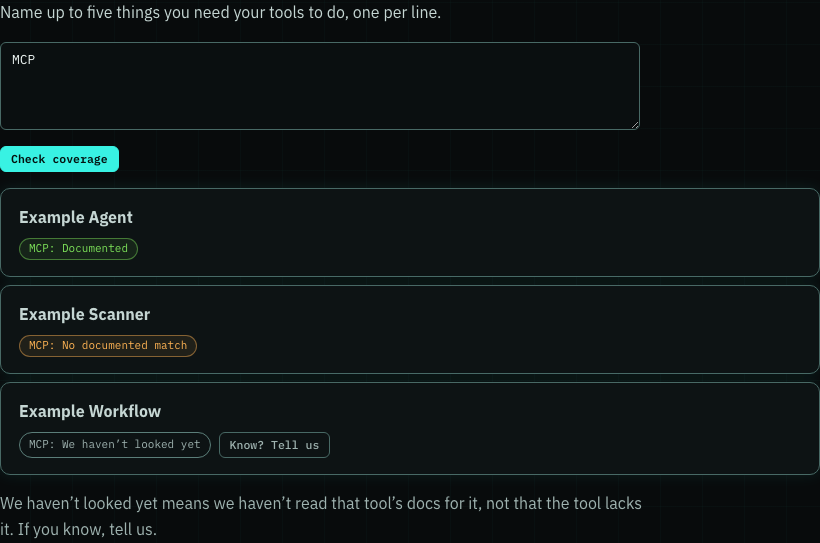
When My Toolchain checks your tools for a capability, a tool we haven't read the docs for now says We haven't looked yet instead of Not checked yet, and it has a Know? Tell us button next to it. In testing, readers took Not checked yet to mean the tool doesn't have it. If you know the answer, one click sends it to us with the tool and capability already filled in.
- Improvement Coverage changes in your newsletter email no longer have underlines, so the titles and links are easier to read on a phone.
- Improvement My Toolchain is easier to keep up with. Click an update to read it right there, then close it to land back on your list. Close updates one at a time or clear them all, and bring them back any time from the last 30 days. Long lists of tools and updates now scroll, so neither one pushes the other off the screen.
- Improvement Release summaries read more plainly. Each one now opens with the tool and what it adds, like "Keycloak adds SCIM support", instead of the vendor's product names and marketing words. Commands and settings come at the end of a sentence, after what they let you do, so you can skim an update before you reach the code.
- Defect fix Some projects mark every GitHub release as a prerelease, finished versions included. Those versions now show as releases. We check each tool's release habits every day, so when a project changes how it ships, the labels follow.
*
Oct 27, 2026
-
Improvement
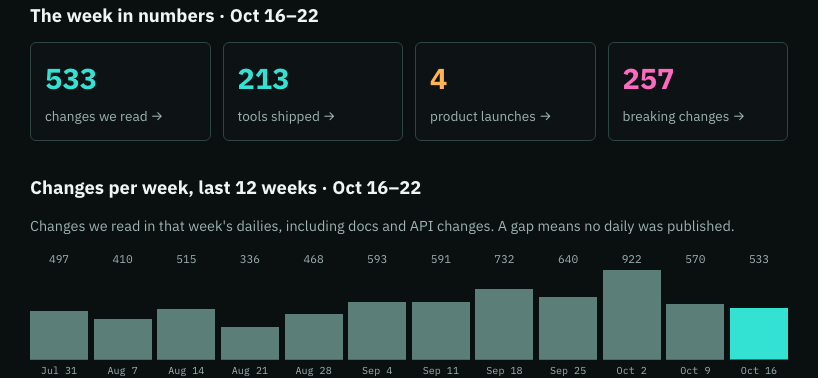
Head now opens with the week in numbers and 12 weeks of charts, so you can compare the picks with the wider week. Click any total to browse the changes, tools, product launches or breaking changes, then filter by tool.
-
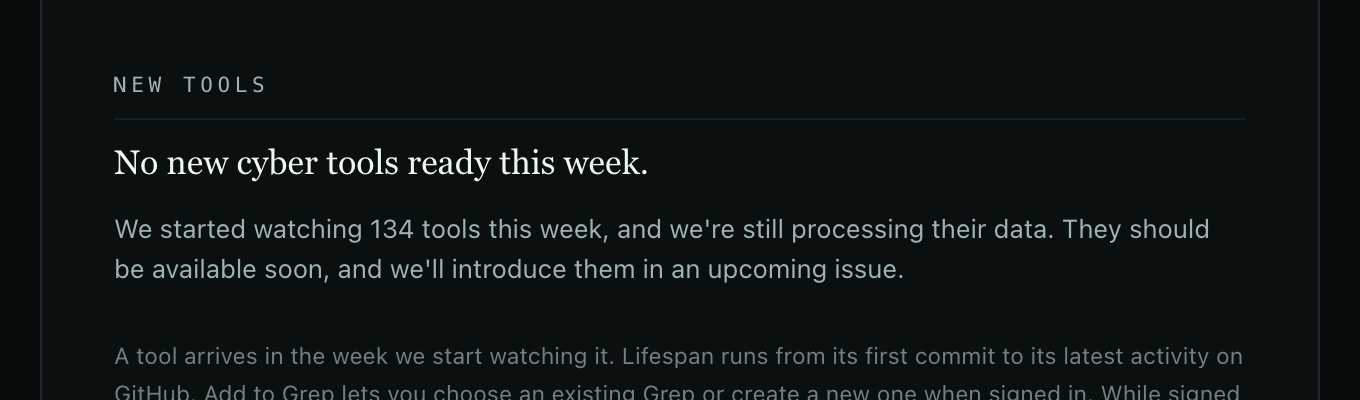
Improvement
New on the Toolchain now says so when a week has no new tools to show. If we started watching tools but are still processing their data, the issue tells you, and we introduce them in a later issue instead of skipping them.
-
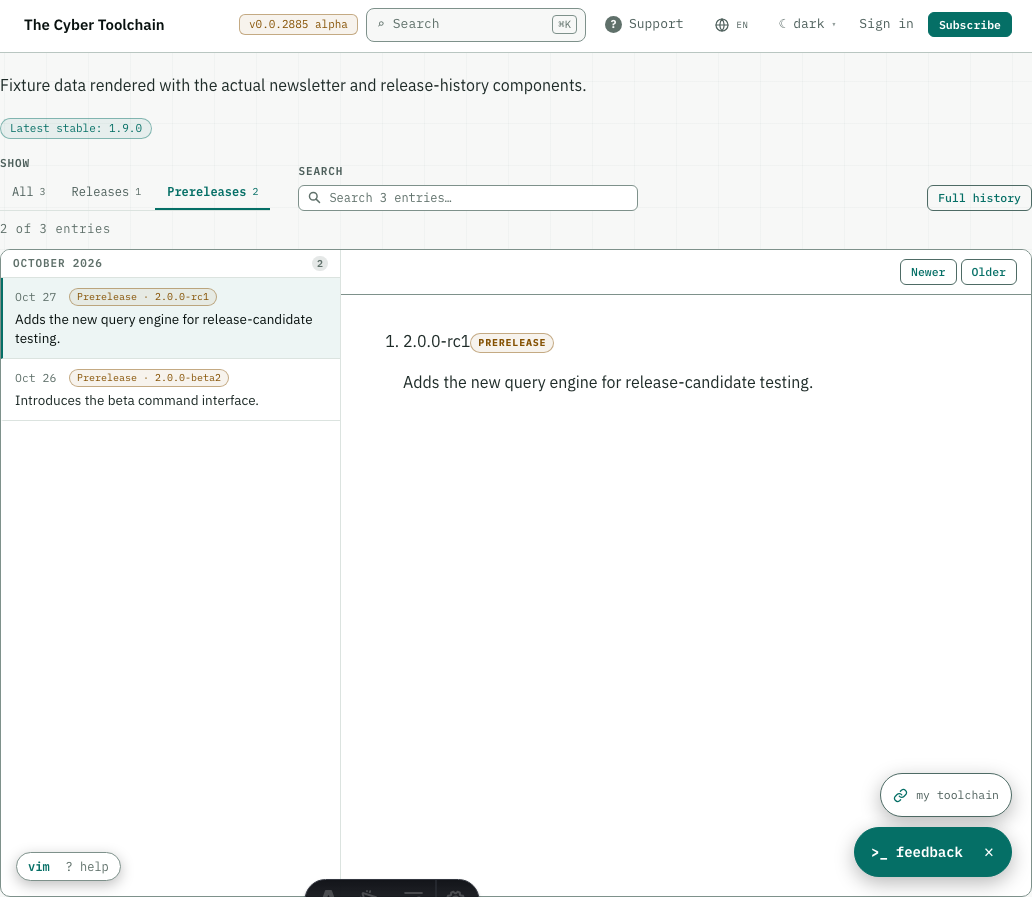
Defect fix
Release candidates and other previews now have a Prerelease label and their own history filter, so you can tell previews from final releases.
-
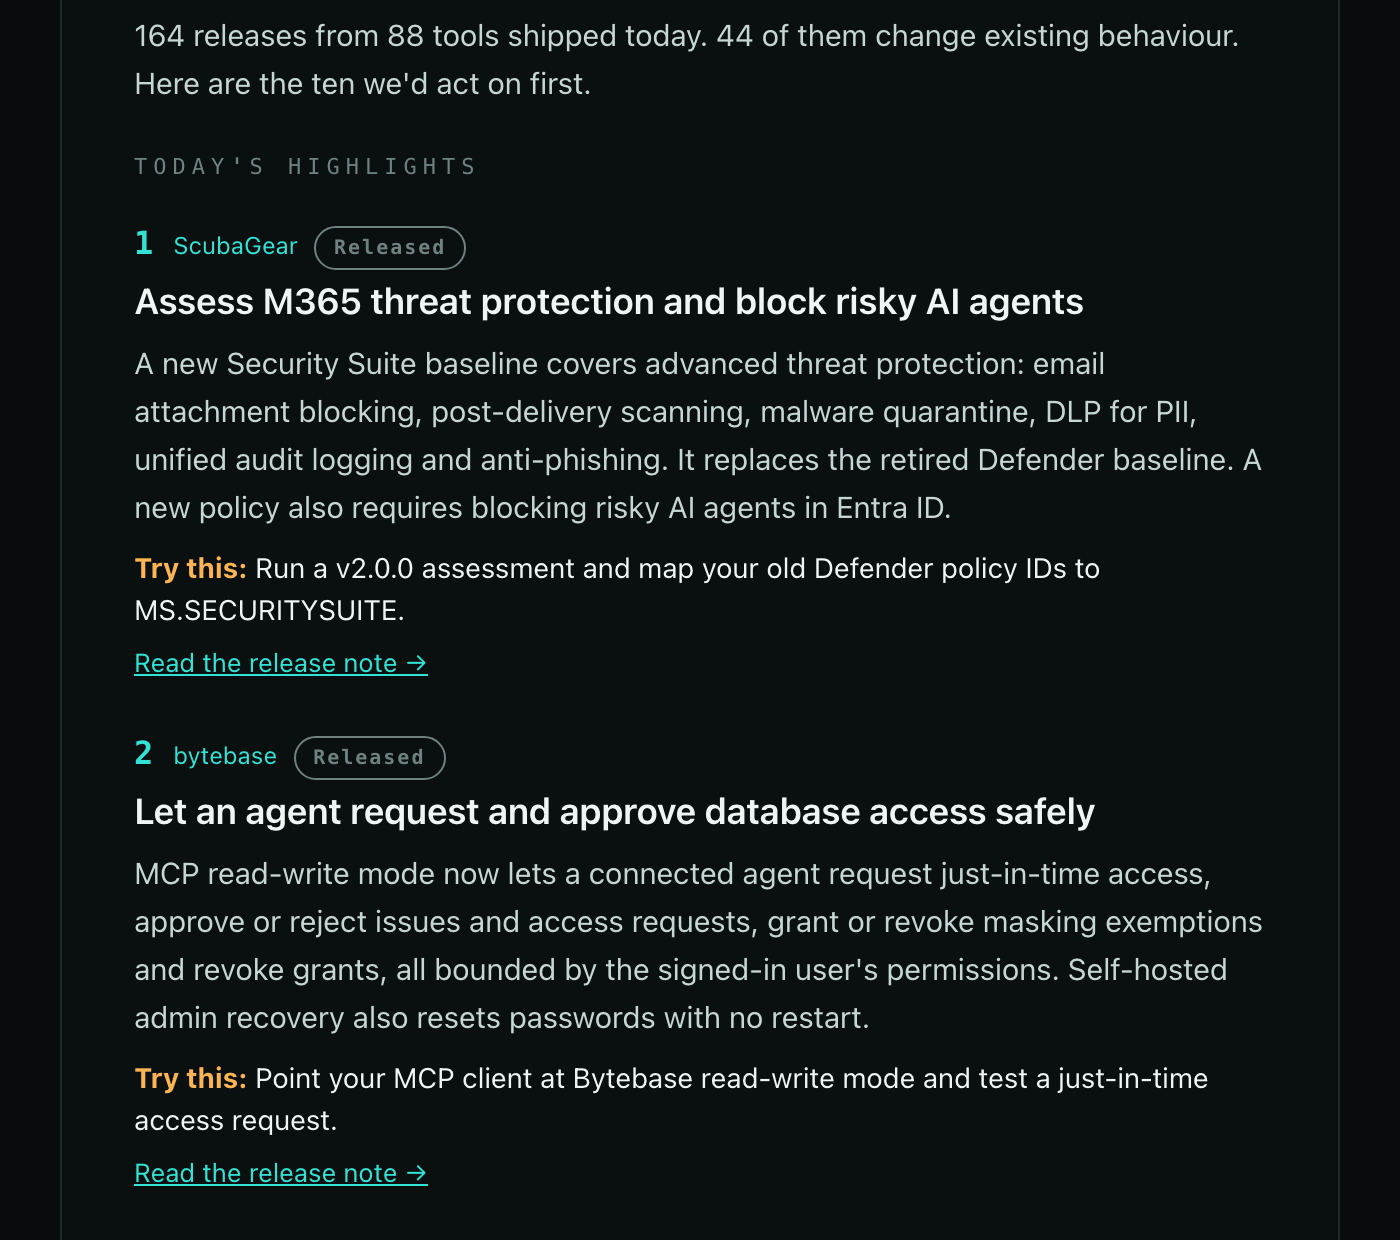
Improvement
The Tail email now opens with five to ten picks instead of three. We pick more on a day with more worth reading and fewer on a quiet one, so a busy release day doesn't squeeze the good ones out. Each pick still gets its own card with what changed and something to try, and every release is still in the issue on the web.
-
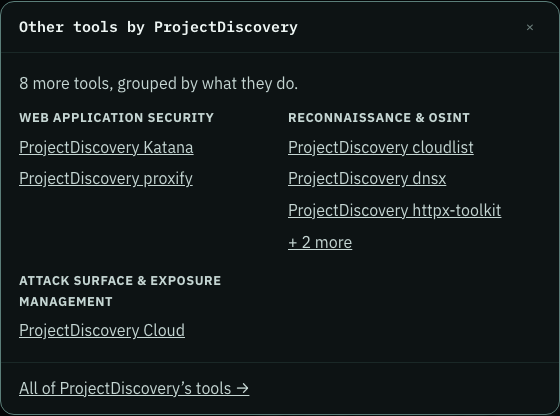
New feature
Every tool page now has a "See other tools by this vendor" link. It opens a window listing the vendor's other tools grouped by what they do, so you can jump from Nuclei to the rest of ProjectDiscovery without searching.
- New feature If you asked us to track a tool we didn't have yet, we now email you once it's live, with a link to its page. We wait until its full history is collected and its page is up on both sites, so the link you get is complete. You'll also see the request marked resolved in My Requests.
- Improvement We now track Latio, Mandos and IT-Harvest, the analyst platforms that map the cybersecurity market, so the firms that rate your vendors sit next to the vendors they rate. Each one has a tool page fed by its blog, and Mandos also links its pricing page and MCP server.
- New feature When a tool changes its name, its page moves to the new name and lists every name it has had. Your old links, bookmarks, saved tools and searches still find it, and Tail and Uniq tell every reader about the change once, without counting it as a release.
*
Oct 26, 2026
- Defect fix When you look up tools through the API or your AI assistant, you now get the full answer every time. Before, a server that had been answering for a few minutes could start replying with no tools at all. Now it keeps what it has loaded and reads again only when our data changes, so capability searches stay quick too.
- Defect fix Restored documentation monitoring for pages that were incorrectly read as empty.
- Defect fix Moving a tool’s docs to a new address no longer creates a false documentation update.
- Defect fix The edition list at the top of every newsletter email now wraps between edition names on a phone, so "uniq" no longer splits into "un" and "iq" and the list reads cleanly.
*
Oct 25, 2026
-
Defect fix
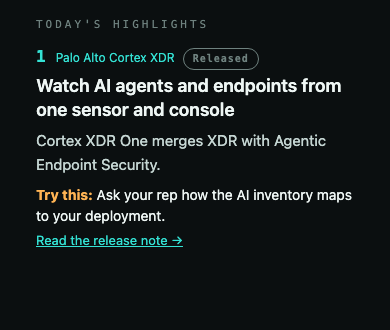
In the daily email, each highlight's number now sits beside the tool name instead of on top of it, so you can read which tool it is on your phone.
-
New feature
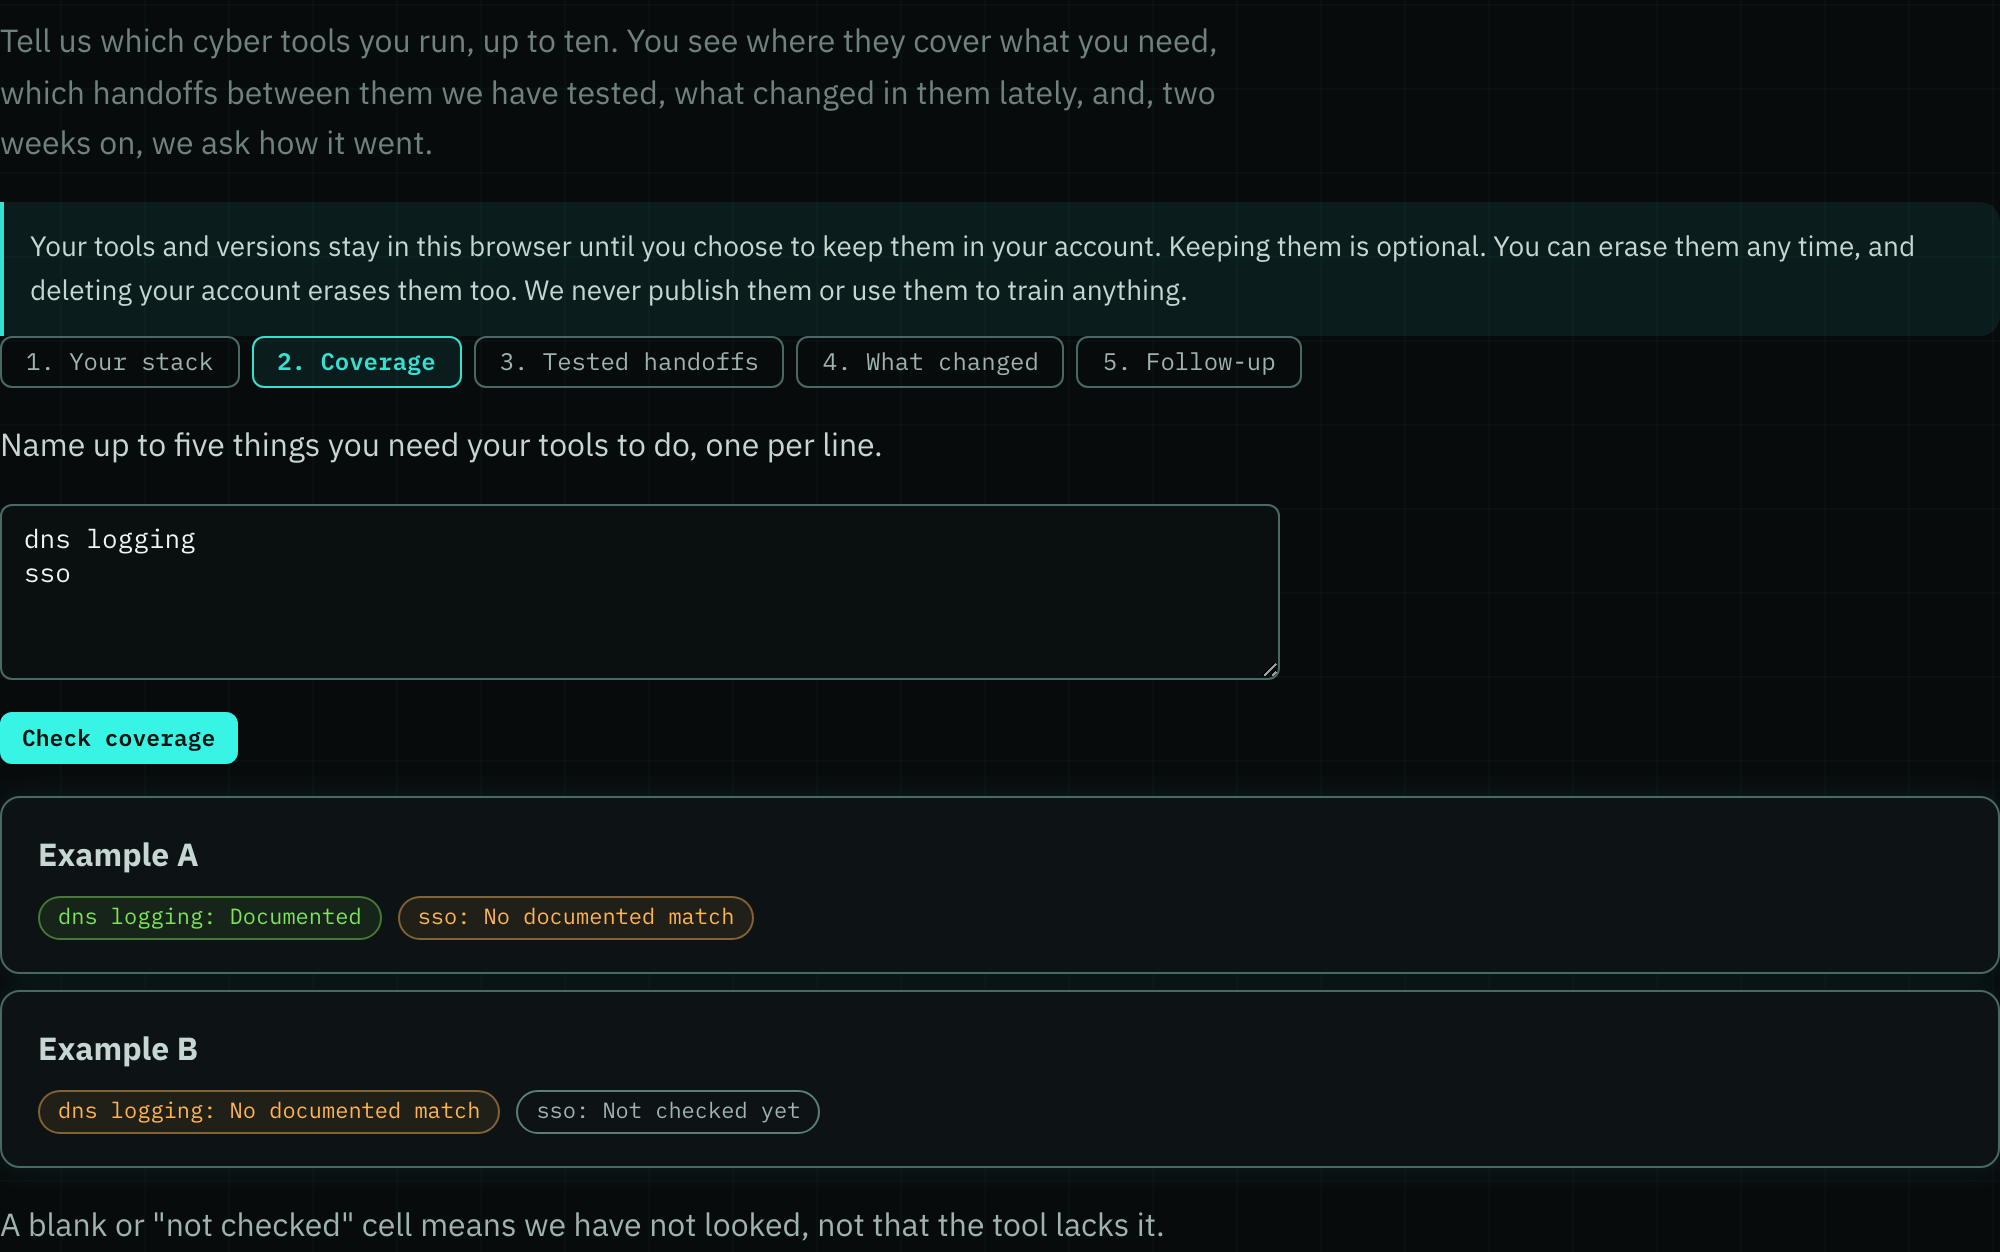
New page: My Toolchain. Tell us which cyber tools you run, up to ten, and you see where they cover what you need. The page also has room for the handoffs between them we've tested and what changed in them lately, and shows those as we publish them. Two weeks later we ask how it went. Your list stays in your browser until you choose to keep it in your account, and you can erase it any time. Before, you had to search one tool at a time and piece the picture together yourself. Now the gaps in your whole stack show up in one place.
-
Improvement
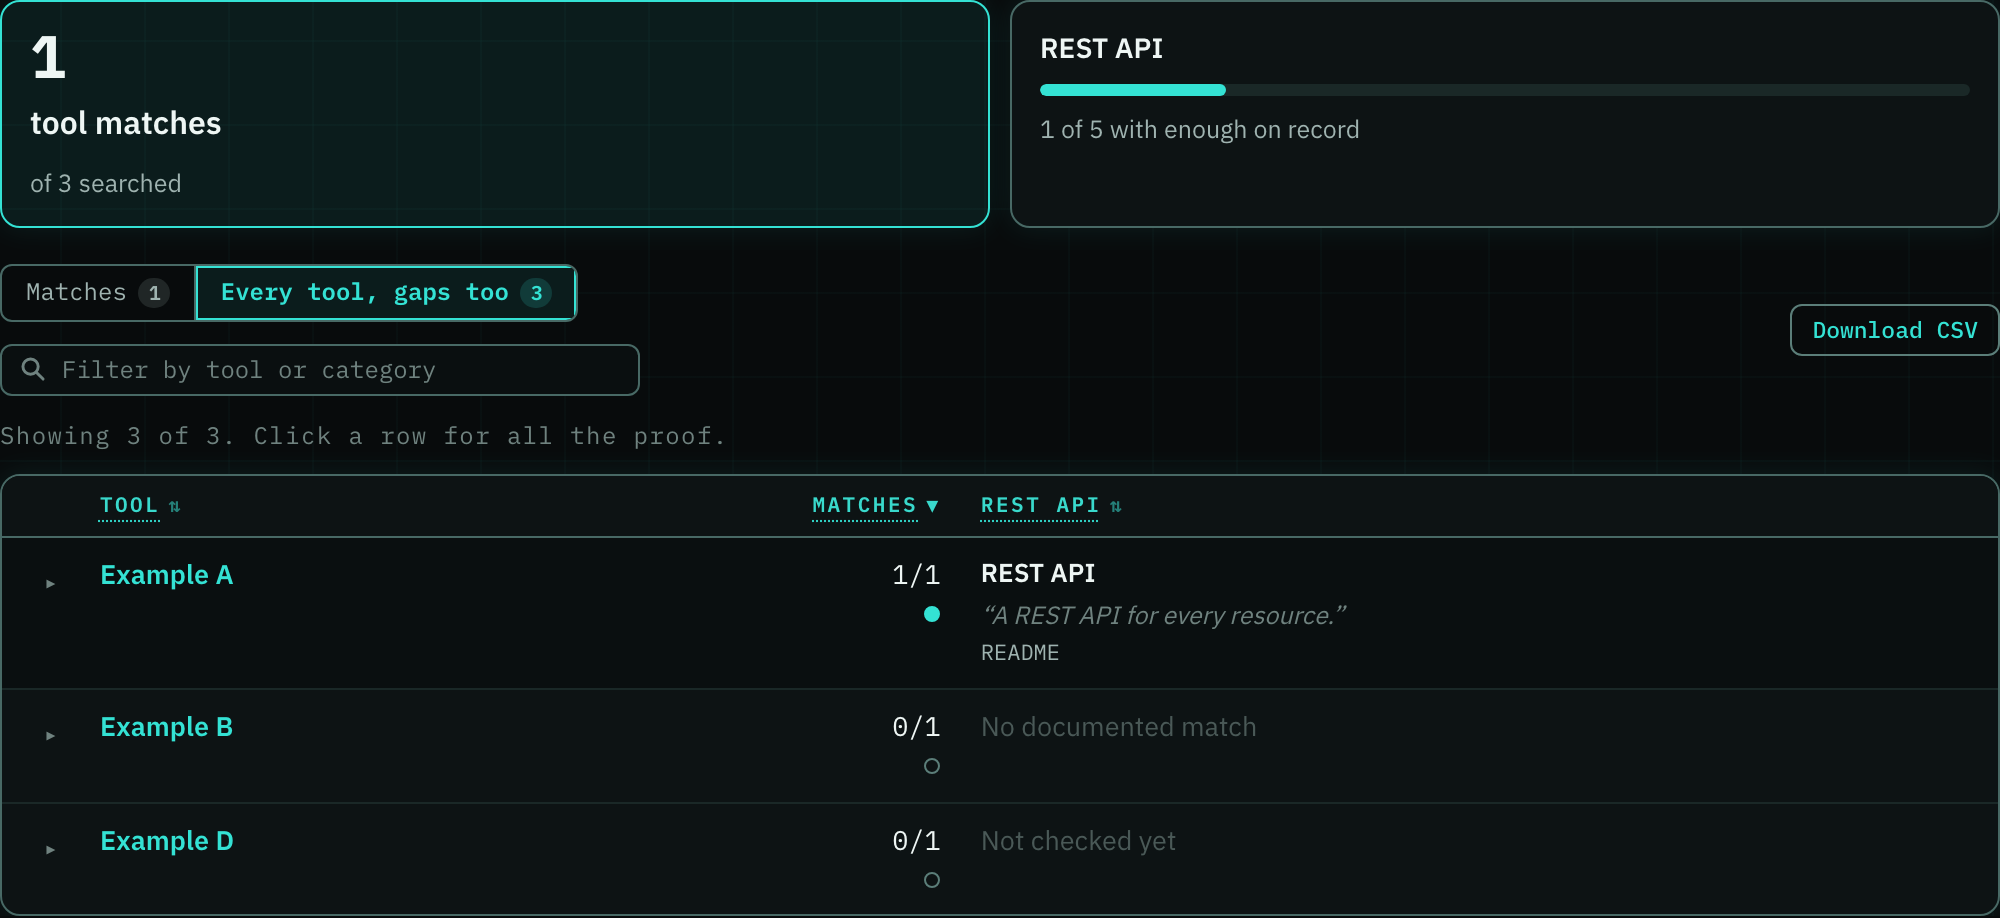
Capability Search now says the same thing the same way. A cyber tool we found nothing for reads No documented match, and one we haven't looked at yet reads Not checked yet. Before, the page used several different phrases for those two cases, so a blank could mean either "we looked and found nothing" or "we haven't looked". Now you can tell them apart at a glance.
- Improvement A tool's type now lists every form it ships in, so a server you host that also comes with a control CLI shows both instead of just one. Ask the API for tool_type=cli and you get every tool that has a CLI, whatever else it ships as. Operating systems like Kali and Security Onion, and models, now have types of their own instead of being filed as servers or libraries. Skills and agent files, the text a coding agent reads and follows, are a type of their own too. Tools typed "other" are being re-labelled by hand over the next few days.
- Improvement Gaps in the API and MCP replies now come with a reason. A cyber tool we looked at and found nothing for is marked as a genuine gap, and one we haven't read yet is marked as unchecked. Before, both came back as the same empty cell, so a script or an AI assistant could rule out a tool we simply hadn't looked at. Now it can tell the two apart and ask us to check the unchecked ones.
*
Oct 24, 2026
-
Improvement
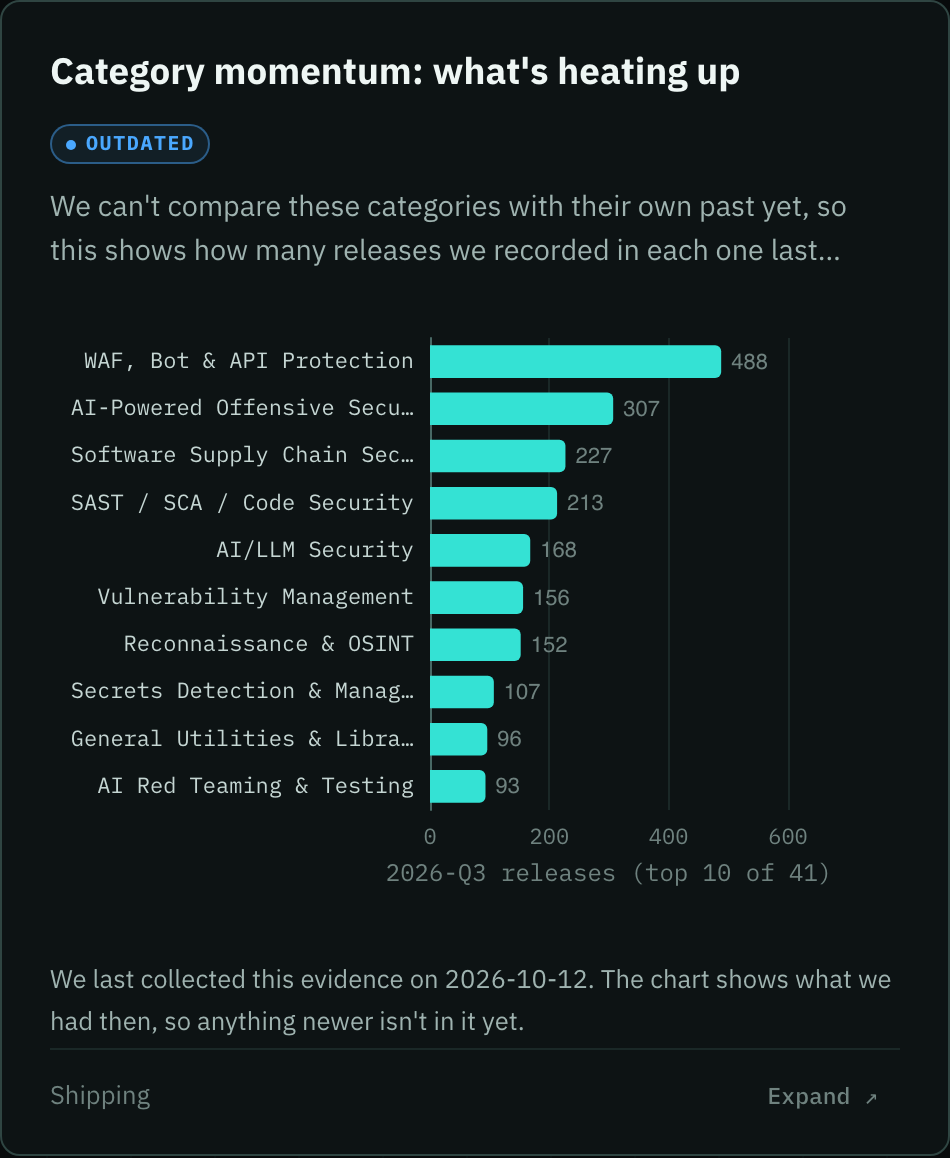
Charts with older evidence now stay up. They carry an Outdated label and the day we last collected the data, so you can still see what we had and know how current it is. When we can't yet compare a category with its own past, category momentum shows a bar chart of how many releases each category shipped last quarter, busiest first.
-
Improvement
Commands you copy from an issue or a tool page are now checked for characters that look like ordinary ones but aren't, such as a Cyrillic letter inside a web address or a hidden mark that reorders what you see. A command that fails the check is left out with a note, so the line you paste always does what it shows.

-
Improvement
Each release's install commands now stay folded to one line until you open them, so an issue is shorter to scroll on a phone. A link to a tool's entry opens them for you, and printed or PDF issues still show them in full.
-
Improvement
The AI assistant chart on Analytics now shows how fast code is piling up on GitHub: from 1 billion commits in all of 2025 to 275 million a week by April 2026. You can read our repository numbers against that growth, and the figure links to its source.

-
Improvement
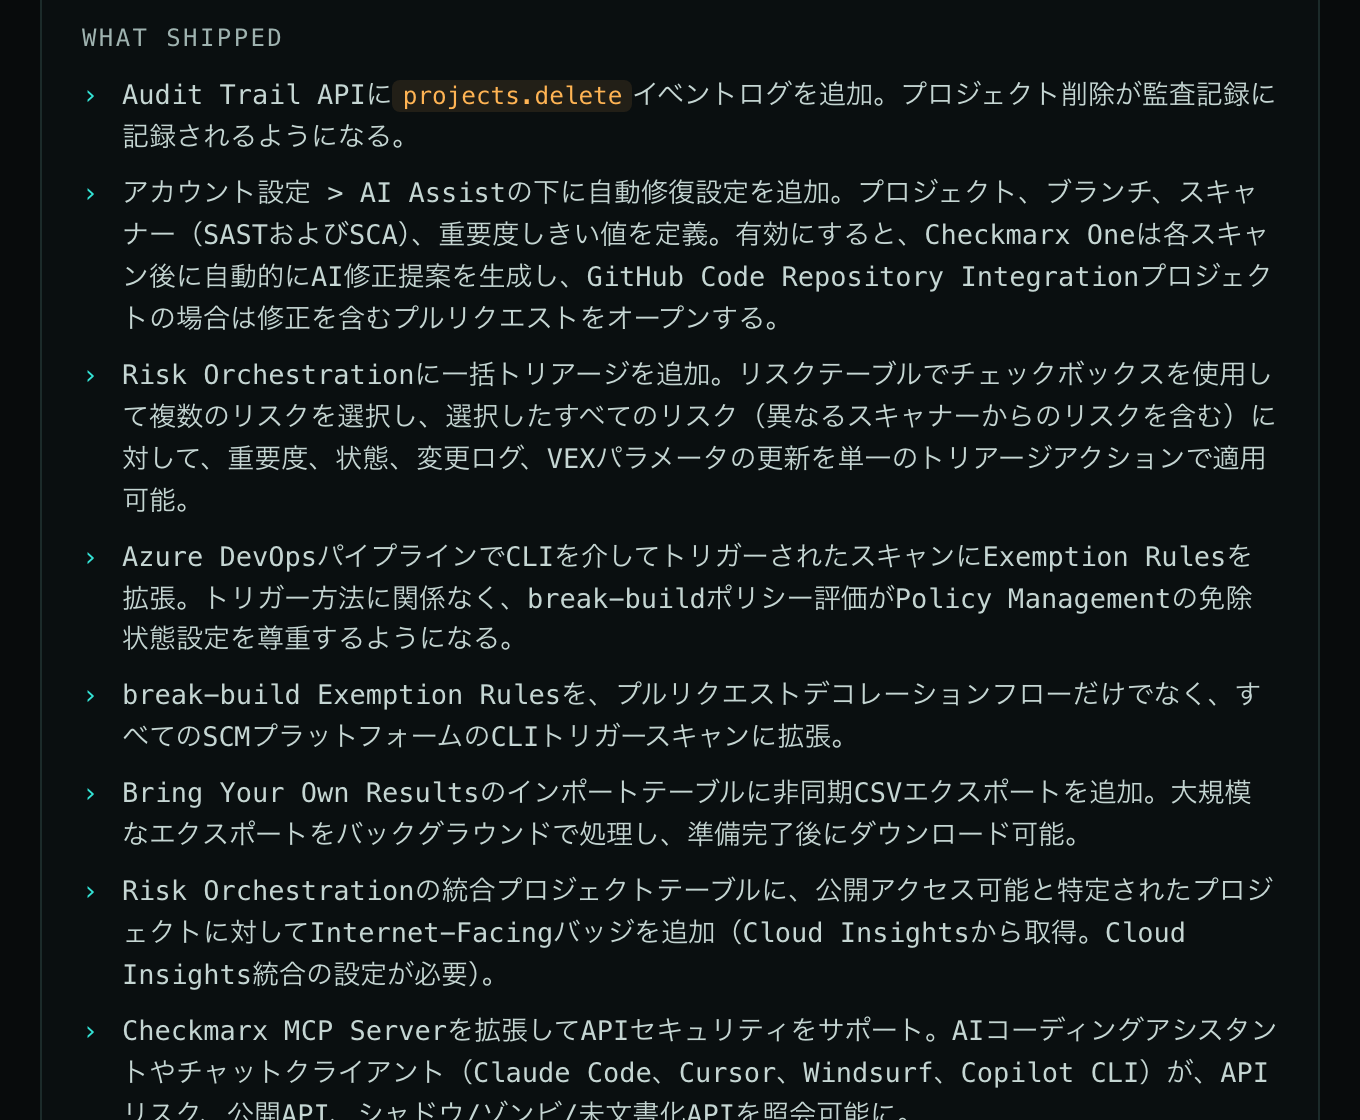
The releases in your monthly and quarterly Grep reports now read in your language, the same way they do in the daily issue. If a few haven't been translated yet, the report says how many stayed in English. The download links don't change, so the files you share match what everyone else gets.
-
Improvement
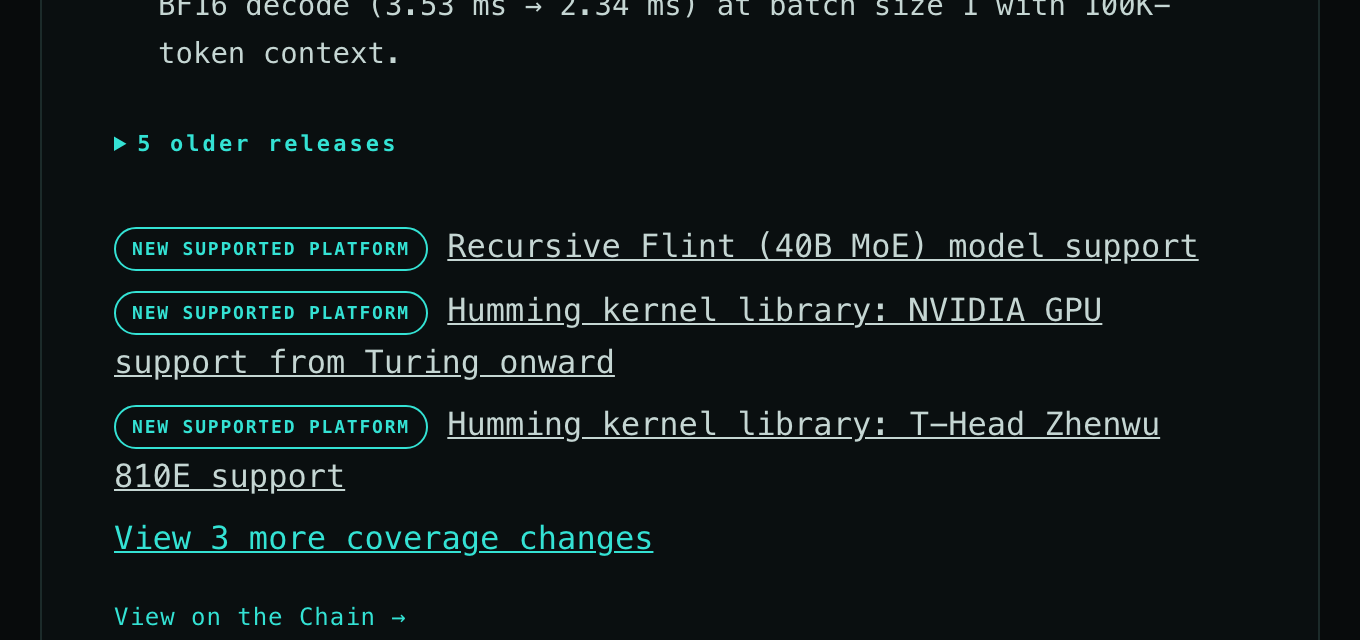
Head now shows each new detection, integration or supported platform as its own labeled badge with a link to the release notes, the same way Tail does. Before, the Head email only gave a count like "Integrations: 2 changes", so you had to click through to see what actually changed. Now you can tell at a glance what a tool added or retired.
-
New feature
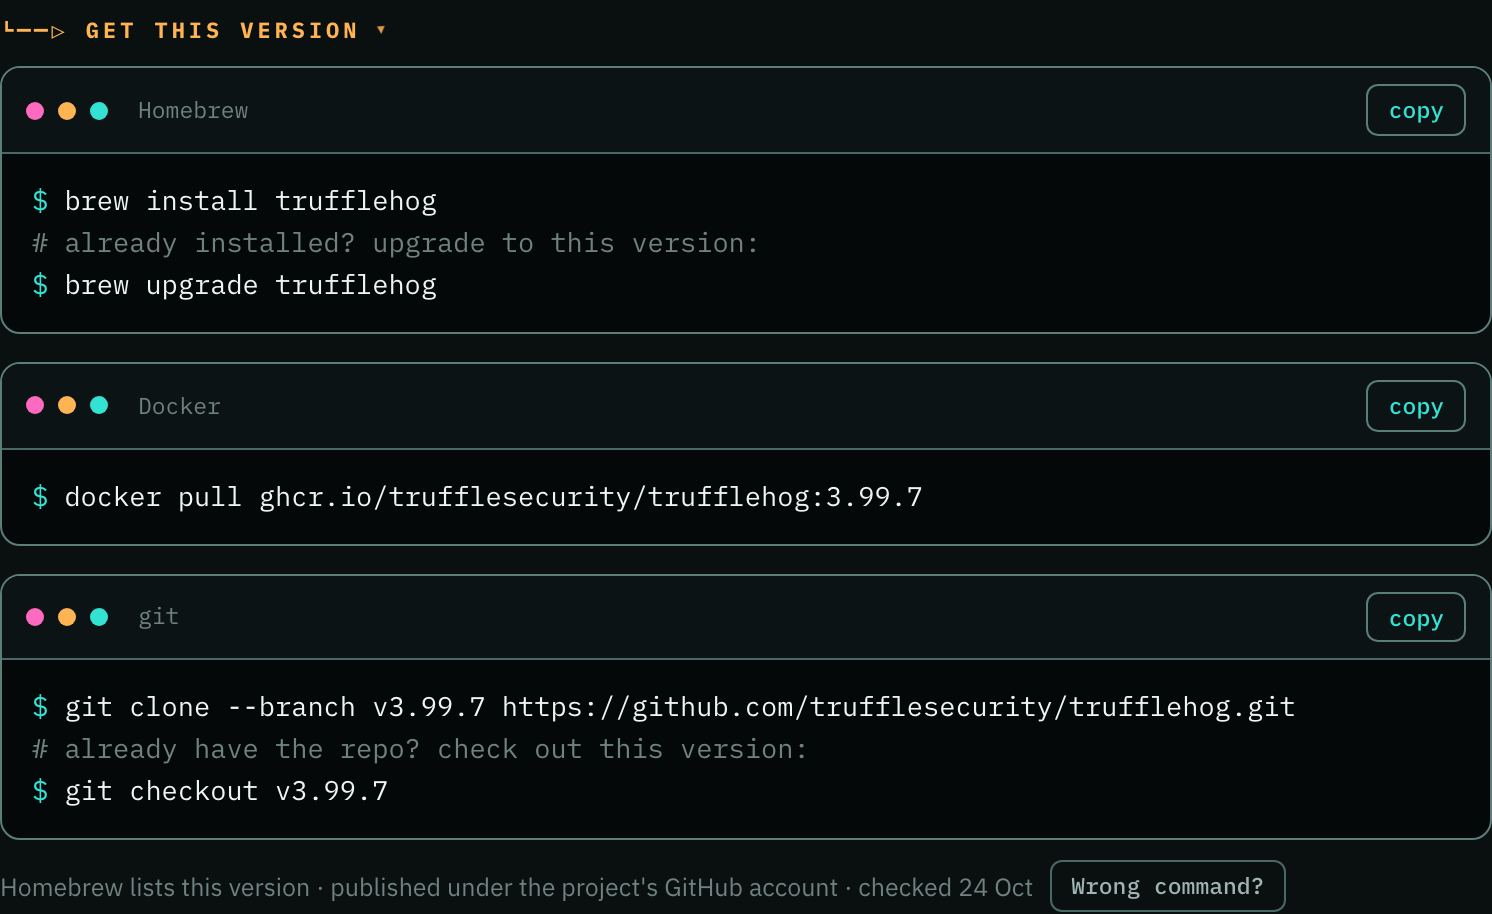
Releases now show how to install them with Homebrew, pipx, npm, Cargo or Docker when the project publishes there, not only with git. We check each command against the project's own repo before we show it, so you're never pointed at a look-alike package.
-
Defect fix
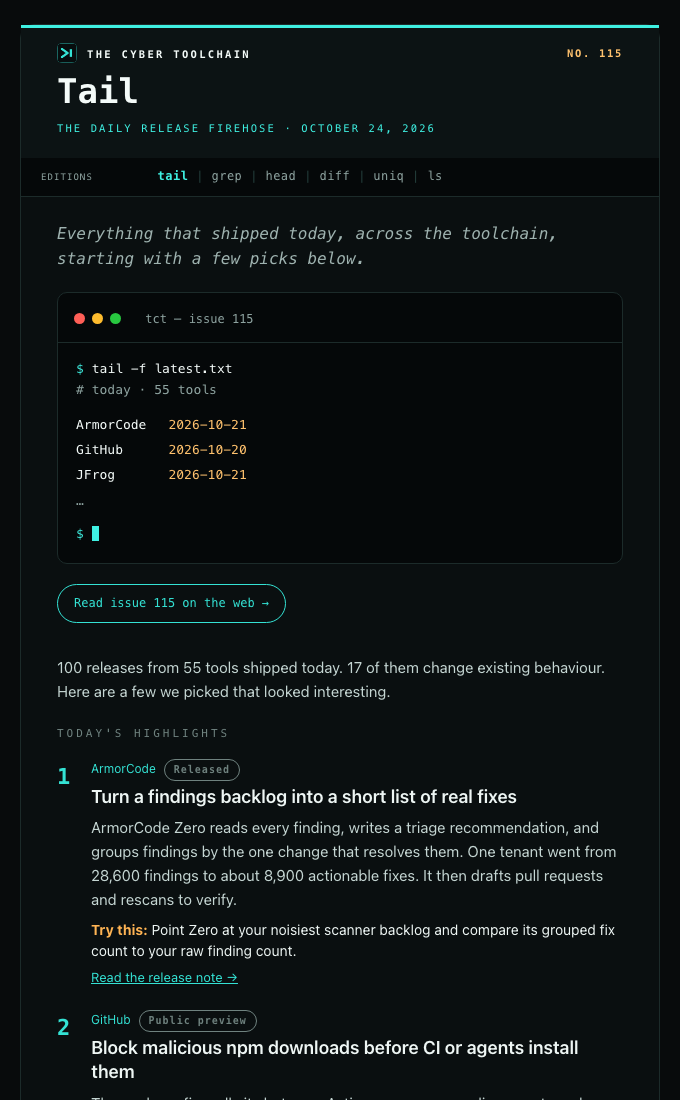
The Tail email now always opens with a few picks. Before, an issue whose picks weren't ready mailed a short note and a link instead. Now we write the picks when the email goes out, so you get them every time.
-
Improvement
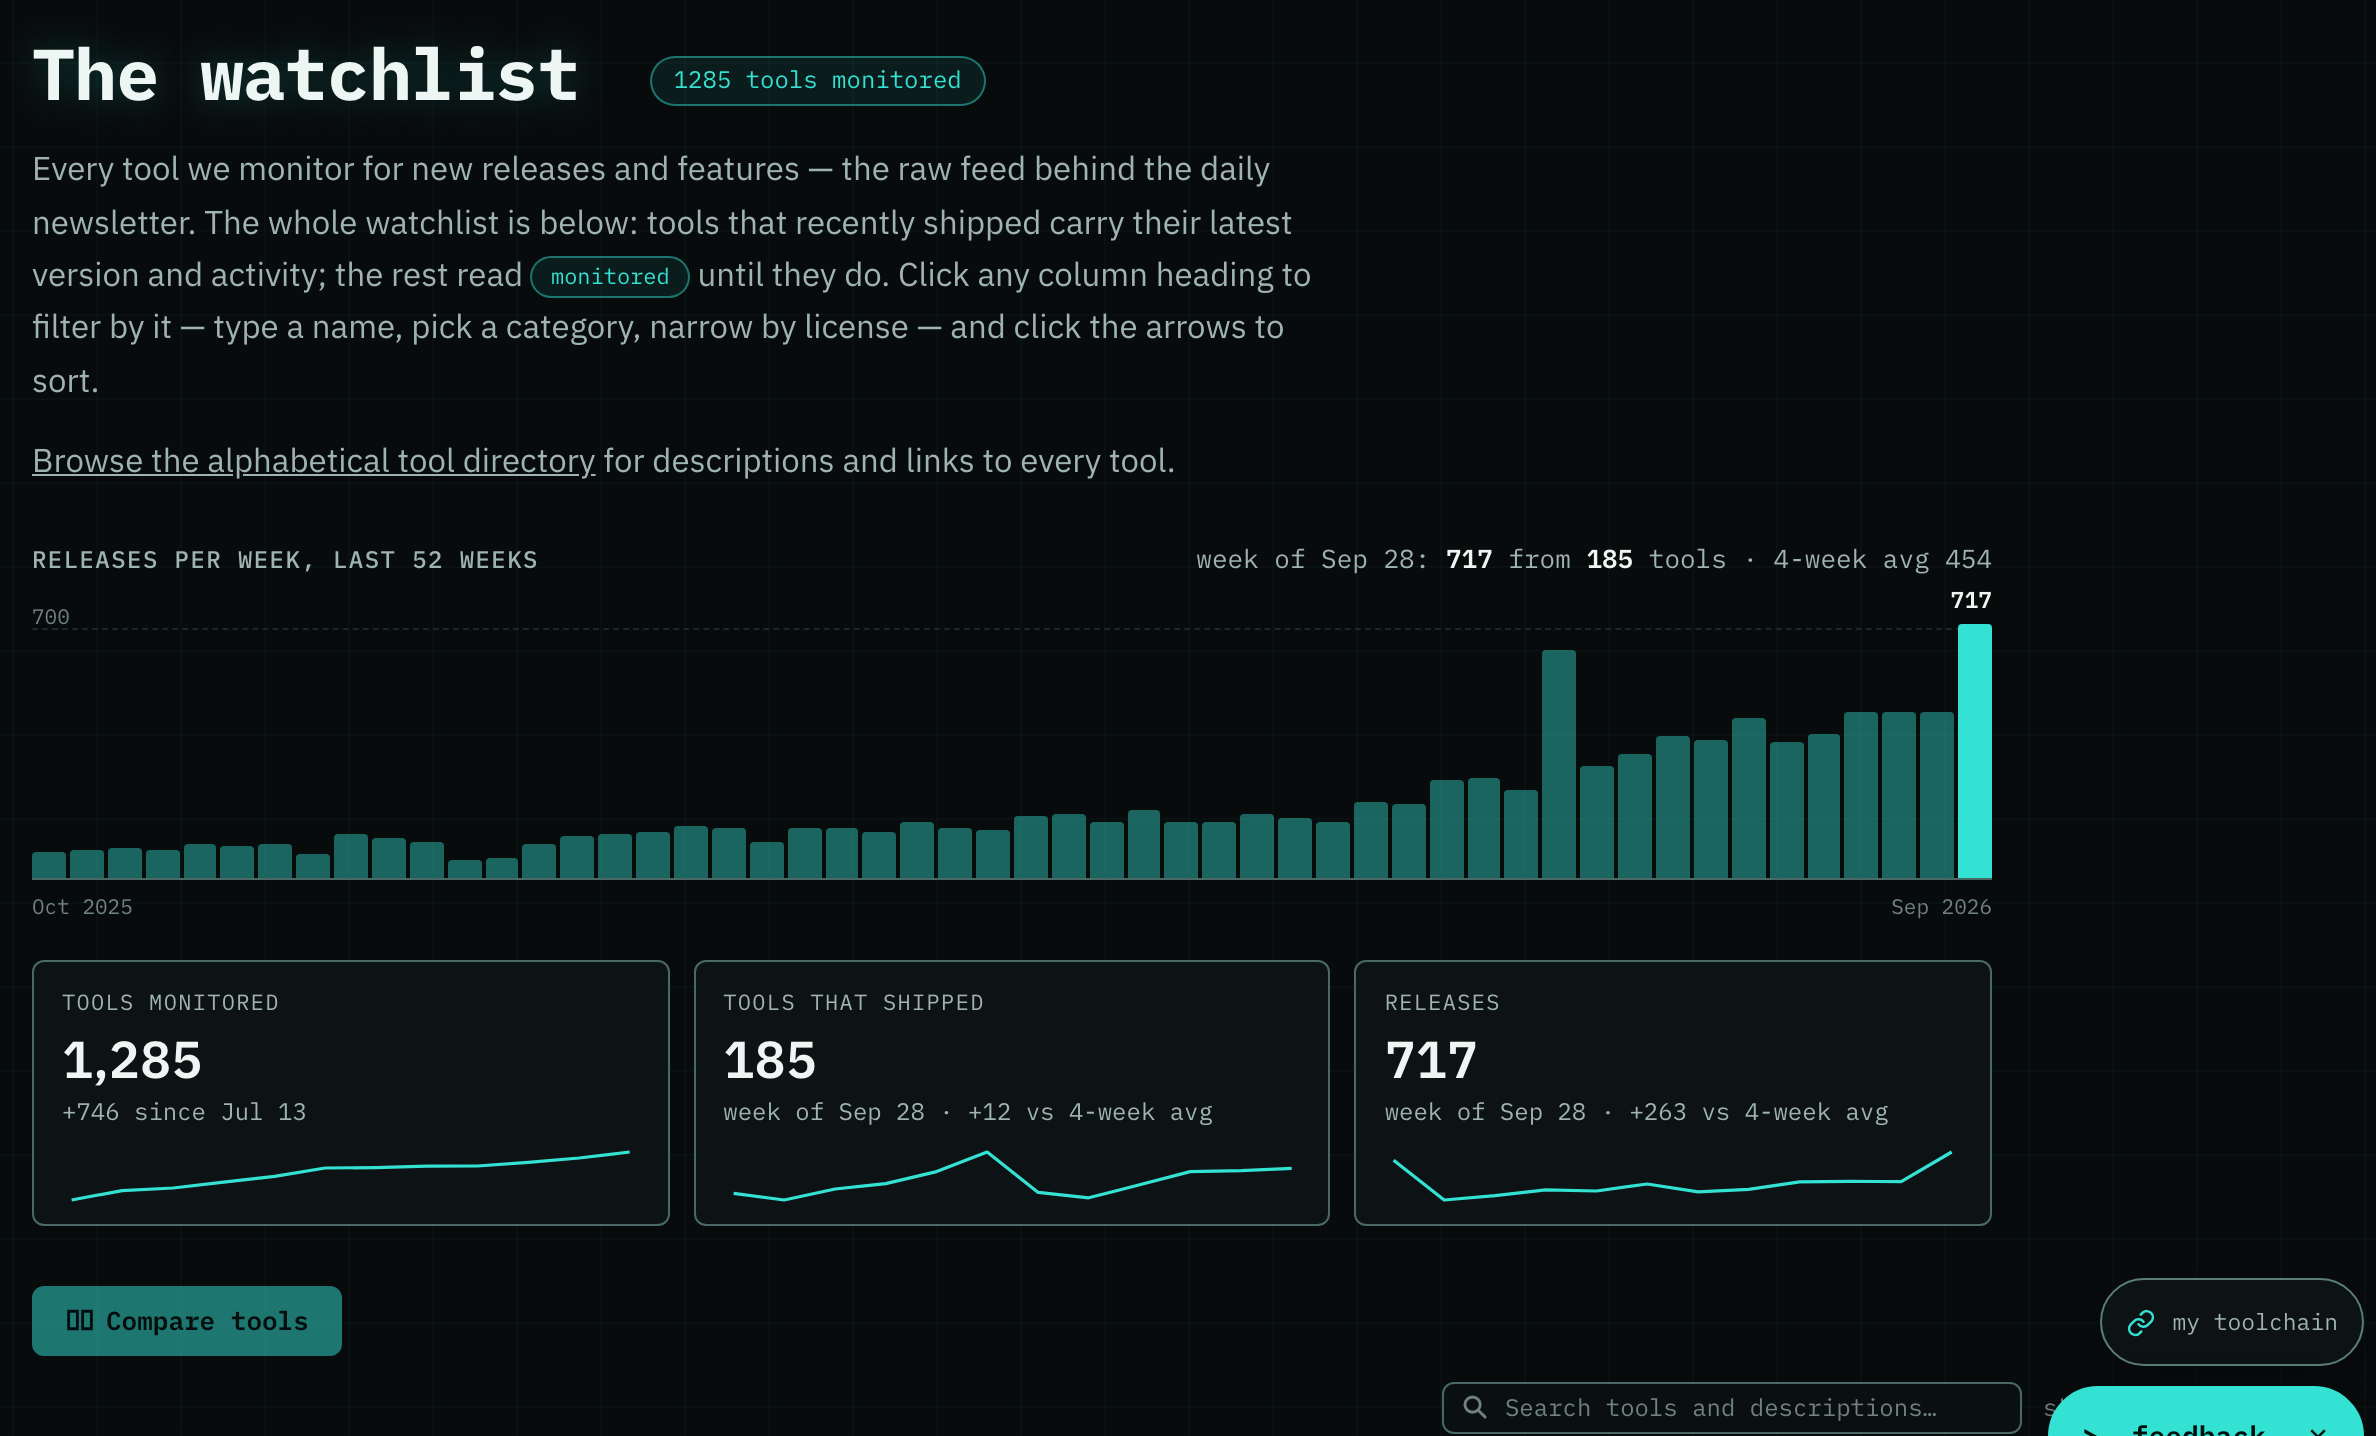
The watchlist header is simpler now. We took out its own "detect my toolchain" button, which did the same thing as the paste box in My Toolchain. To find the tools you run from a brew list, a Brewfile or a requirements.txt, open My Toolchain and paste it there, so building your toolchain all happens in one place.
- Improvement When Capability Search quotes a tool's own README, docs or website, it now shows the day we last read that page and when we'll read it again. We re-read those pages every day. If the words are gone, the cell says "No longer on the page" and when the page last said it, so an old quote never passes for a current match.
- Improvement If you read in another language, your emails now arrive fully in it: Diff's weekly documentation changes are translated too, subject lines are written in your language instead of an English template, and fewer passages fall back to English.
- New feature When you ask your AI assistant which tools can do something, it now finds tools that describe it in different words. Before, a tool only showed up if its notes used words close to yours. Tools found this way say "Matched by meaning" so you know why they're there.
*
Oct 23, 2026
-
Improvement
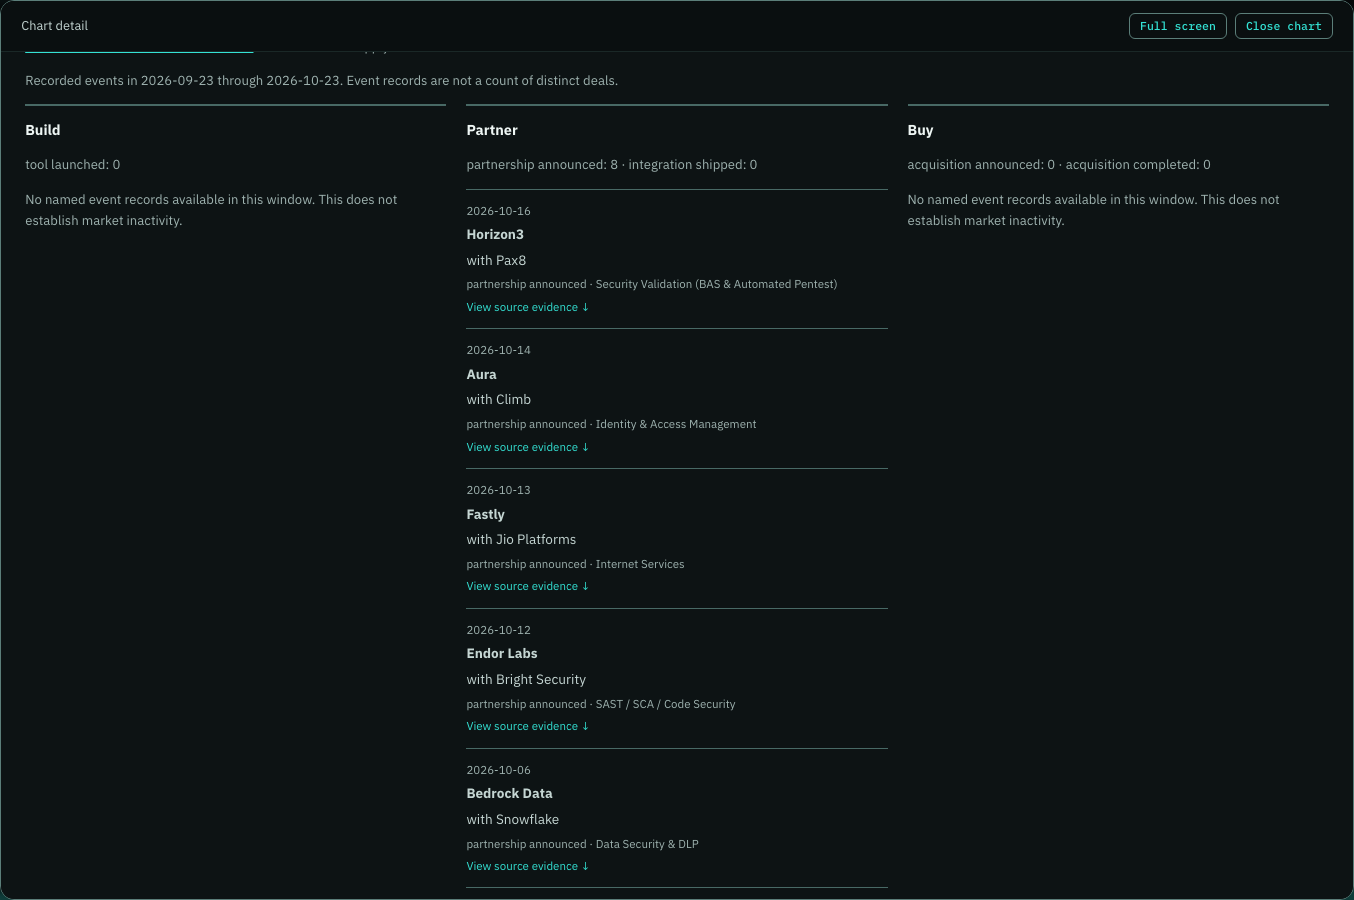
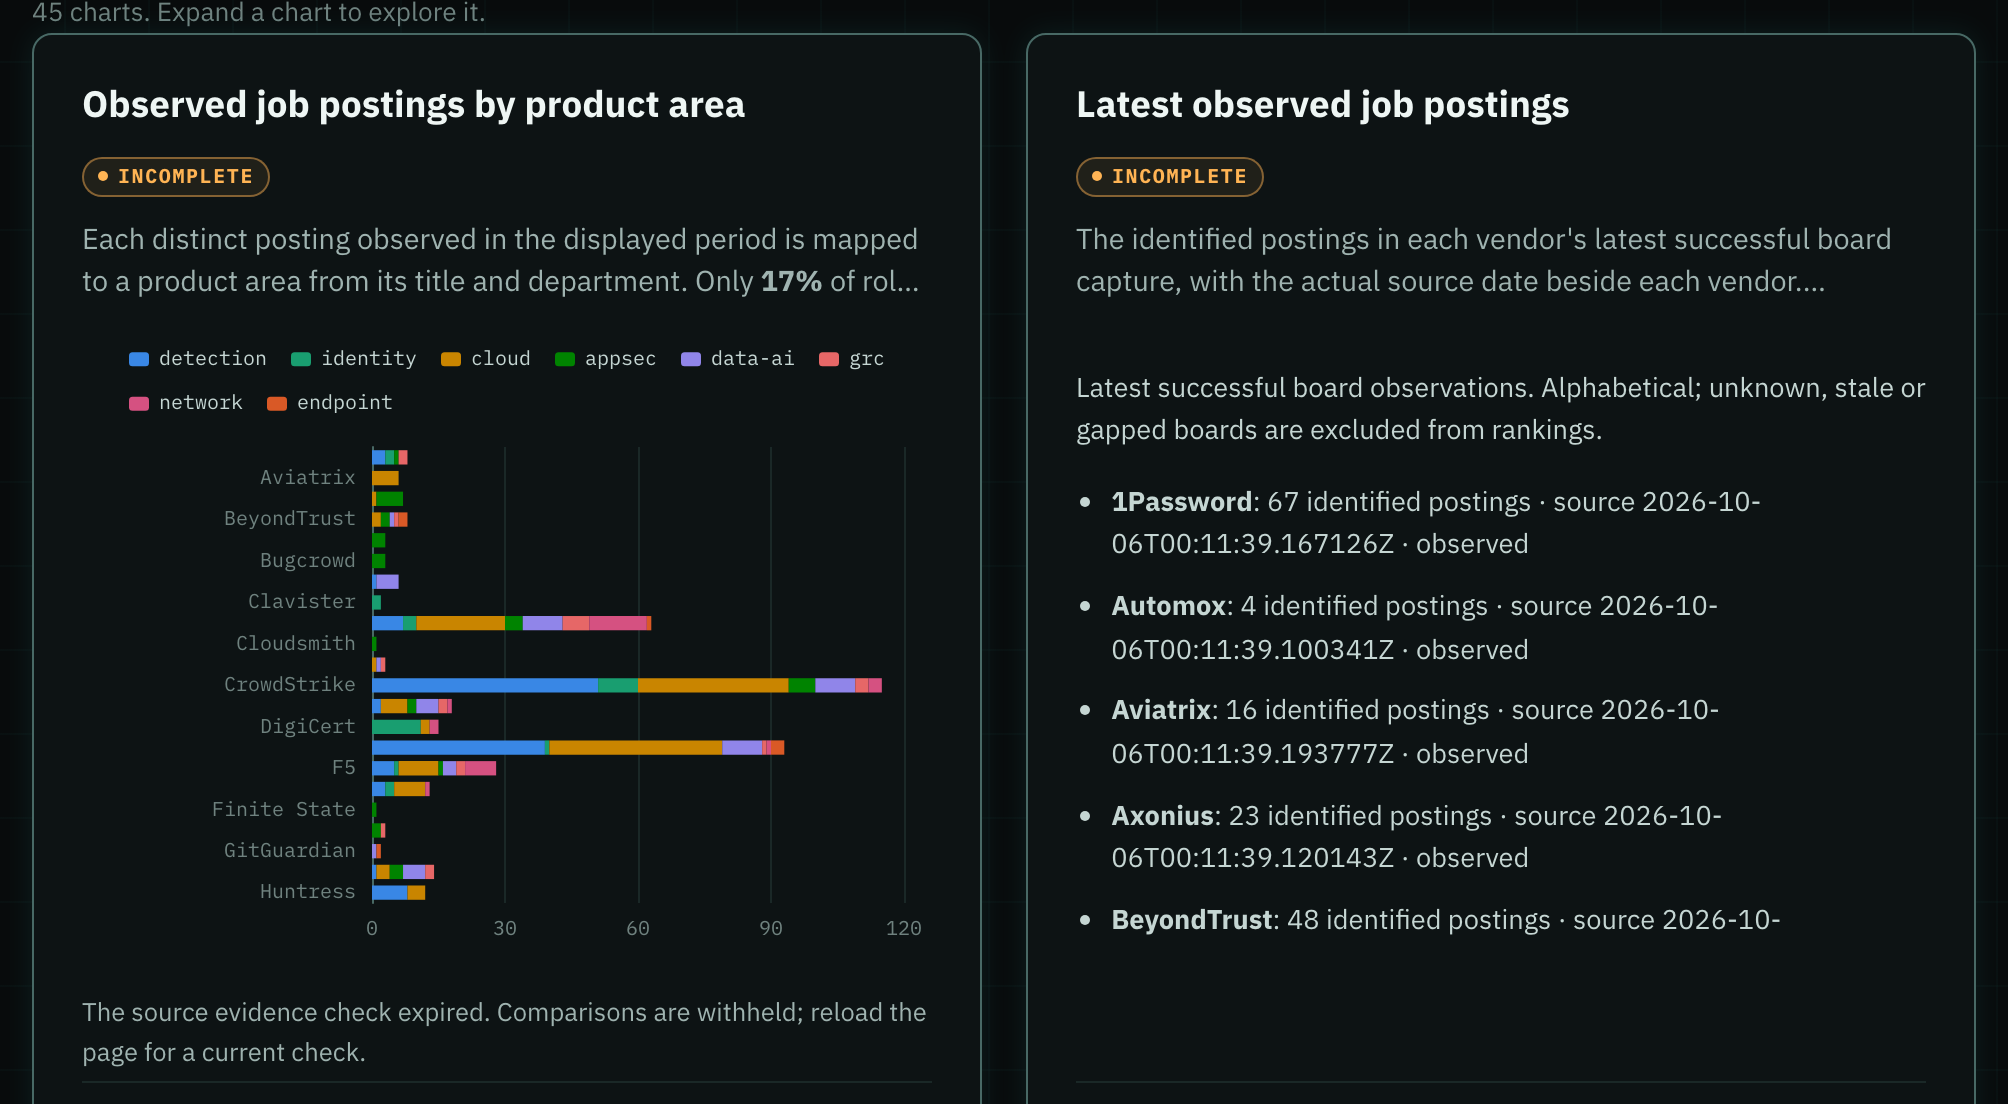
Expanded charts now show observed versus eligible coverage, missing and stale inputs, and source dates, so you can judge the evidence behind a comparison. Previews with unsupported comparisons are withheld.

-
Improvement
Company origins and market activity now have selectable year cohorts, named event records and source links. Category mix shows the company count behind each percentage, and momentum keeps category labels visible while withholding unsupported comparisons.
-
Improvement
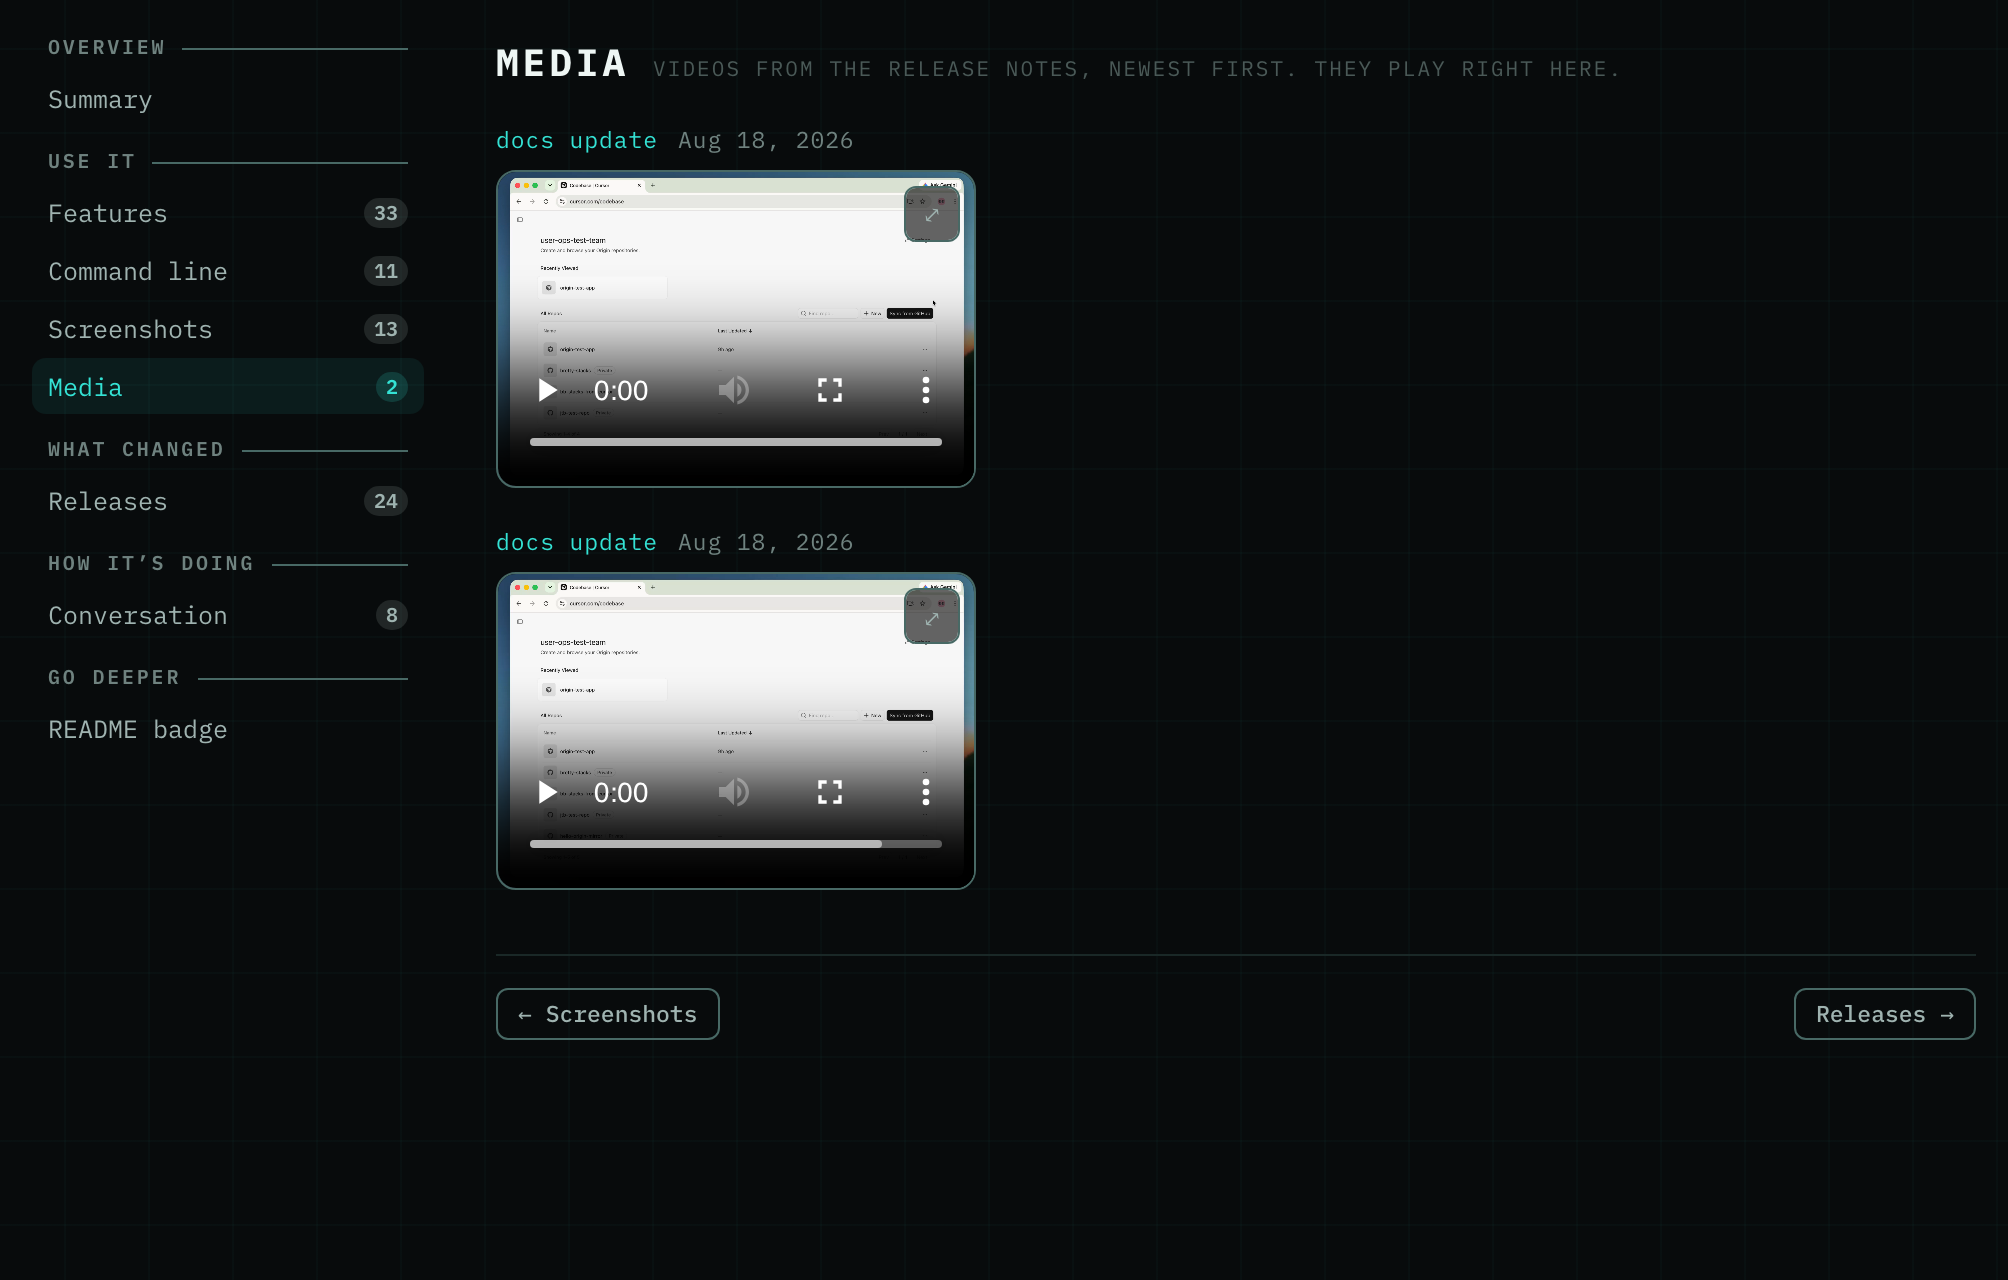
Tool pages are no longer one long scroll. A menu down the left groups what's on the page, you read one section at a time, and Previous and Next walk you through the rest. The address names the section you're on, so a link you share opens right there. Screenshots and demo videos from a tool's release notes now have sections of their own, and the videos play on the page. When a tool has a lot of articles, they're split into tabs by kind, so you can go straight to tutorials or to the attacks it was used in.
-
New feature
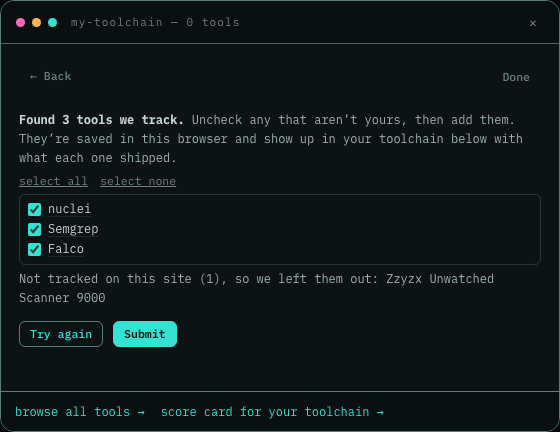
My Toolchain now walks you through adding your tools. A first visit explains why it's worth doing, then you pick a way: star a tool, paste a list from your AI assistant, or search and pick each one. The assistant prompt checks your machine for evidence of what you run, not memory, and one prompt covers both sites. After you paste, you get a screen with just the tools we found, and you hit Submit. Tools we don't track yet are shown, and we take a look at whether they belong on the Toolchain. Tap a tool's name or a card in your list to open its details. Close it empty and we ask once more instead of leaving a blank box.
-
Improvement
The home-page chart pairs monthly bars with a line showing the rise in software creation over five years. Source dates and missing-data gaps stay visible, without a headline total.
- Defect fix Menus, buttons and the account setup steps now switch language with the rest of the page. Some of them had stayed in English since October 22, even after you picked another language.
- Improvement The Tail email now opens with a few releases we picked that looked interesting, each with a line on why it matters. Before, it was the whole day's firehose in one long email. Now you can read the picks in a minute and open the issue on the web when you want every release, which is all still there.
*
Oct 22, 2026
-
New feature
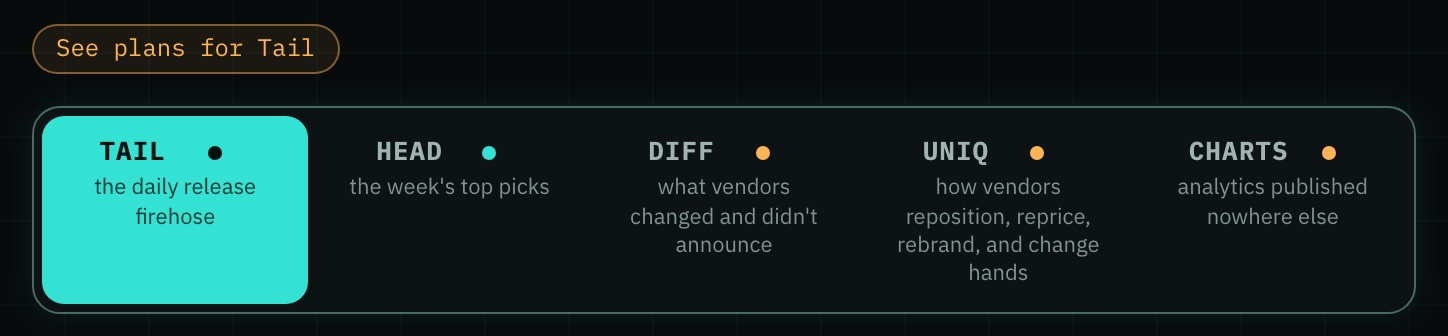
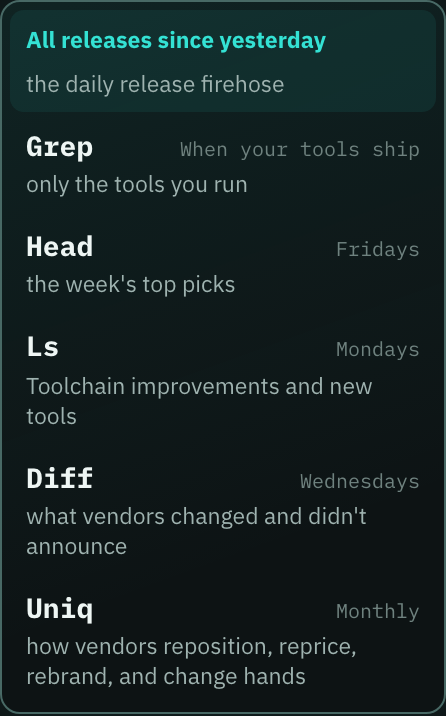
Point at a newsletter in the sidebar and its name turns into what you'd get from it, like "All releases since yesterday" for Tail. You can tell the newsletters apart without opening each one.
-
Defect fix
A security advisory on a tool's timeline is now labelled as one, and it no longer counts as a release. Trivy's CVE-2026-55092 used to sit in the release history like a version, with a clone command for a tag that doesn't exist. Now it reads "advisory", it offers no clone command, and release counts only count what the tool actually shipped.

- Defect fix The activity chart on this page shows our commits for every week again, not just the latest one, so you can see how steadily the site is being built alongside the updates we ship.
- Improvement We now track five more tools, including Nebulock's Agentic Threat Hunting Framework, an AI DFIR toolkit and Datadog's pathrunner. Their release notes show up in the newsletter from the next issue, and each has a tool page with its history.
- Improvement The Features and Command line sections on each tool page now open with two or three plain sentences instead of a long paragraph, so you get to the list faster.
- Improvement The panel at the top of every tool page is now titled “How [tool] helps”, so you can tell at a glance it's about what the tool does for you.
- Improvement The stack-to-toolchain diagram on What is a cyber toolchain? now labels the pile of tools on the left Stack, so it reads as the move from the tools you have to the tools connected into a chain.
- Improvement More of the back catalog now reads fully in Japanese, German, Chinese, Spanish, Portuguese, Korean and Hindi. We retranslated the passages that came back mangled the first time, about half of them, so fewer past issues fall back to English mid-page.
*
Oct 21, 2026
-
Improvement
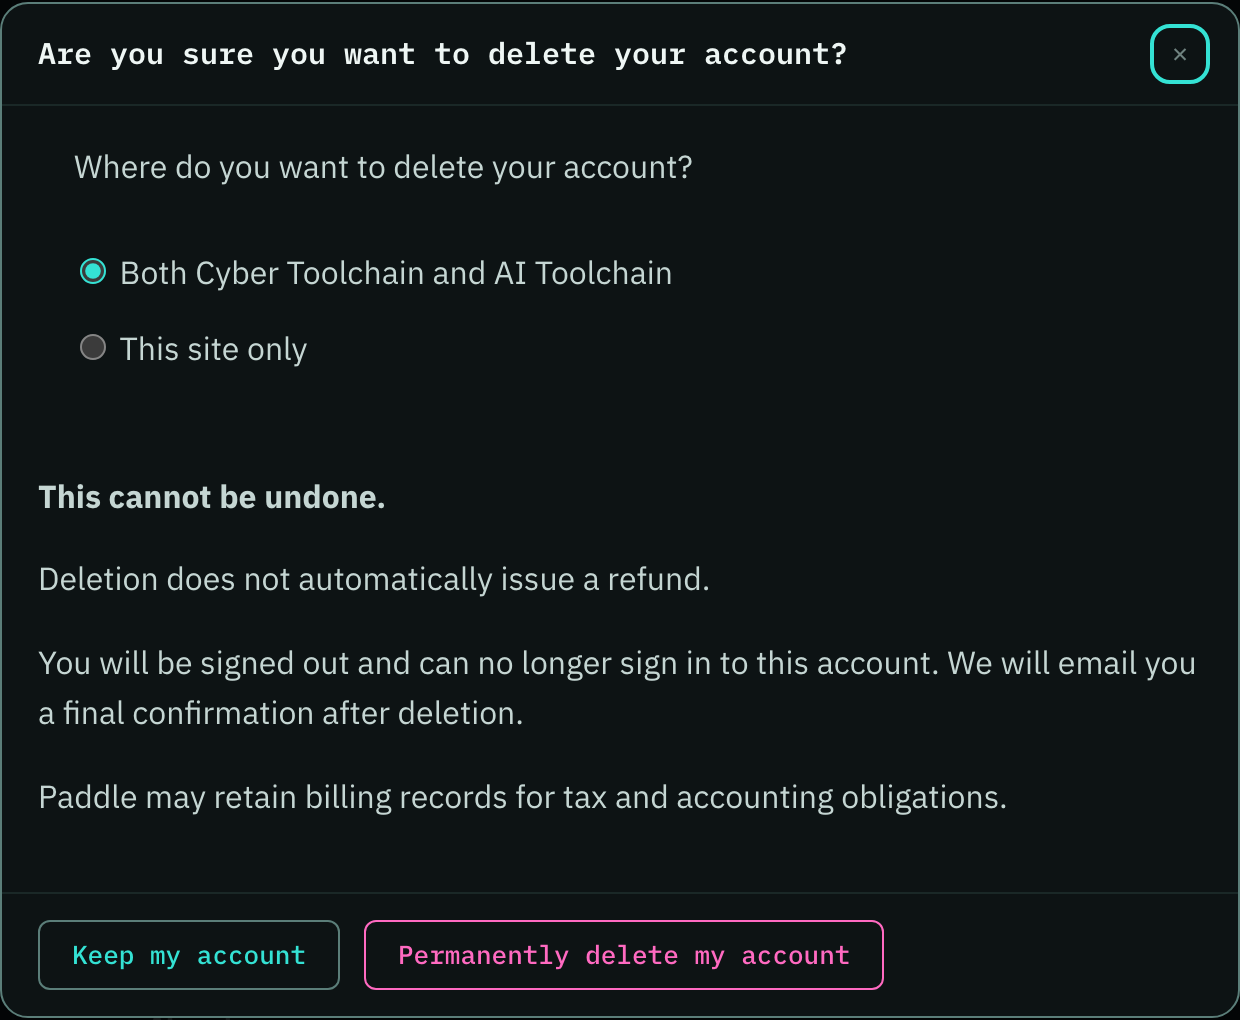
The box that asks before we delete your account now looks and works like every other box on the site. It has the same title bar with a close button in the corner and the same row of buttons at the bottom, so it's clear how to back out. Closing it always keeps your account.
-
New feature
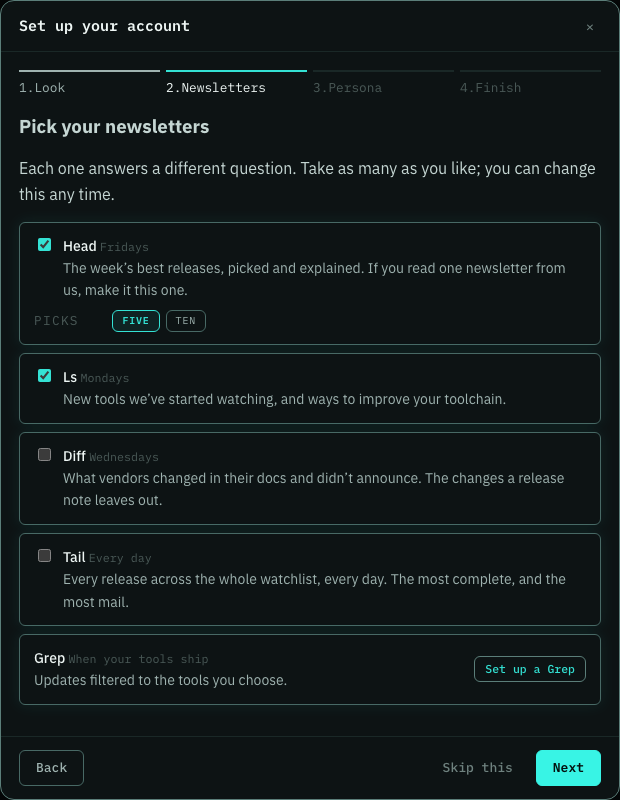
The first time you sign in, a short setup now walks you through your account: pick your language and the palette your newsletters arrive in, choose your newsletters with a line on what each one is for, set up a Grep for just the tools you run, and on a paid plan pick your role and watch a sample issue change as you do. Then send yourself a test issue to see it in your inbox. Each step saves as you go, and Run setup again on your account page picks up where you left off.
-
Improvement
Buttons now look and respond the same on every page, including tips, the scorecard, vendors, website history and the API reference. Before, some pages drew their own, so the same action could look different from one page to the next and you had to work out what was clickable.

-
New feature
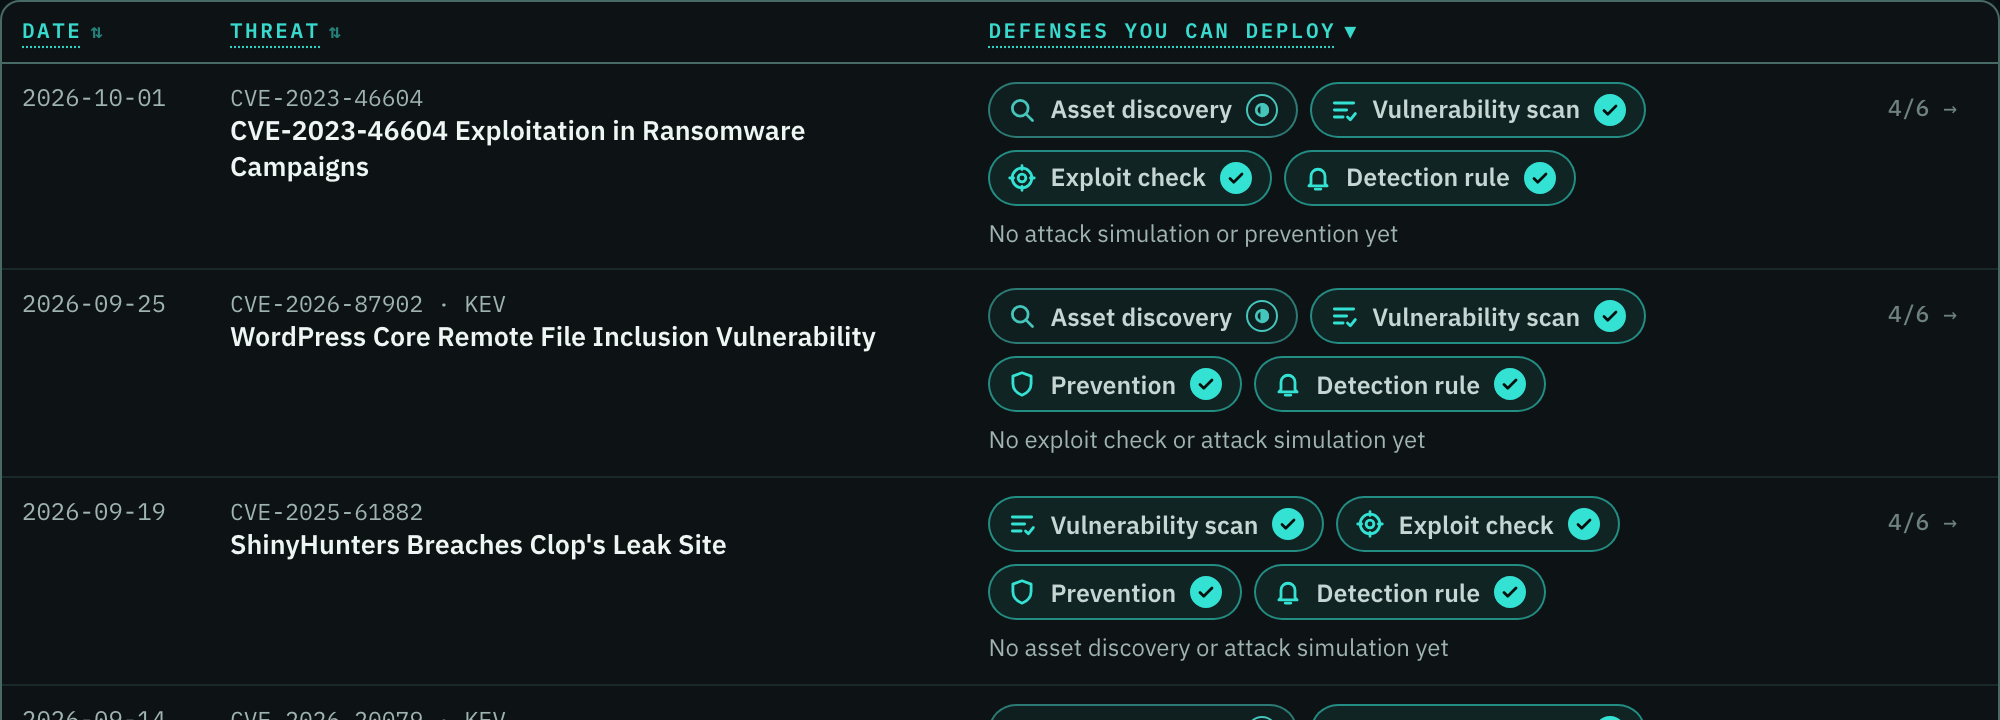
The threat list, the category table on threat coverage and the pricing table on analytics now sort from their headings, the same way the tools list does. Click a heading to sort and click again to flip it, and blank values stay at the bottom either way, so you can put the threats with the most defenses you can deploy at the top in one click. On the threat list the keyboard follows the order you picked: j and k walk the sorted rows and Enter opens the threat. The plans comparison also uses the same row spacing as every other table now.
-
Improvement
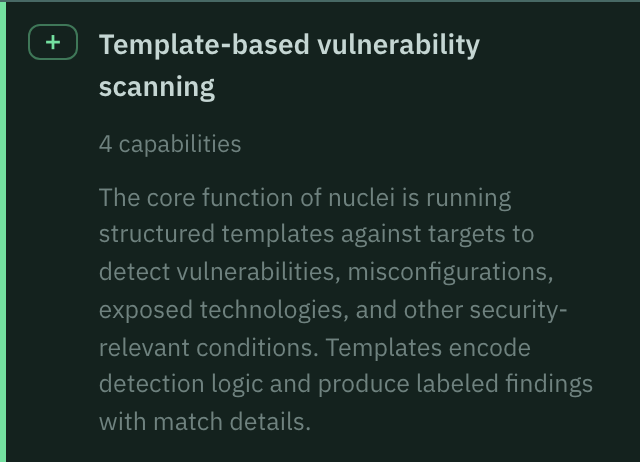
A small one: tool pages now use the same rounded corners as the rest of the site. Badges, bars, dots and code snippets on a tool page each had a slightly different edge, so the page looked a little off next to the others. Now they match from page to page.
-
Improvement
A small one: the tool preview you open from the tools table now uses the site's usual spacing, corners and shadow. The install command has a bit more room, the embedded video has the same rounded edge as videos elsewhere, and the hint on a greyed-out button looks like every other pop-up on the site.

-
Defect fix
A small one: the headline on the tools table is now the same size as the headline on every other page. It was a touch smaller, so the title jumped a little as you moved between pages.

- New feature When you ask your AI assistant or the API for a tool's release history, you now get every release we've read, not just the ones that made it into an issue. Older releases are marked as backfill so you can tell them from this week's news, and a release that appeared in two issues now shows up once.
- Improvement What is a cyber toolchain? now walks through three toolchains at work: taking a server with a known-exploited (CISA KEV) flaw off the internet, patching a critical flaw tonight instead of in next week's window, and turning an alert into a contained incident. Each one explains the work without naming products, draws the chain with its branches, shows the real tools for any step when you hover or tap it, and saves the ones we follow to My Toolchain in one click. Clicking a tool opens its details in place. The diagram at the top shows fourteen licensed tools, the eleven in use, and three jobs they do together; a new section explains why to plan by toolchain instead of by stack. Both diagrams download as a PNG, ready for a slide. The page is now the featured piece on Articles.
*
Oct 19, 2026
-
When an update adds to what a tool covers, like a new integration or detection, you now see it as a badge on the bullet it came from. It used to sit in a separate box under the entry.

-
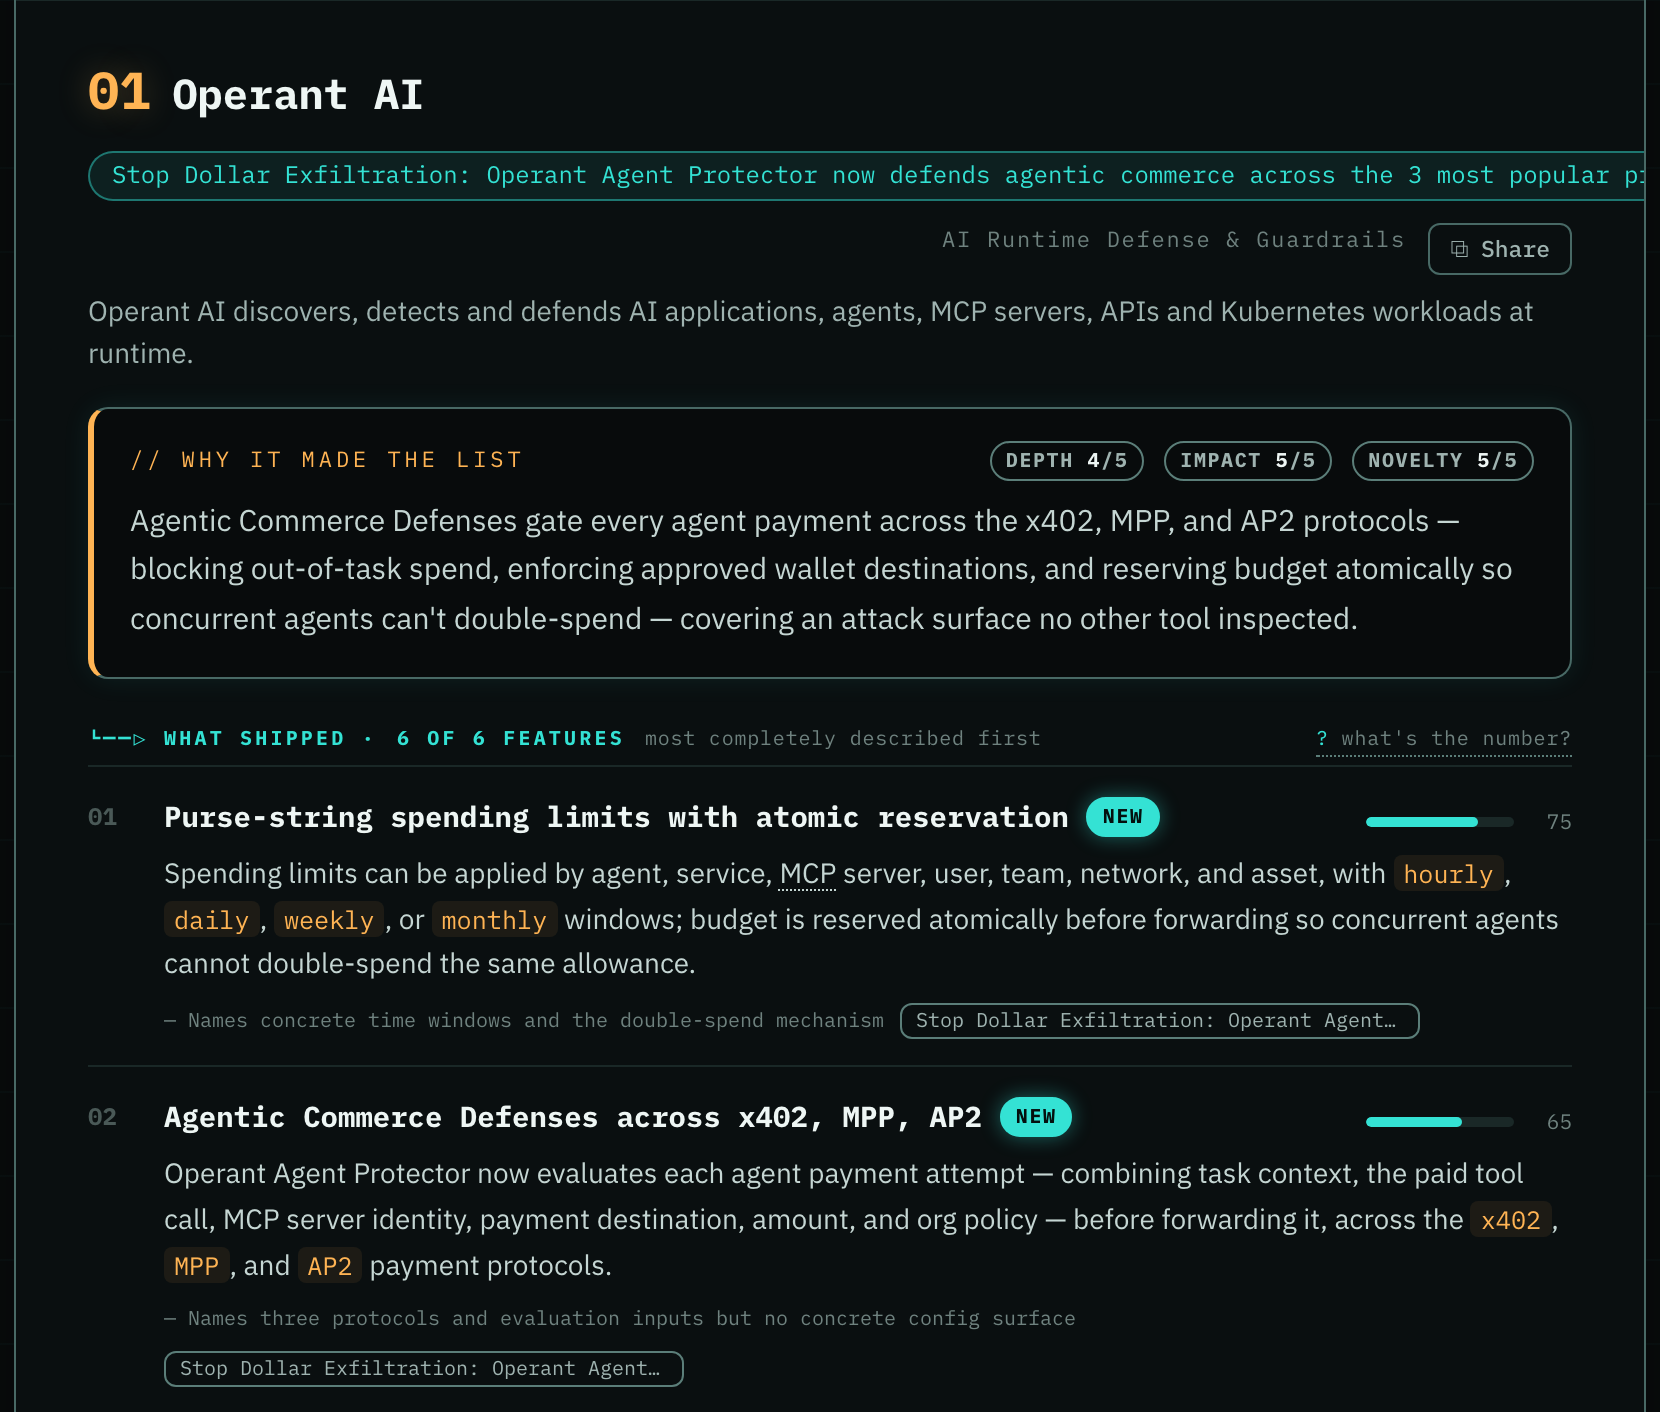
Briefed on Head now shows only the features each tool was picked for, so the short read matches the reason it made the list. Everything still shows every feature.
-
Improvement
The Ls newsletter now leads with the biggest changes and labels each one, so you can tell a new feature from an improvement or a fix at a glance. The same labels show on the Ls page and on this changelog, so you can skip straight to what is new.
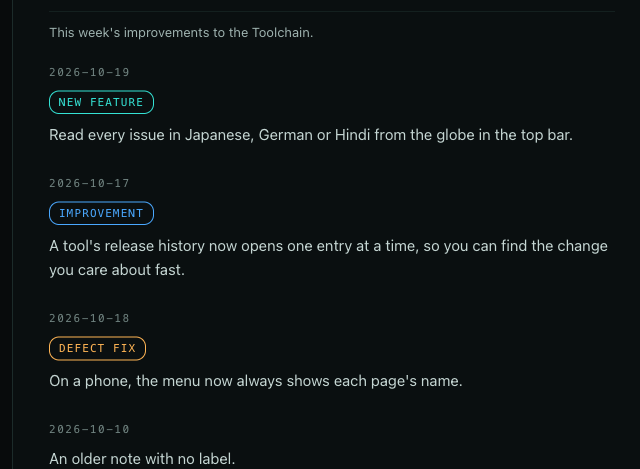
-
Features, Command line and Releases on a tool page now work the same way. Each one is a list on the left with the item you picked open on the right, the same Show and Search controls above it, and j and k to move down the list. Once you've learned one, you know all three, and you don't lose your place in a long list to read one entry.
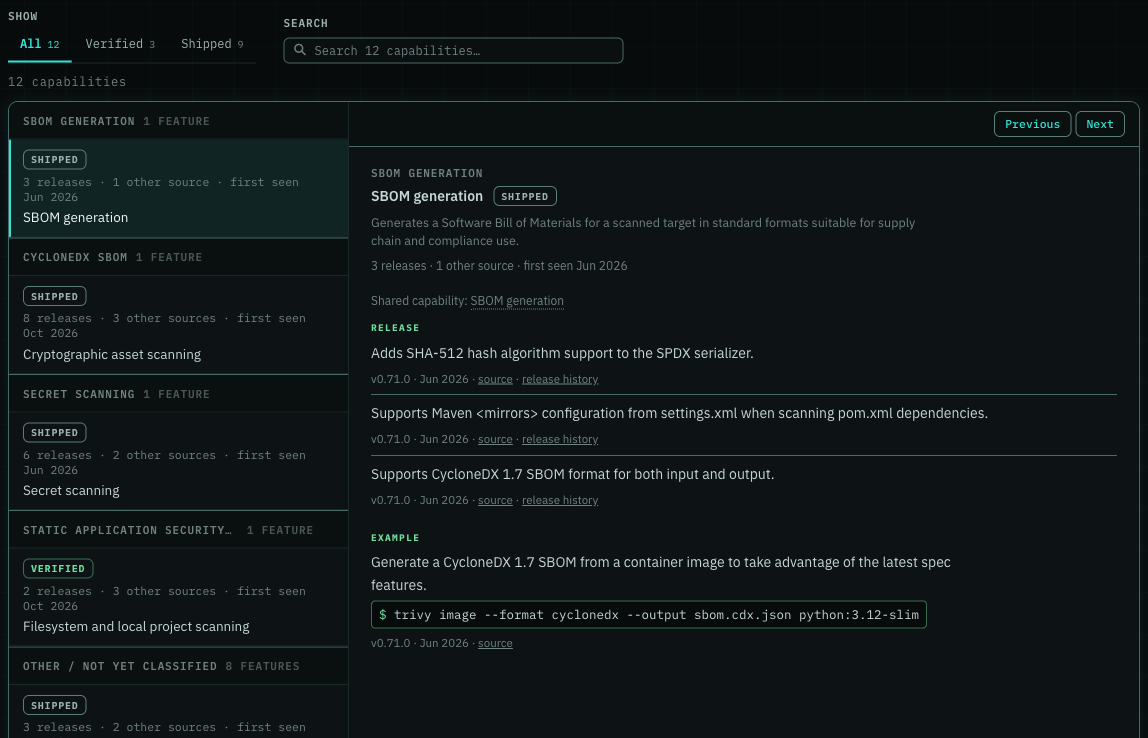
- Release notes now name each product the same way throughout. When a vendor shortens its own product name partway through ("Cloud SIEM" under "Datadog Cloud SIEM"), we spell it out in full, so one product never reads like two.
- Tool feature lists now go back years, through older release notes, not just recent ones. We now track about 31,700 features across 1,230 tools, roughly twice as many as before, so a Capability Search finds a tool that shipped a feature long ago, not only one that mentioned it lately.
- Additional filters on an issue now starts closed every time, so each issue opens on the entries rather than a row of controls. It still opens on its own when a filter is on, so you can always see why the list is shorter.
- The Add to Grep buttons in the New Tools email now stay on one line in Gmail on iPhone, so the list reads cleanly instead of breaking each button into a stack of words.
- Type a newsletter's name into search, like Head or Tail, and the top result opens its newest issue. Before, typing Head showed you tools named Headscale and old issues, and you had to go to the newsletter page to find this week's.
- You can subscribe without the mouse. Press ] until you reach the subscribe box, use j and k to move between the plans, and press Enter to pick one. You land in the email box, and Enter again signs you up.
- Tool pages now keep up with the product. When a vendor adds to its docs, changes the words on its website, rewrites its README or description, or ships a new API, we rewrite that tool's summary and highlights the same week, so the page describes the product as it is now rather than as it was when we first added it.
- The tools list opens faster. You see the first screen of tools right away and the rest arrive a moment later, so you can start reading without waiting for the whole list. Search engines can now read the page too, which makes it easier to find us when you search for a tool.
- Uniq's rebrand reports now support before-and-after evidence from captured product and linked pages, so you can see where those changes appeared.
- Defect fix Uniq can now include rebrand observations from a vendor's linked pages, with the same paired screenshots and dated evidence as its home and pricing pages. Those observations previously stopped the issue from rendering.
- Uniq now says what it covers: how vendors reposition, reprice, rebrand, and change hands. The old line only mentioned how vendors describe themselves, so it undersold the pricing, rebrand, and deal coverage every issue already carries.
- There's a new Webhooks page under Developers. It shows how you'll get a signed request at your own HTTPS address when a tool you follow ships, so you can wire releases into your own systems without polling. Webhooks are included with Researcher and Business, and they're coming soon.
*
Oct 18, 2026
-
You can now narrow the vendor list to companies that ship both open source and commercial products. Pick "Open source + commercial" above the table to see who you could start with for free and pay later, without reading the licence column row by row.

- Every past issue now reads in Japanese, German, Chinese, Spanish, Portuguese, Korean and Hindi, not just the newest ones. Pick a language from the globe in the menu and the whole archive switches with you, so you can catch up on months of releases in your own language.
- Pricing comparisons now recognize prices written with spaces while checking each plan against its archived page. The quarterly market chart stays hidden until we can compare at least five vendors, so a few vendors' decisions don't look like a market trend.
- New feature You can now see how much detail the tools we track put in their release notes, quarter by quarter. Choose a tool to compare it with the tracked group, then open its source notes to see what the vendor actually wrote. Blank quarters mean we couldn't score enough dated notes.
- Nmap and Wireshark tool pages now include reviewed excerpts from project documentation, release notes and discussions beside the capabilities and releases they explain, with source links so you can check the evidence.
- The rest of the site now reads in your language too: tool pages, the FAQ, pricing, charts and the changelog, not just the menus and the newsletter. Pick a language from the globe and the page text switches with it. New pages and new features arrive translated, because every update translates whatever text is new before it goes live.
- Website history now leaves installer and download links out of vendor timelines, so the pages you browse focus on the vendor's actual website.
*
Oct 17, 2026
-
Defect fix
On a phone, the menu now always shows each page's name. Before, opening it from the tools table left you with a column of bare icons, so you had to guess where each one went.

-
Improvement
A tool's release history now opens one entry at a time instead of one long scroll, so you can find the change you care about fast. Filter by kind or by what changed in coverage, such as new integrations or detections, search it, and open the full timeline when you want everything at once. On a phone, filter rows that run off screen now fade and show an arrow, so you can tell there is more to the right.

- The keyboard shortcuts now work inside open windows: j and k, the arrow keys, gg and G scroll a tool window instead of the page behind it, and f labels its links so you can jump with a keypress. Press ⌘/ (Ctrl+/ on Windows and Linux) anywhere on the site, in vim, emacs or off, to open the feedback form.
- Two dozen tools that moved their release notes, docs, blog or product page now point at the new address, so their updates keep arriving and their tool pages link to the right place. This includes Sekoia, Microsoft Intune, Acronis, Action1, SailPoint and Sysmon for Linux.
*
Oct 16, 2026
-
Improvement
Screenshots and videos now share one rounded corner everywhere: in the newsletter, on tool pages, in the changelog, in articles and in the emails you get, instead of a slightly different edge on each page.

-
Improvement
Tool pages now label each place people discuss a tool by name, so a thread from GitHub issues, Stack Overflow or Hacker News reads as exactly that. Notes from a project's own sources also sit beside the feature or release they explain, instead of in a separate list.
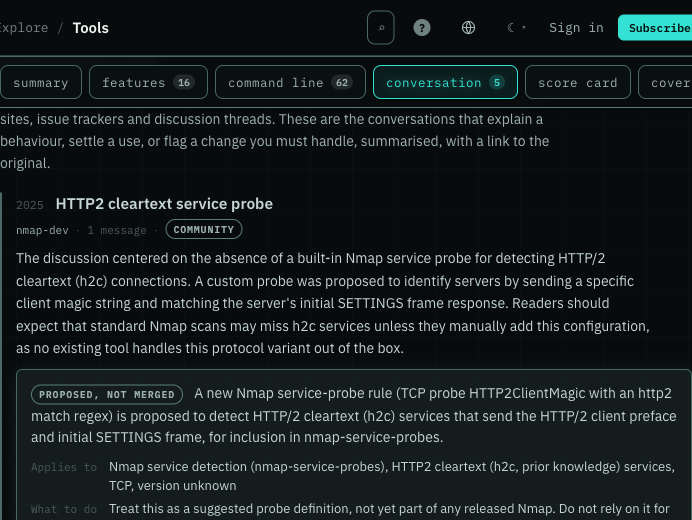
-
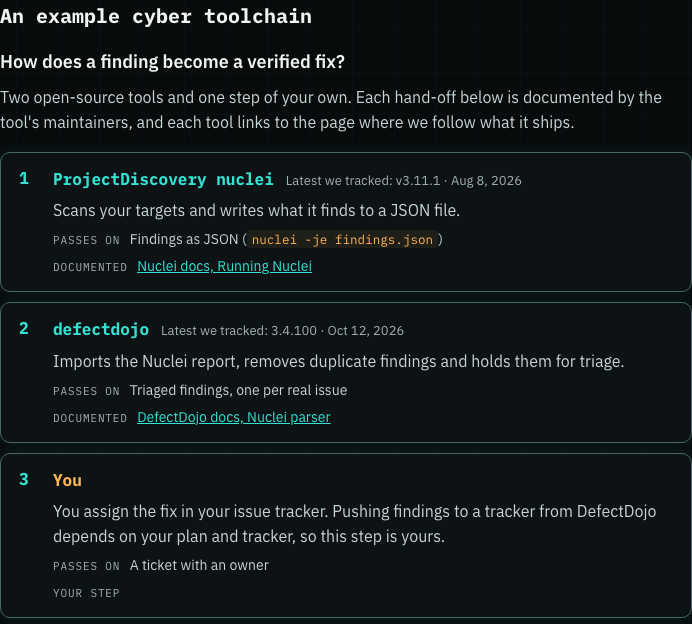
Wondering what we mean by "toolchain"? A new page, What is a cyber toolchain?, answers it: a toolchain is when the stack connects. Your stack is every tool that you deployed; your toolchain is the tools you run and how they connect. The page walks through a real example, a Nuclei finding that DefectDojo tracks until a rescan proves the fix, with each connection linked to the maintainers' docs, and you can add both tools to My Toolchain in one click. Every tool page links to it. The threat page's builder is now Build a toolchain, and AI assistants connected to our MCP server can ask for build_toolchain by name.
- Capability Search now tells you when its results were last updated, and a page you leave open picks up newer results on its own. The proof you open always matches the list you are reading, so a match never changes under you mid-search.
- Defect fix A release you already read about no longer shows up again in a later issue when the vendor rewords its headline, moves its page, or re-dates its feed. Before, a few releases a week came back as if they were new, so every item in an issue is now one you have not seen.
*
Oct 15, 2026
-
Integration Search now ranks exact product names first, keeps conflicting sources explicit, and shows only reviewed historical evidence. Product and vendor charts count distinct documented connections.
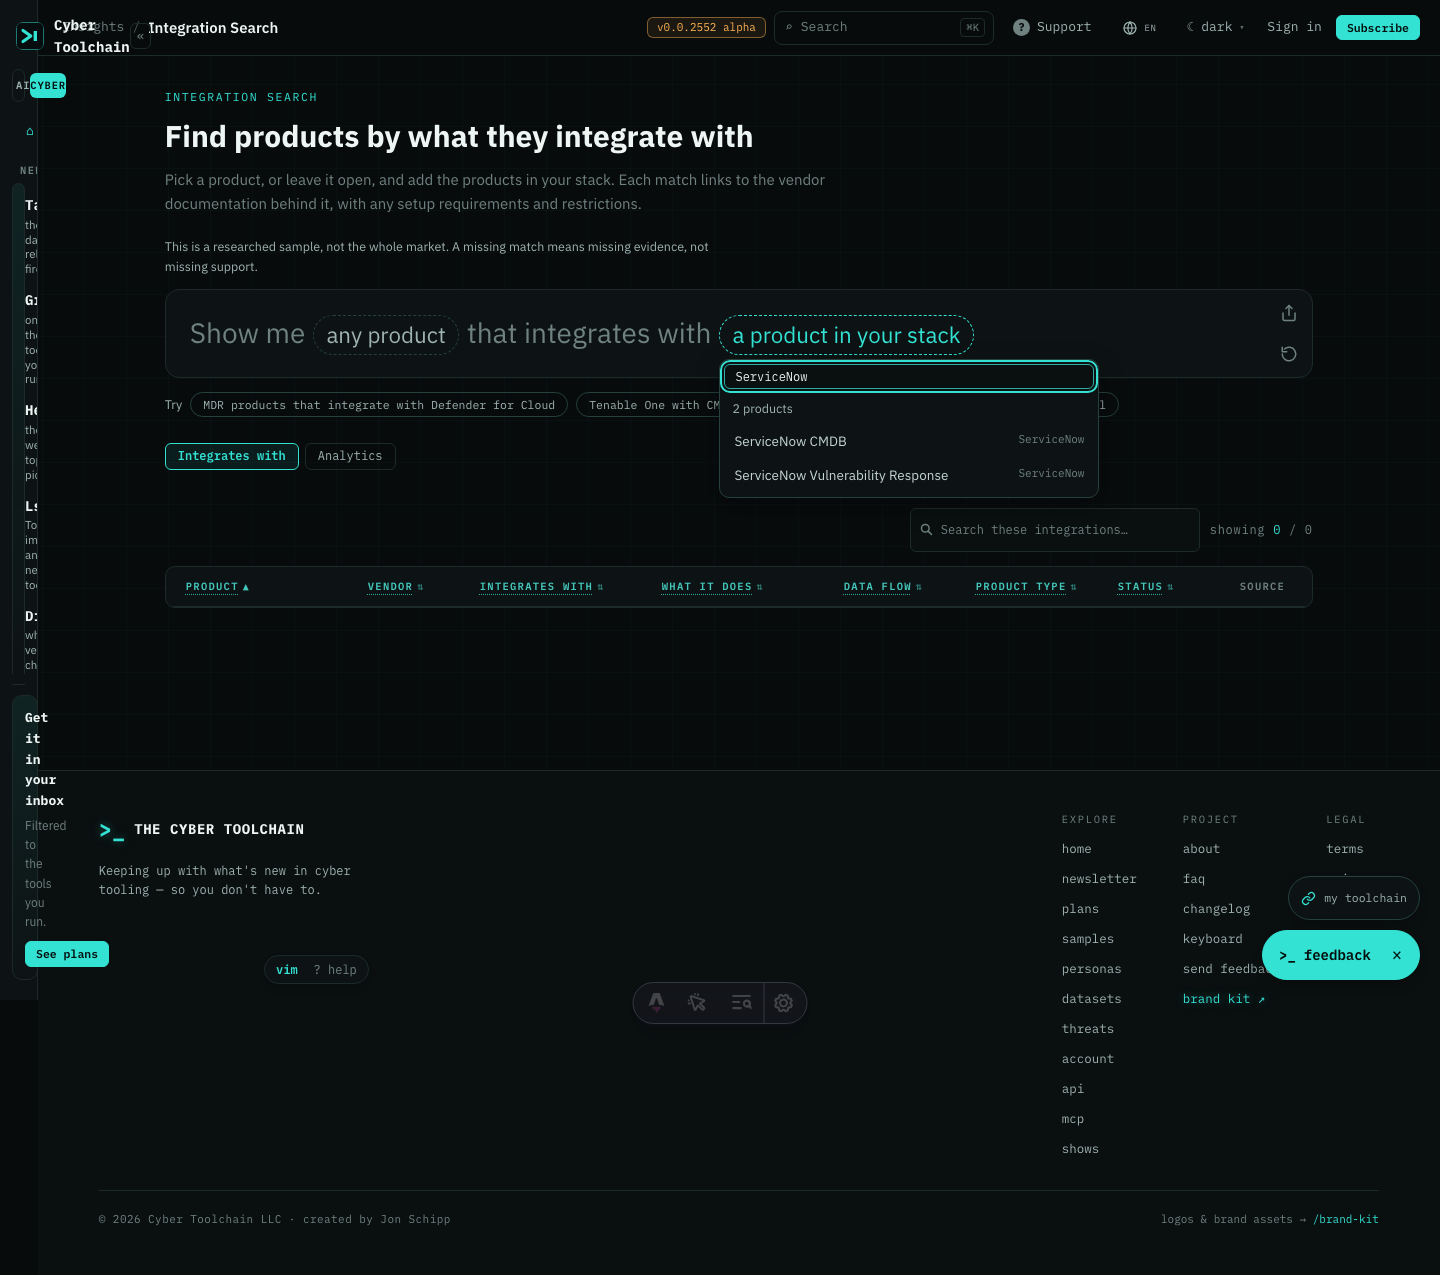
- Capability Search is now open to everyone. Ask for the capabilities you need, see every matching tool with the release note or docs page behind each match, and download the table, with no account.
- Capability Search now understands the short names you type. Search sso, mfa, api, sbom or saml, or describe what you need in plain words, and get the tools that offer it with the release note or docs page behind each match.
- Improvement A tool's release history now covers about 1,080 older releases that used to appear with no explanation. Each one now says what it added, so you can follow a tool's features further back instead of hitting a gap.
*
Oct 14, 2026
-
Improvement
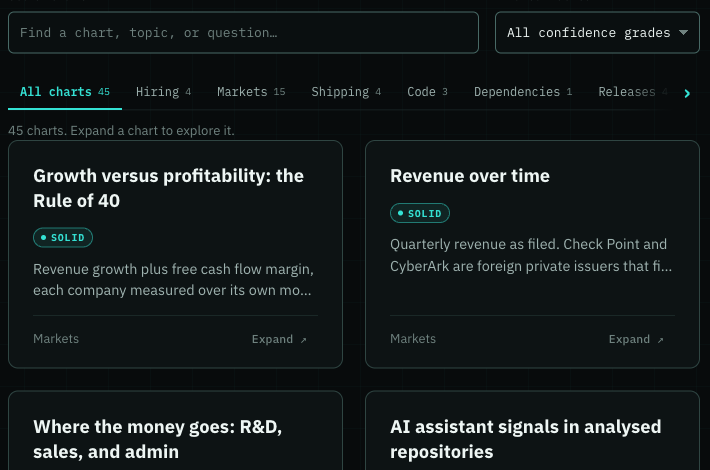
Analytics now lists the charts you can lean on hardest first: every chart graded Solid leads, with the ones still being fixed after them, so the first page you open is the most trustworthy one.
-
Improvement
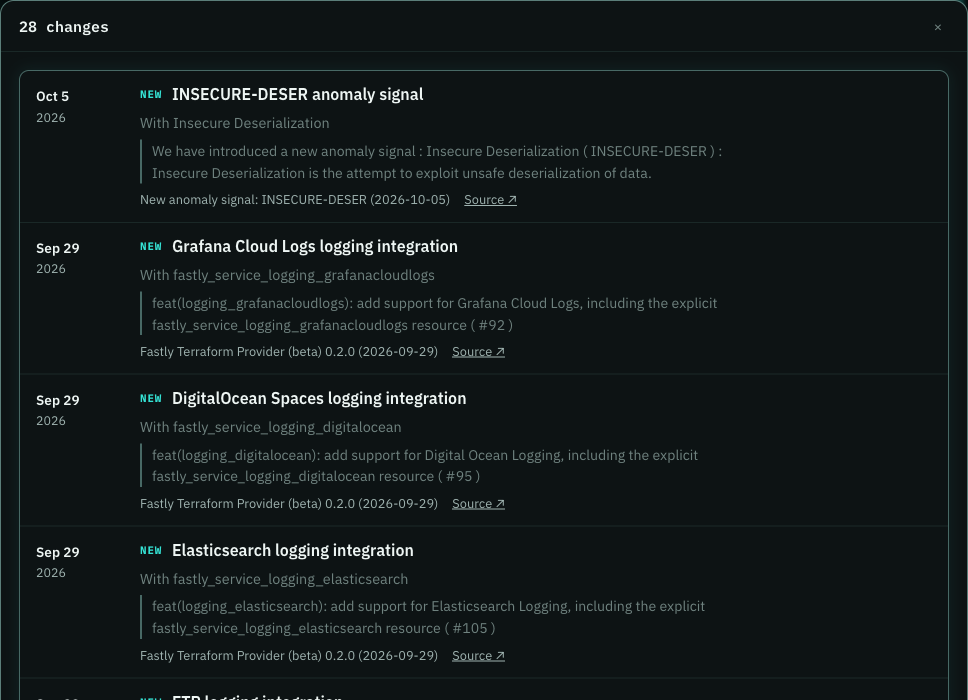
Show all in a tool's Coverage section now opens the full list in its own scrollable window, so the page stays short and closing the window takes you back. Filter that list to new, updated or retired changes to see only the kind you care about. The names a change adds are also set apart from its title, so each change reads at a glance.
-
Defect fix
In dark mode you can now see where every card, chart and table starts and ends. Their edges were nearly invisible on the dark background, so panels ran together. They now draw as clearly as in the light themes, with a faint glow. Where a page repeats many cards, like the Analytics chart grid, their edges step back so the search and filters above them stand out, and the sidebar and top bar edges are quieter too. On Analytics, the chart categories are now one quiet row instead of a wall of outlined buttons, and you can press Enter on a selected chart to expand it, and Esc to close it again.
-
Improvement
When a search or filter leaves a table with nothing to show, you now see a clear band where the rows would be, saying there are no matches and how to get rows back. It looks and reads the same on every table, so an empty result never looks like a page that failed to load.

-
Integration Search now reads like Capability Search. Write your question as one sentence, pick the products in your stack, and get every documented integration in a table you can filter, sort and open for its evidence. The Charts tab shows which products and vendors integrate most, so you can see who connects to your stack before you call a vendor.
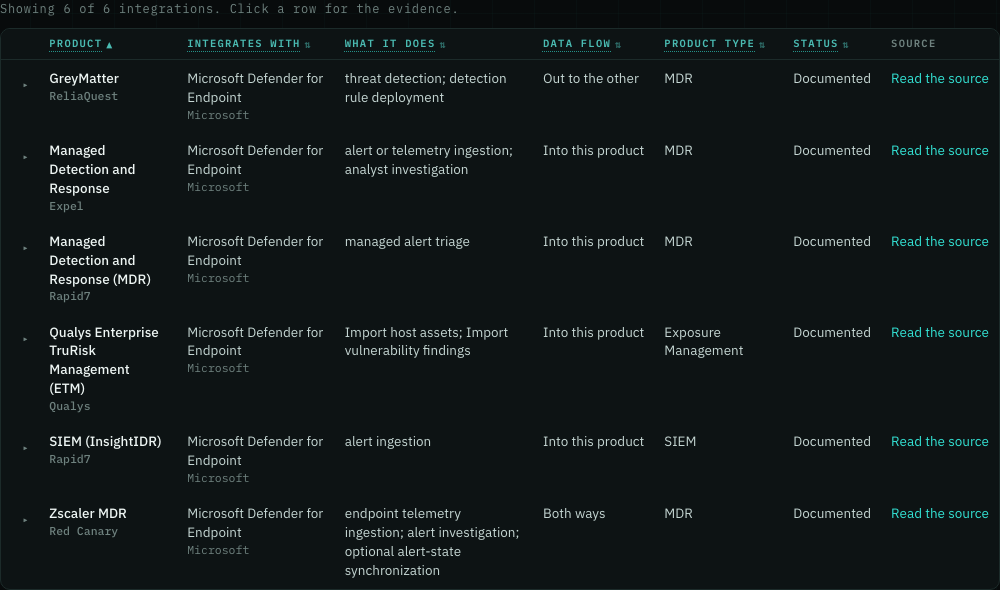
-
Improvement
When no published detection rule names a threat yet, the threats page now tells you so in plain words, along with how many open rule sets it checks and how often. It also moves the scans and checks you can use today to the top, followed by the broader rules for the same attack technique. Before, an uncovered threat opened on an empty rules heading, so you could not tell a real gap from a page that had not loaded.

- Defect fix Analytics confidence grades are rechecked against retained source evidence, and scheduled analytics refreshes grade their charts again instead of stopping early. Daily hiring updates now keep building available charts when one provider fails, while preserving explicit gaps for unavailable sources.
- Defect fix The threats page now counts every public detection rule it shows. The headline and each threat's Detect figure only counted rule sets from products we track, so a known-exploited CVE with a Proofpoint ET Open or Elastic rule under it still read as having no detection. Those rules count now: 109 of the last year's 305 known-exploited CVEs have a published detection rule, up from the 27 the page said. ET Open rules also date the time to first defense now, from the day each rule was written, so 156 of those CVEs show when a defense first landed instead of 137.
*
Oct 13, 2026
-
Improvement
Analytics is easier to scan: charts now show two to a row at nearly twice the size, with categories in one row across the top, so the chart itself is the first thing you read. Measurement notes and caveats are still one click away in the expanded view, and each card keeps its confidence grade.
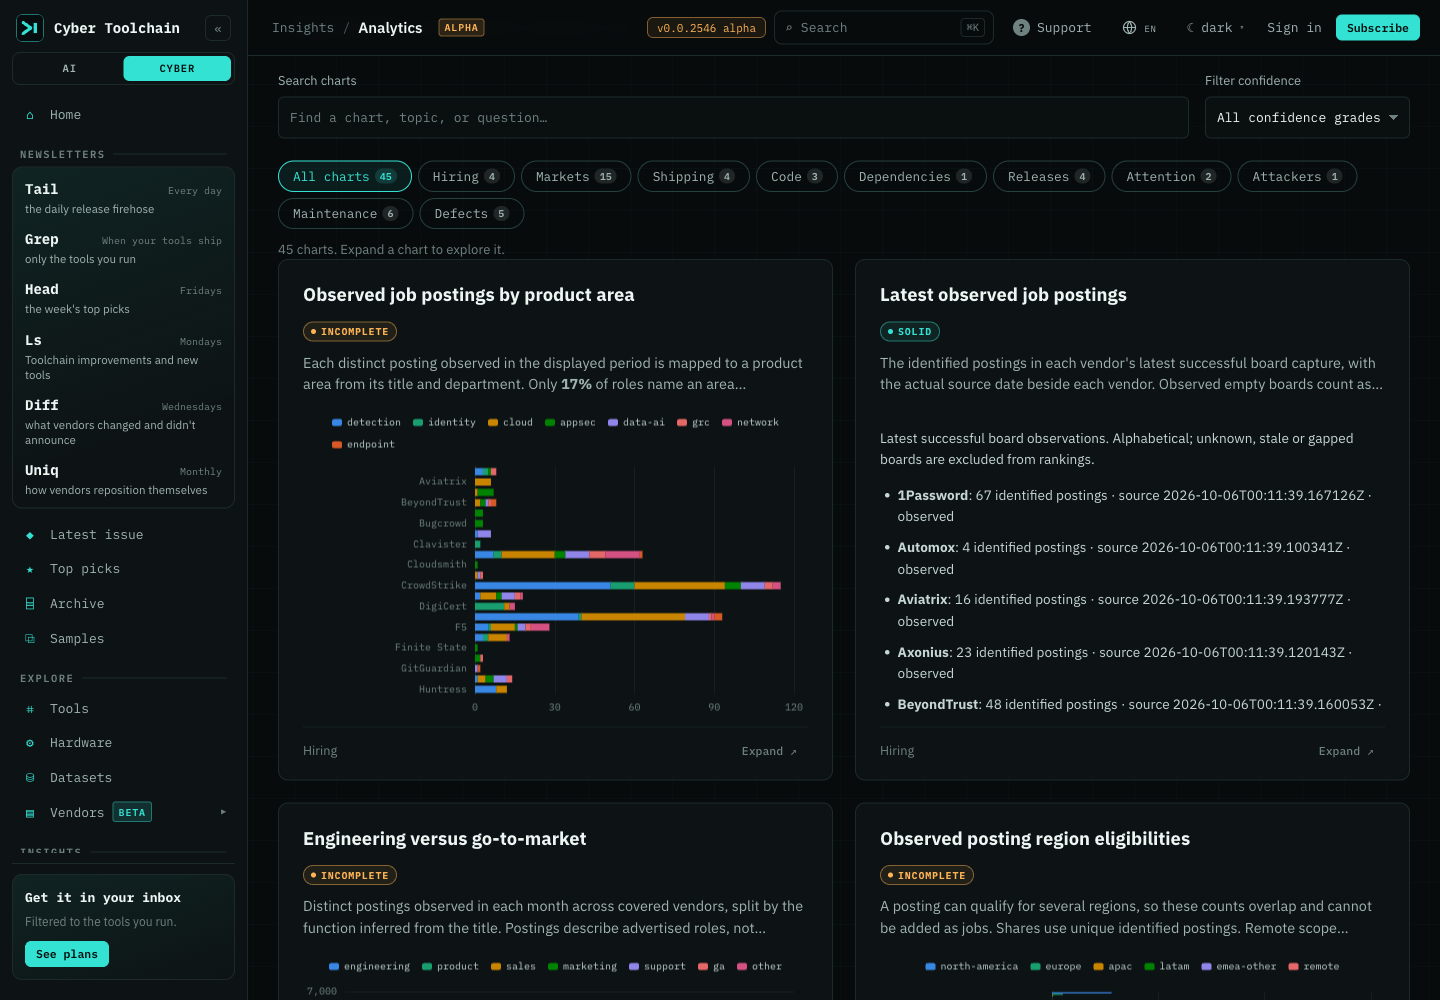
-
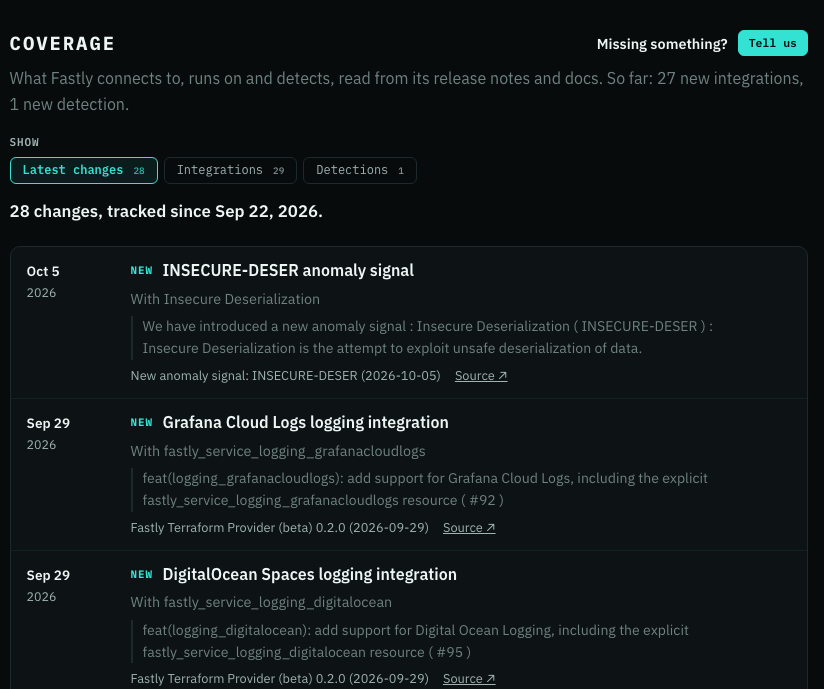
Improvement
A tool's Coverage section now opens on its latest changes, so you see what it started or stopped working with without scrolling. Switch to Integrations or Platform support for the full directory, grouped by kind of product.
-
Improvement
Each tool's Coverage section is now a directory you can scan: what it integrates with is grouped by kind of product, with the date each was first seen and last mentioned, so you can tell at a glance whether it works with your stack. Click any one to see what it is and every release note that names it, each dated and linked to the original, plus a link to its own page when we track it. Missing one? The Tell us button sits right at the top.
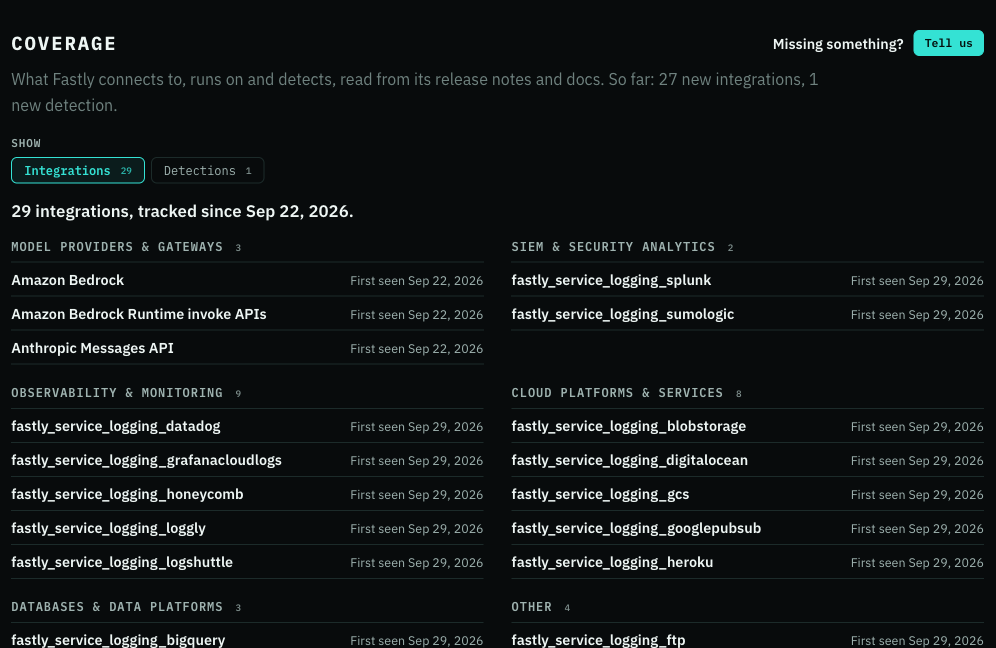
-
New feature
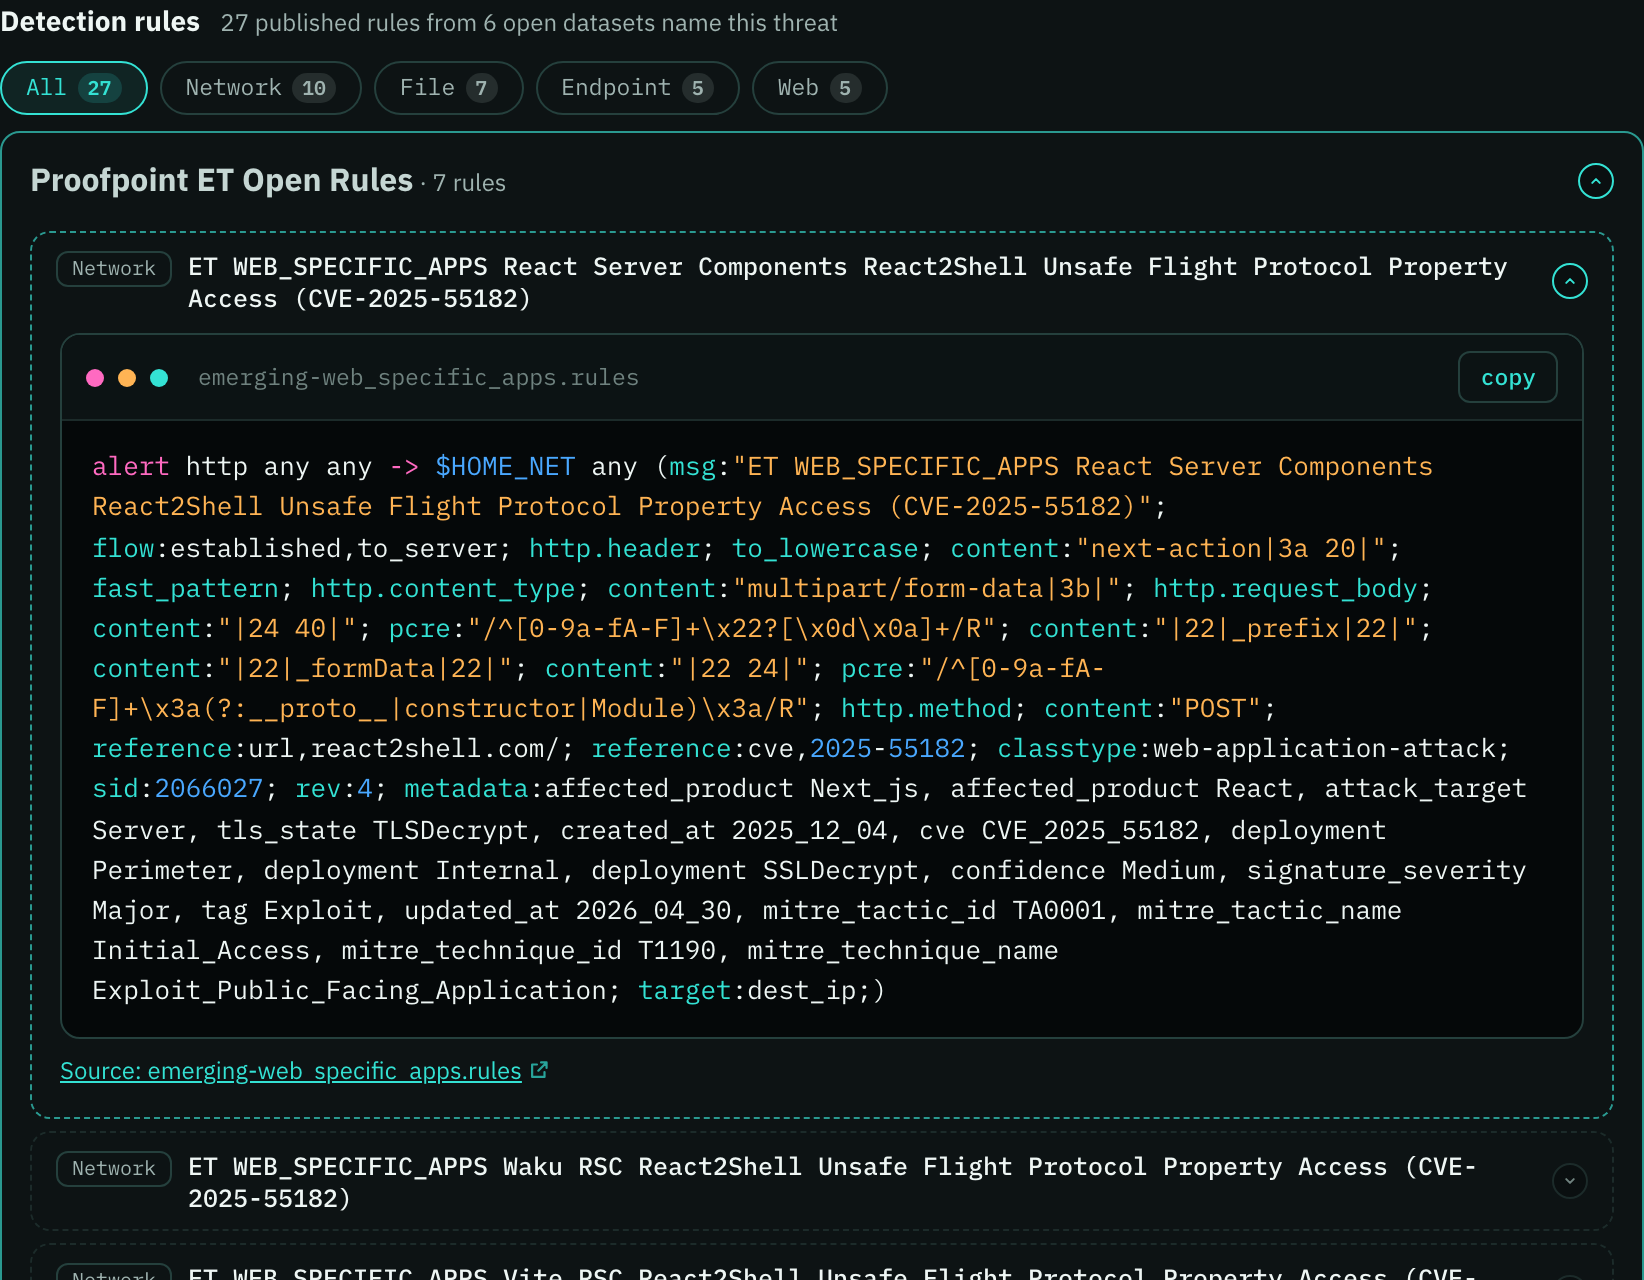
Every threat on the threats page now shows the detection rules that name it, free to read. Each rule appears in full, coloured for its format (Suricata, Sigma, YARA, Elastic and more), with a copy button and a link to its source, labelled with what it watches: network, endpoint, web, cloud, identity or file. Before, you only saw whether a rule existed. Now you can copy one into your own sensor and filter to the kinds you run.
- Defect fix A delayed daily schedule now keeps the day’s existing Tail and Grep edition instead of creating another one.
- Defect fix Cyber tool documentation updates remain available for a later newsletter when summary generation fails.
- Integration Search now lets you explore documented product integrations, compare products against a selected stack, inspect source coverage and restrictions, and download the evidence. Comparisons describe the disclosed research sample. Current-fit checks keep unknown support separate, and local review packets make it easier to report a wrong or missing relationship. Find it directly below Capability Search in the navigation. A question-first page shows one view at a time, with plain answers, product cards and visible setup restrictions. Comparisons keep their vendor and per-target scope when shared or downloaded, and searches bring the answer into view.
- Improvement Daily Tail and Grep now arrive at a steady time each morning, and a late edition tells you it's late when you open it.
- Defect fix Glossary definitions in newsletter themes now open fully opaque and on top of the text below them, and long table headings wrap instead of running into the next column.
- Defect fix On your toolchain now lists only the tools you follow that shipped in that issue. Before, it could name a tool with nothing in the issue, and its link went nowhere.
*
Oct 12, 2026
-
Improvement
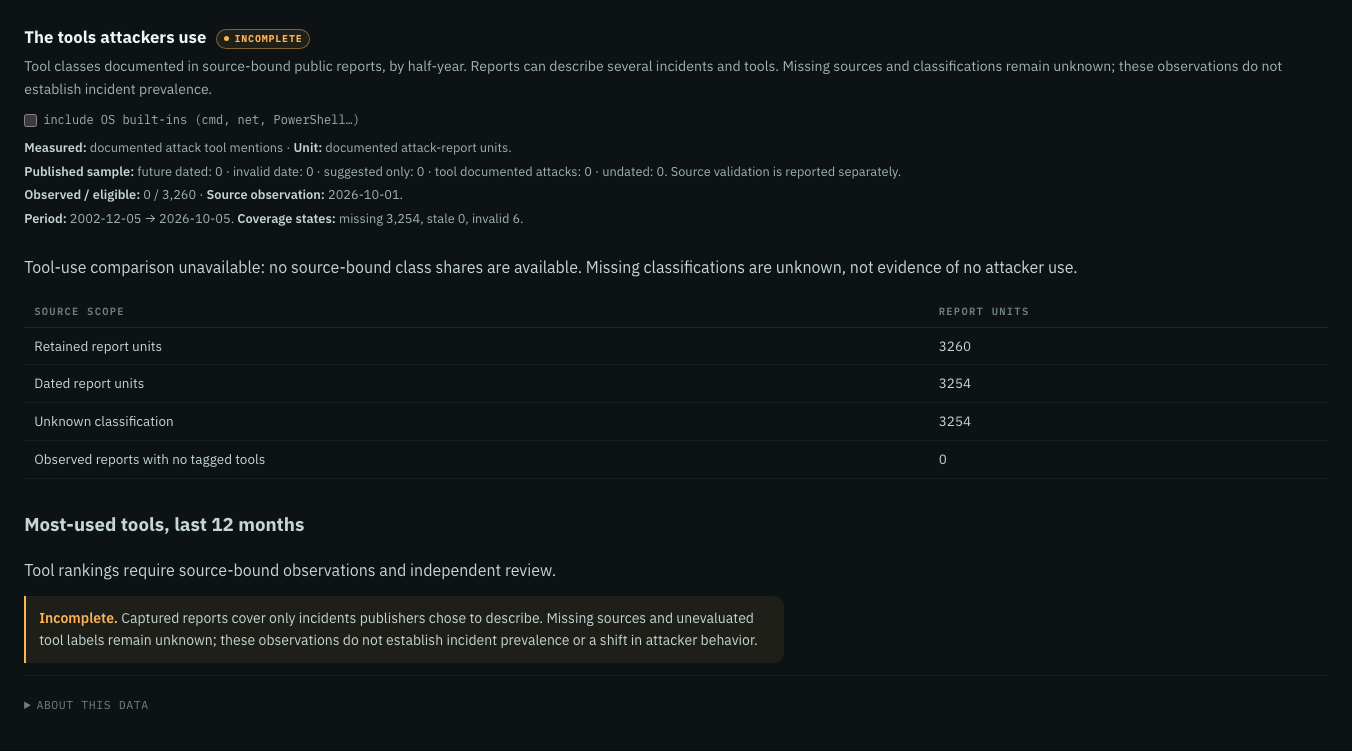
Analytics now checks release and status charts against retained sources for this tool cohort. Missing observation windows stay explicit, so gaps do not become zeroes or uptime comparisons. Hiring snapshots are scheduled daily; the monthly tool census preserves dated history and requires a fresh capture for its newest completed month. Unverified census counts stay blank; partial observations remain in the diagnostic ledger.
-
Improvement
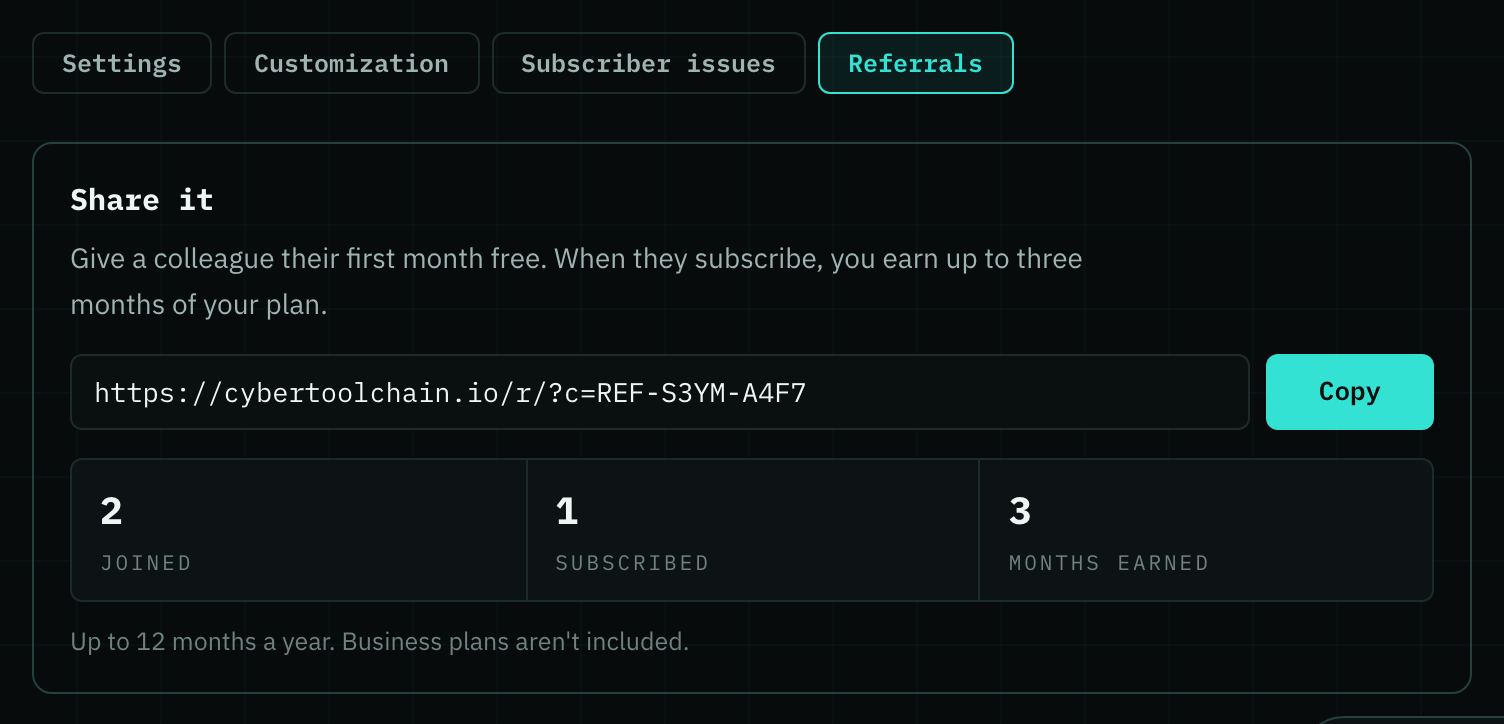
Your share link now has its own Referrals tab on your account page, so it no longer sits between your plan and your settings on every visit. Open the tab whenever you want to copy your link or see how many colleagues have joined, subscribed and earned you free months.
-
Defect fix
Tool pages now open with a description that tells you what the tool does. When the one-line blurb we had for a tool failed our quality check, the page used it anyway, so some pages opened with repository boilerplate instead of a description. Each page now opens with the same description its row in the tools table shows.
- Defect fix On Windows and Linux, Ctrl-N, Ctrl-P, Ctrl-J and Ctrl-G now stay with your browser everywhere on the site, so a new window, print, downloads and find-next work the same here as on any other page. The Mac keeps Ctrl-N and Ctrl-P as line keys in a filter box, where that is what they already mean.
- Defect fix Deleting your account now removes it from both Cyber Toolchain and AI Toolchain unless you choose one site, so you stop getting mail from either. If you leave one site, the other now sends only the newsletters you turned on there, never ones you never asked for.
*
Oct 11, 2026
-
New feature
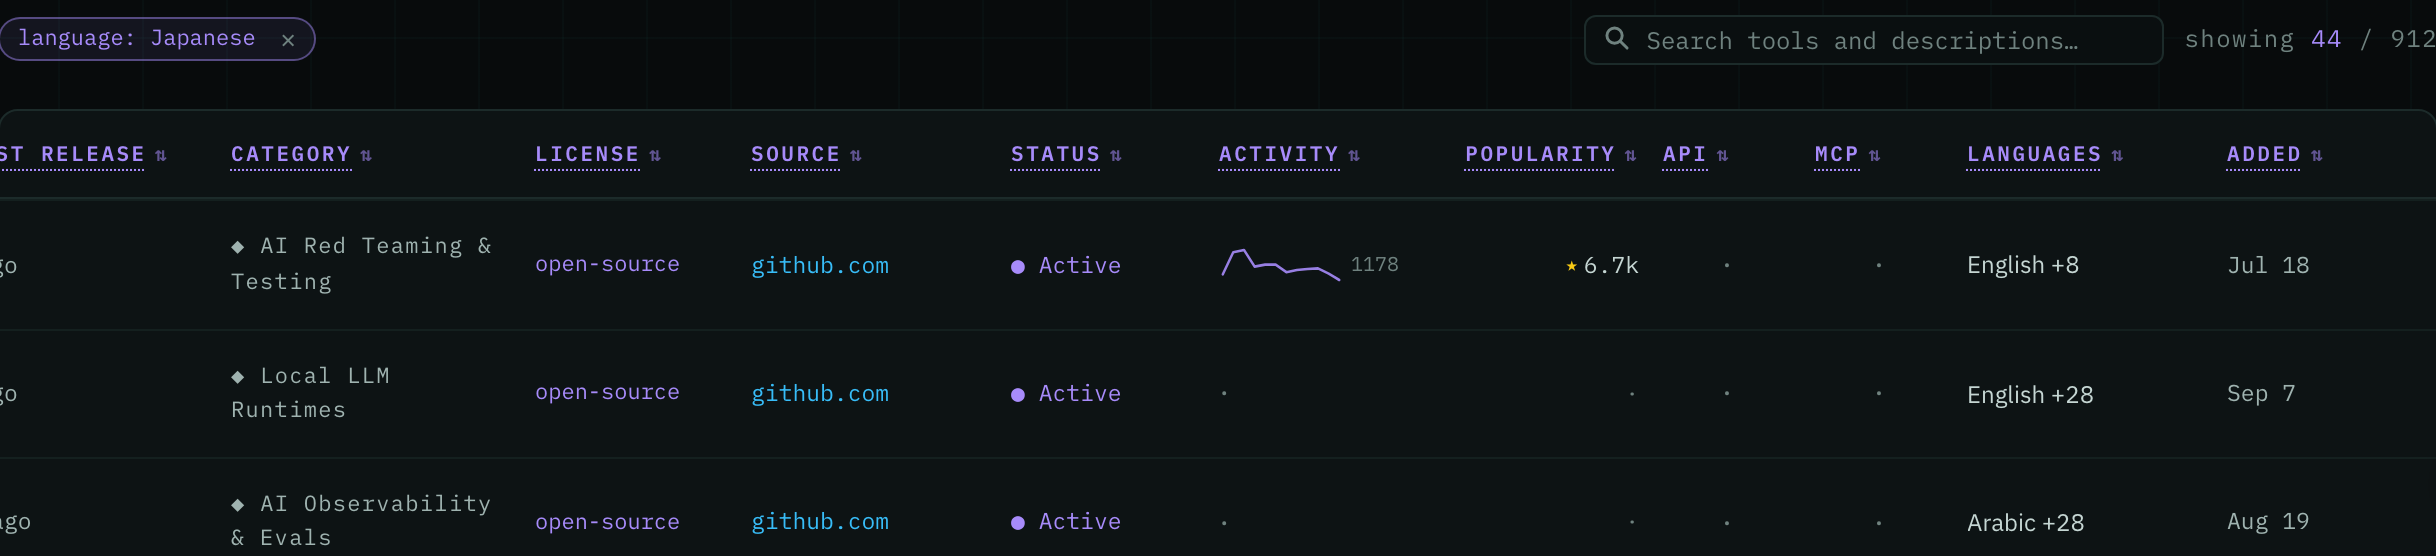
You can now see which human languages a tool is offered in before you roll it out to a team abroad. The Tools table has a LANGUAGES column you can filter, so picking Japanese shows only the tools with a Japanese interface or documentation. Open a tool to see where each language came from: its own translation files, its documentation, or the release note that announced it.
- New feature Every card and every issue now has a Feedback button. Tell us something here is wrong or something is missing, and it goes straight into the queue we use to correct the dataset. You do not need an account; a short line on what is off is all we ask.
- Defect fix Opening a tool in the expand-in-place view now keeps Briefed's trim, so you see the few changes that matter instead of every feature the tool shipped that day.
- Improvement When you ask for a tool’s release history through MCP, a change covered in more than one newsletter now appears once, leaving room for more distinct changes in your results.
- Defect fix Share-card downloads now recover from stalled or failed image-library loads, so you can retry without reloading the newsletter.
- Defect fix Uniq's September issue now includes the vendor checks it was missing. We re-ran the month, so the issue page shows what each tracked vendor did instead of a notice that the checks didn't finish. In a busy month, the email shows the newest deals and links to the issue page for the rest.
*
Oct 10, 2026
-
Improvement
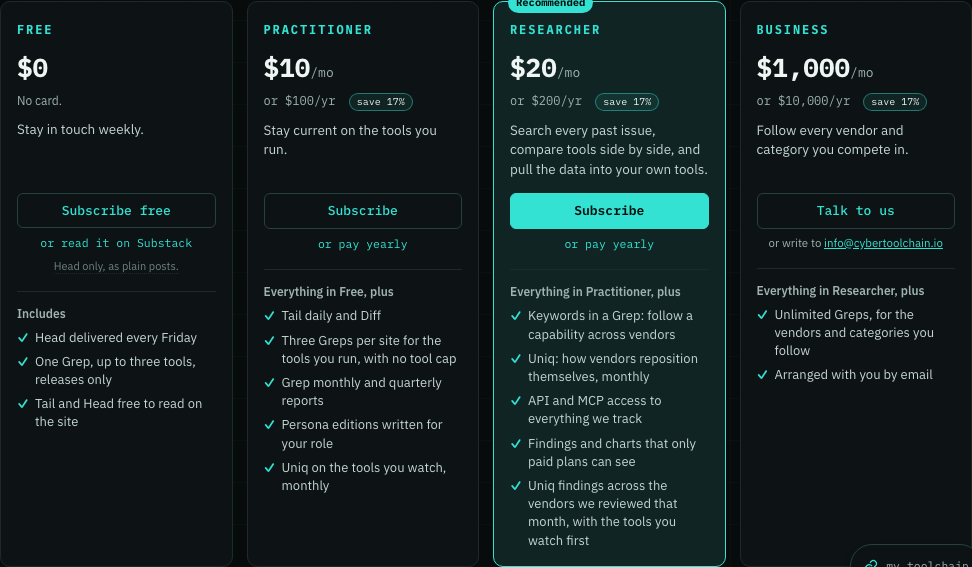
The plans page now fits on one screen. Each plan is a card with its price, its button and only what it adds over the plan before it, so you can see the difference and choose without scrolling. Researcher is the plan we recommend: it is the first with the market signals, peer rankings and the API. The full feature table is one click below, now about half as long: one row per product, with the difference between plans written in the cells, so you can check any one thing without wading through paragraphs.
-
New feature
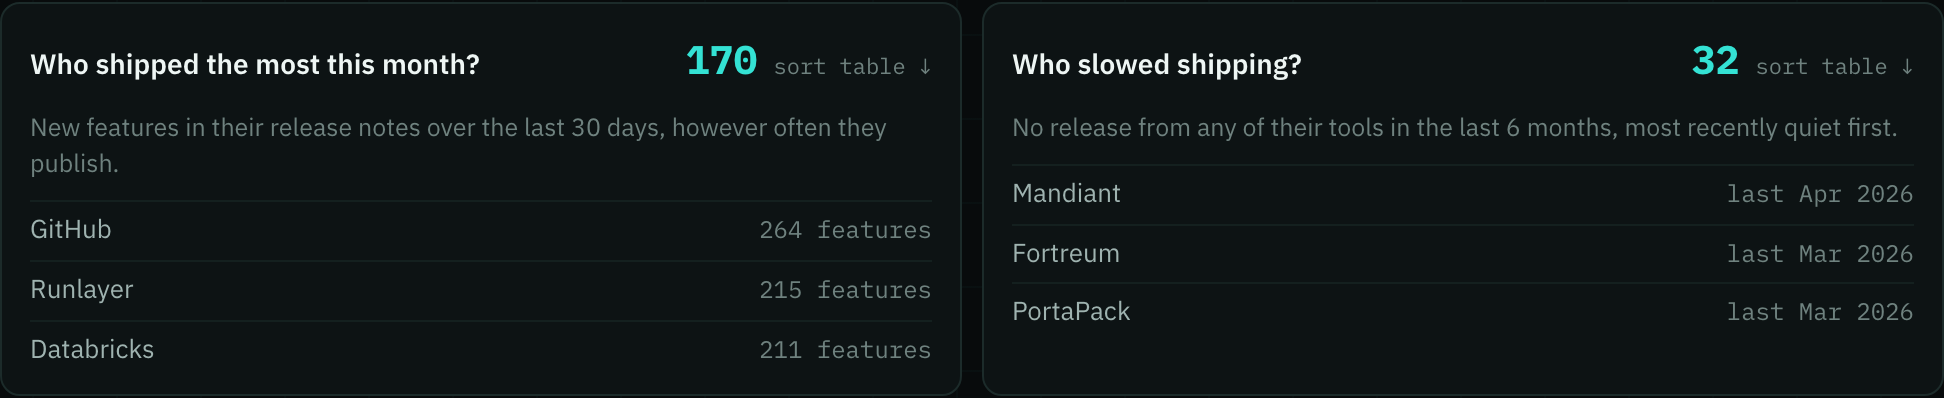
The vendors page now opens with question cards: who shipped the most this month, who slowed shipping and, as we find them, who changed pricing lately and who rebranded. Each shows its top three; click a card to sort the whole table by that question, or click a vendor to open its profile at the part that answers it, so you get from "who's moving?" to the evidence in one click.
- Defect fix The activity chart on this page now spans only the months the site has been live, so you can read each week's shipping pace instead of a single spike squeezed against the right edge.
- New feature Each new Diff issue now opens with the week's numbers, on the site and in your inbox: what share of the documentation and API changes we found were not announced in any release note, changelog or launch we track, how many made the issue, and how many of them the vendor's own notes call breaking. The FAQ explains exactly how we count it.
- Improvement Diff now leaves out anything the vendor already announced. A documentation change that only repeats a release, changelog or launch Tail covered for the same tool in the past month is dropped, and one that mixes the two keeps only the part nobody announced. Diff is shorter and holds just the changes vendors made quietly.
- Improvement Opening a newsletter issue now shows the newsletter's name, such as The Tail Newsletter, at the top of the page instead of repeating the site name that the sidebar already shows. You can tell which newsletter you are reading at a glance.
- Improvement Long releases now read short. When a release lists more than eight changes, related ones (a batch of new connectors, a set of new checks, several tweaks to one dashboard) are combined into a single bullet that still names every one, so you can take in the whole release at a glance instead of scrolling past twenty lines.
- Defect fix The Personas page now says plainly how much each edition sets aside. Before, it promised every edition was filtered to what that reader acts on, which overstated some of them: a Product Manager's edition keeps most of an issue, while others keep a small slice. Now you know what to expect before you pick one.
- New feature Compare score cards now shows a preview before you subscribe. Pick the tools you are weighing and you see their cards side by side, with the scores hidden, so you know exactly what a plan gives you before you start one.
- Defect fix Search now finds every tool we watch by name, including ones that have not shipped a release yet, so you can jump straight to any tool page from ⌘K.
- Improvement In vim and emacs keyboard modes, Space now ticks the selected row for Compare and `s` stars it, the same on every table with a Compare box, so you can build a comparison without reaching for the mouse.
- Defect fix A test send from your account page no longer opens with a late-delivery apology. You chose when it went out, so the preview now looks exactly like the issue you will receive.
*
Oct 8, 2026
- Defect fix History issues, the ones numbered below 1 that were rebuilt from release archives before the newsletter started, no longer show a PDF download button that led to an error page. Those issues were never sent, so there was never a PDF to download. Every issue that went out by email still has its PDF.
- Improvement The tools table has ten new categories, so a filter returns the kind of product you asked for. Device management tools such as Intune, Jamf and NinjaOne now sit under Endpoint Management (UEM/RMM) instead of Patch Management. Software Supply Chain Security collects SBOM, signing, malicious-package and ASPM tools such as Socket, cosign, Apiiro and Cycode. WAF, Bot & API Protection separates runtime defenses like Wallarm and DataDome from the web scanners. Security Validation holds breach and attack simulation and automated pentesting. Privileged Access Management and Non-Human & Agent Identity split out of identity, AI security now divides into runtime guardrails, red teaming and posture, and AI / LLM Gateways gets its own category.
- Improvement You can now follow the main vendors in three markets we covered thinly. Privileged access adds CyberArk, Delinea, StrongDM, Keeper and Britive. Security validation adds Picus, Cymulate, Pentera and AttackIQ. OT and ICS security adds Dragos, Nozomi Networks, Armis, Forescout, TXOne, Waterfall, Xage, Radiflow, Ordr, Asimily and Microsoft Defender for IoT, plus the open-source Malcolm, Conpot and CSET.
*
Oct 7, 2026
-
New feature
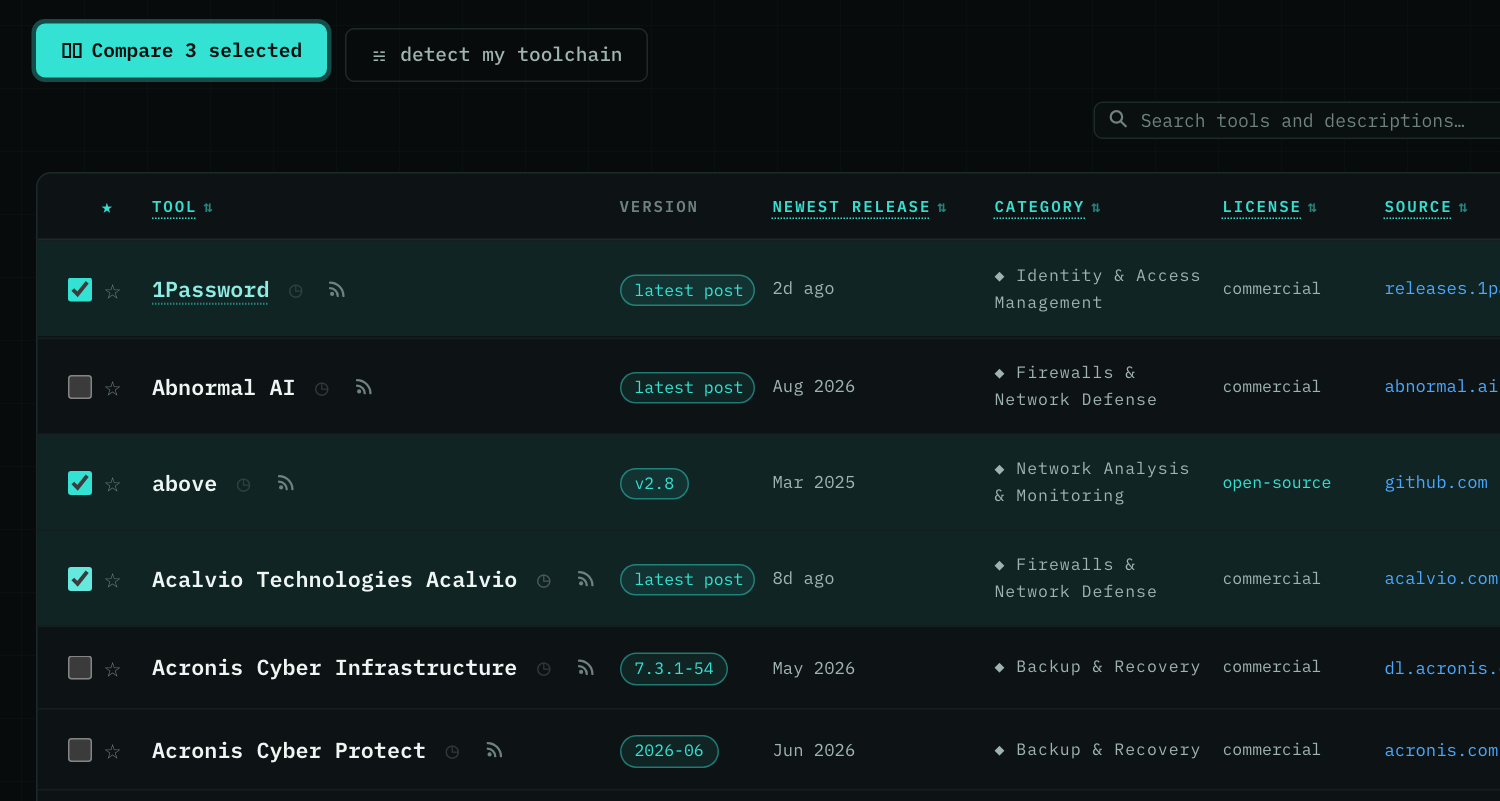
You can now compare tools straight from the tools table. Tick the box beside two to four tools and press Compare, and they open side by side in a window over the table. Ticks are separate from your stars, so you can weigh tools you don't run without adding them to My Toolchain.
-
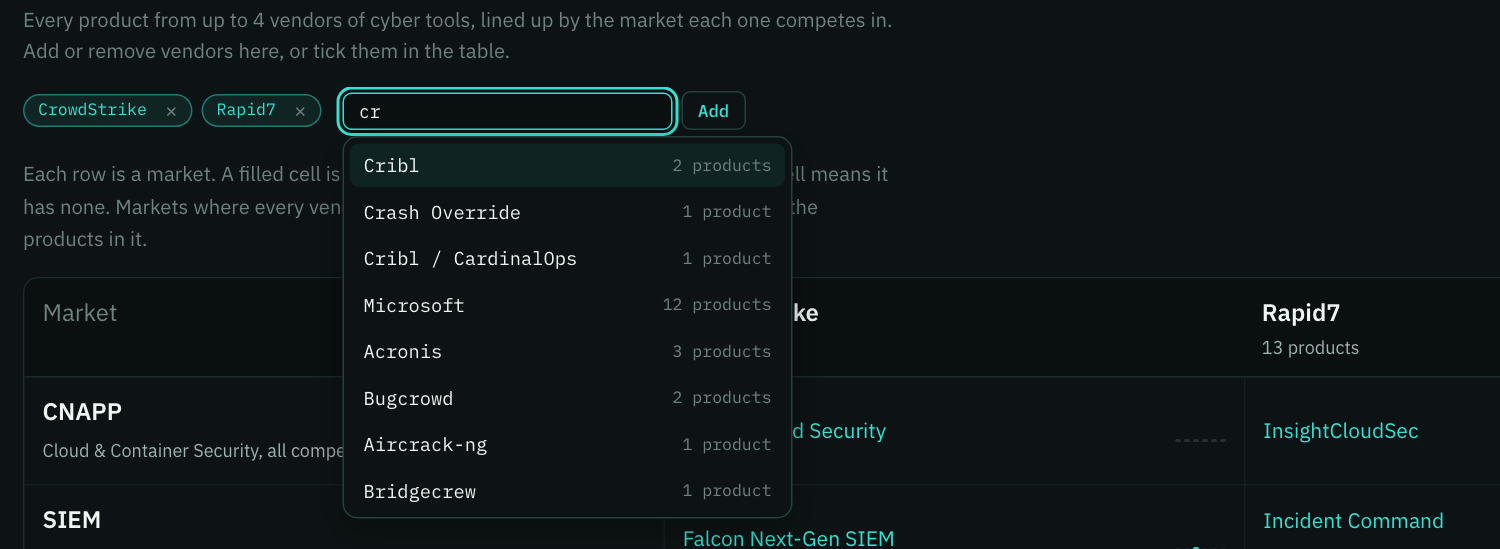
Improvement
Adding a vendor in the Compare vendors window now shows matching vendors as you type, with how many products each one has. Move through them with the arrow keys and press Enter, so adding the one you want takes a keystroke and the list looks the same in every browser.
-
Improvement
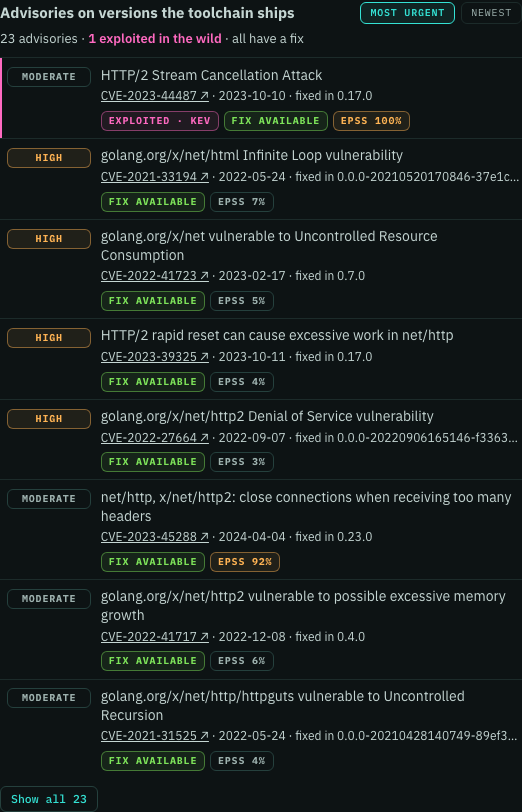
The supply chain page now opens by saying what it is for, and each library's vulnerability list is easier to scan. Sort it by Most urgent, with anything exploited in the wild first, then the most severe, then the ones with no fix yet, or by Newest to see the latest advisories first. Every advisory now carries a green Fix available or a red No fix label. The list shows every advisory, not just the top six, and some advisories that named the wrong fixed version now name the right one.
- Improvement A vendor's acquisitions chart now picks up new deals within a week of the buyer announcing them, so you see a company's latest purchases without waiting for a manual update. Deals that are announced but not yet closed are labelled as such.
- New feature Comparing vendors side by side is now part of every paid plan. On the vendors table you can still tick up to four vendors and press Compare; with a plan, their products open lined up by market and month by month, and without one the window shows what the comparison covers and a link to the plans.
- Improvement A vendor's website history now goes beyond its home and pricing pages. Every page in the vendor's main menu, and the pages its homepage links to, is now checked every week and filled in from the Wayback Machine, so you can see how a vendor's product pages changed, not just its front door. They appear under More pages on a tool's website history, by the menu's own names, as each vendor's history fills in over the coming weeks.
-
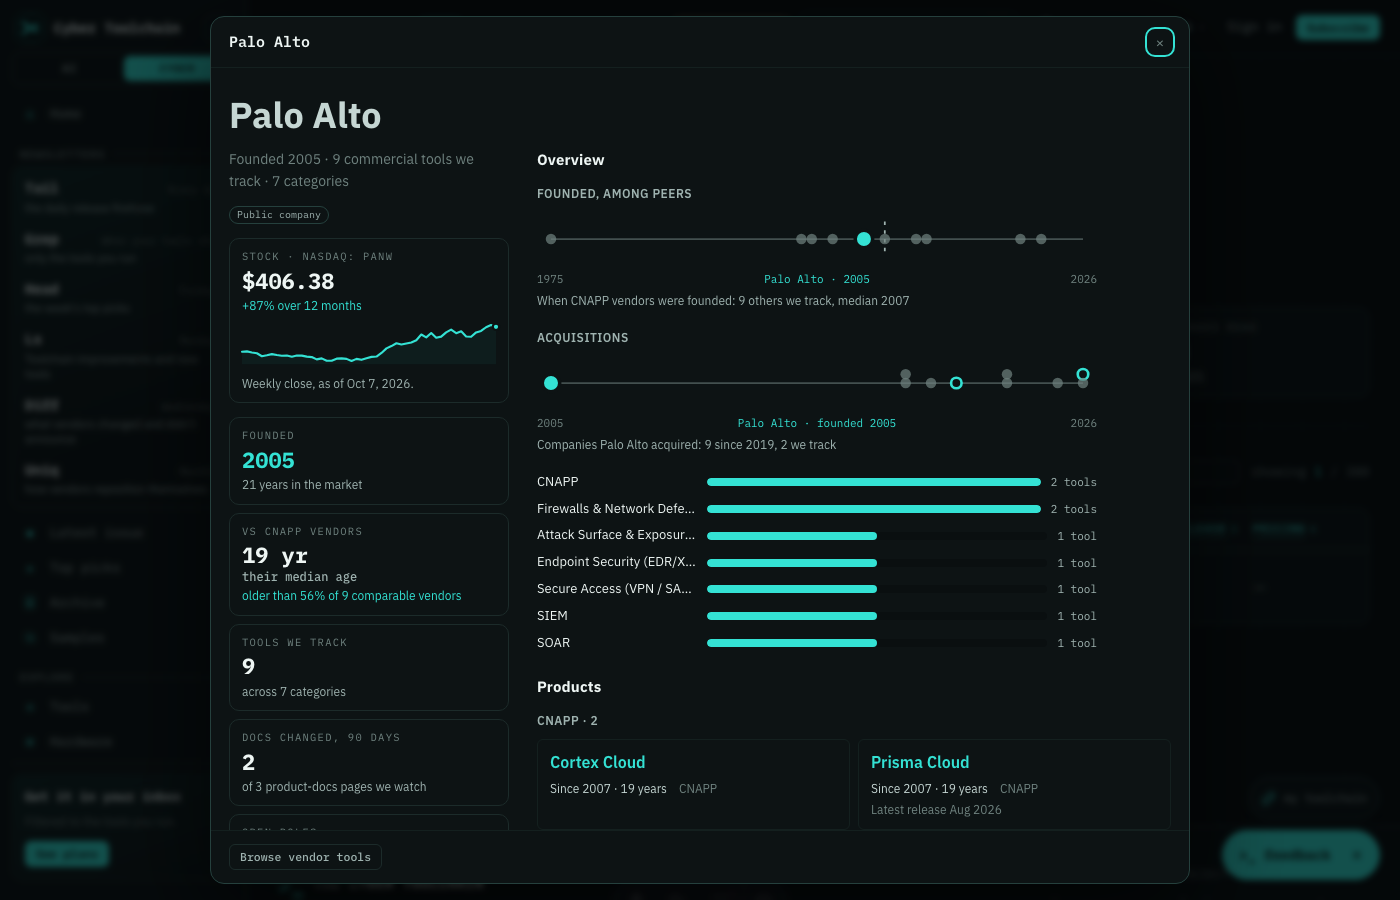
Each vendor's details now say who owns it: a public or private company, a non-profit, a government agency, an open-source project, or the company that bought it. A listed company shows its share price and a one-year chart, and a company owned by another shows its parent's, so Wiz shows Google's. Vendor details also show their curated founding year and revenue again; a build fault had been hiding them. A vendor that has bought other companies now charts those deals next to its founding year, and marks the ones we also track.
-
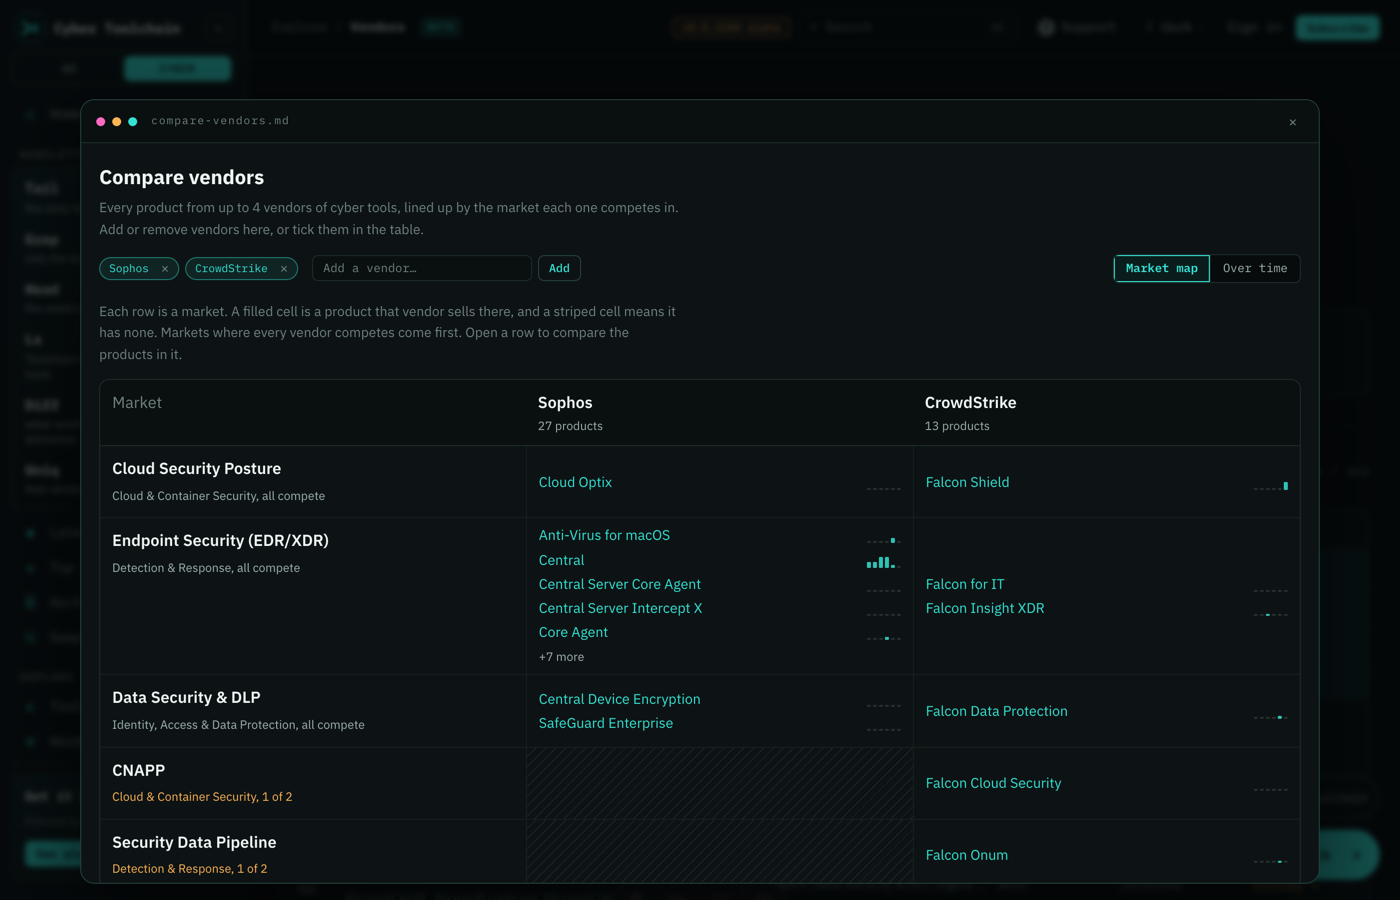
Comparing vendors no longer takes you off the vendors table. Tick up to four vendors and press Compare, and their products open side by side in a window over the table, so you can close it and pick different vendors without losing your place. The Compare button is now easier to spot too.
- Patch management now has its own category, with more than 30 patching tools to follow, among them Action1, Ivanti Neurons, Tanium, BigFix, ManageEngine, NinjaOne, Intune, Jamf and Rapid7 Active Patching. Automox moved there from Endpoint Security, so filtering for EDR no longer turns up a patching tool, and you can compare the whole patching market in one place.
- Email Security is now its own category on the tools table. Abnormal AI, Sublime Security, INKY, Material Security, Sophos Email Security and Rspamd used to sit under Firewalls & Network Defense, so filtering for firewalls showed you email products and email products were hard to find. Now the Email Security filter shows all of them in one place.
*
Oct 6, 2026
-
New feature
Read every issue in Japanese, German, Chinese, Spanish, Portuguese, Korean or Hindi: pick a language from the globe in the top bar, save it in Account to get your newsletter in it too, and we'll offer it once if your browser is already set that way. Tool names, versions and commands stay exactly as written.
-
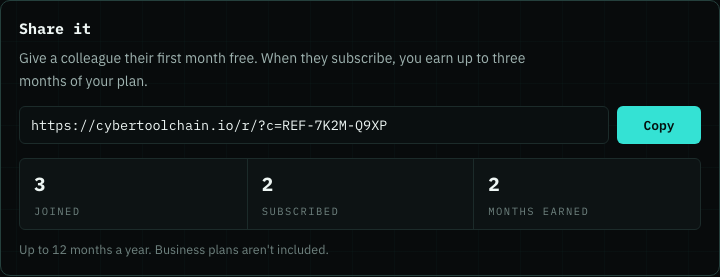
You can now give a colleague their first month free. Your account page has a Share it card with your own link, and each colleague who subscribes through it and pays earns you up to three months of your plan, free. It shows how many have joined and subscribed, never who. Business plans aren't included.
-
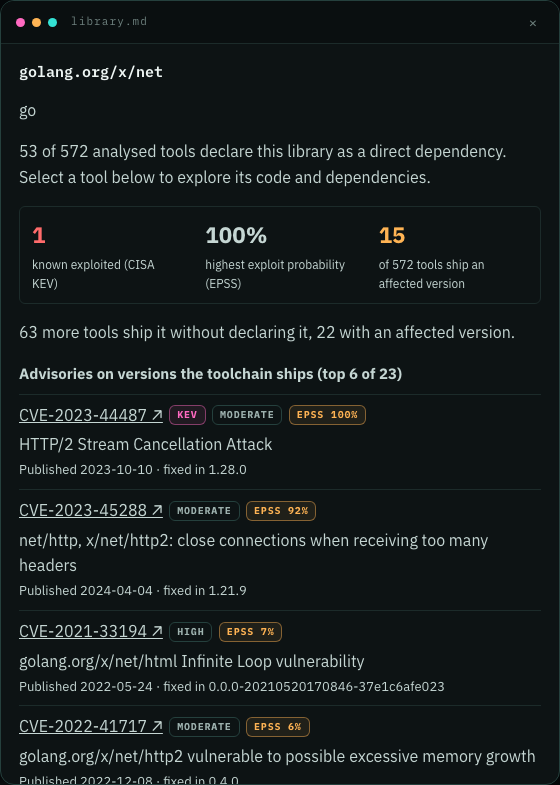
The Supply chain page now shows which shared libraries carry known vulnerabilities. Each library lists its advisories with a CISA known-exploited badge, the chance it will be exploited (EPSS), the version that fixes it, and which tools ship an affected version. A new Risk column and filter find the worst first.
-
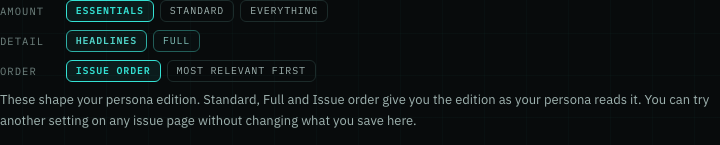
Your persona edition now comes in three sizes. On your account page, choose Essentials for the 10 tools that matter most to your role, Standard for your role's full edition, or Everything for the whole issue with your role's items reframed for you. You can also read Headlines only, one line per release, and put the releases that matter most to you at the top of each section. Your email and the issue pages both follow what you choose, so a busy week takes a minute to read and a quiet one shows you everything.
-
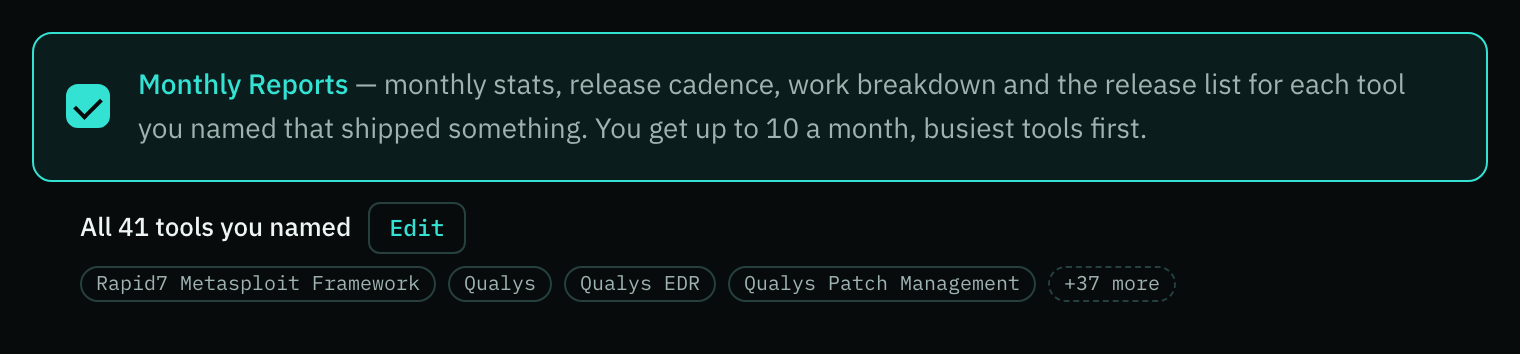
The Edit button beside Monthly Reports and Quarterly Reports on your account page now stands out in teal. It used to look like one more grey tool name in the list below it, so it was easy to miss that you can choose which tools get a report.
-
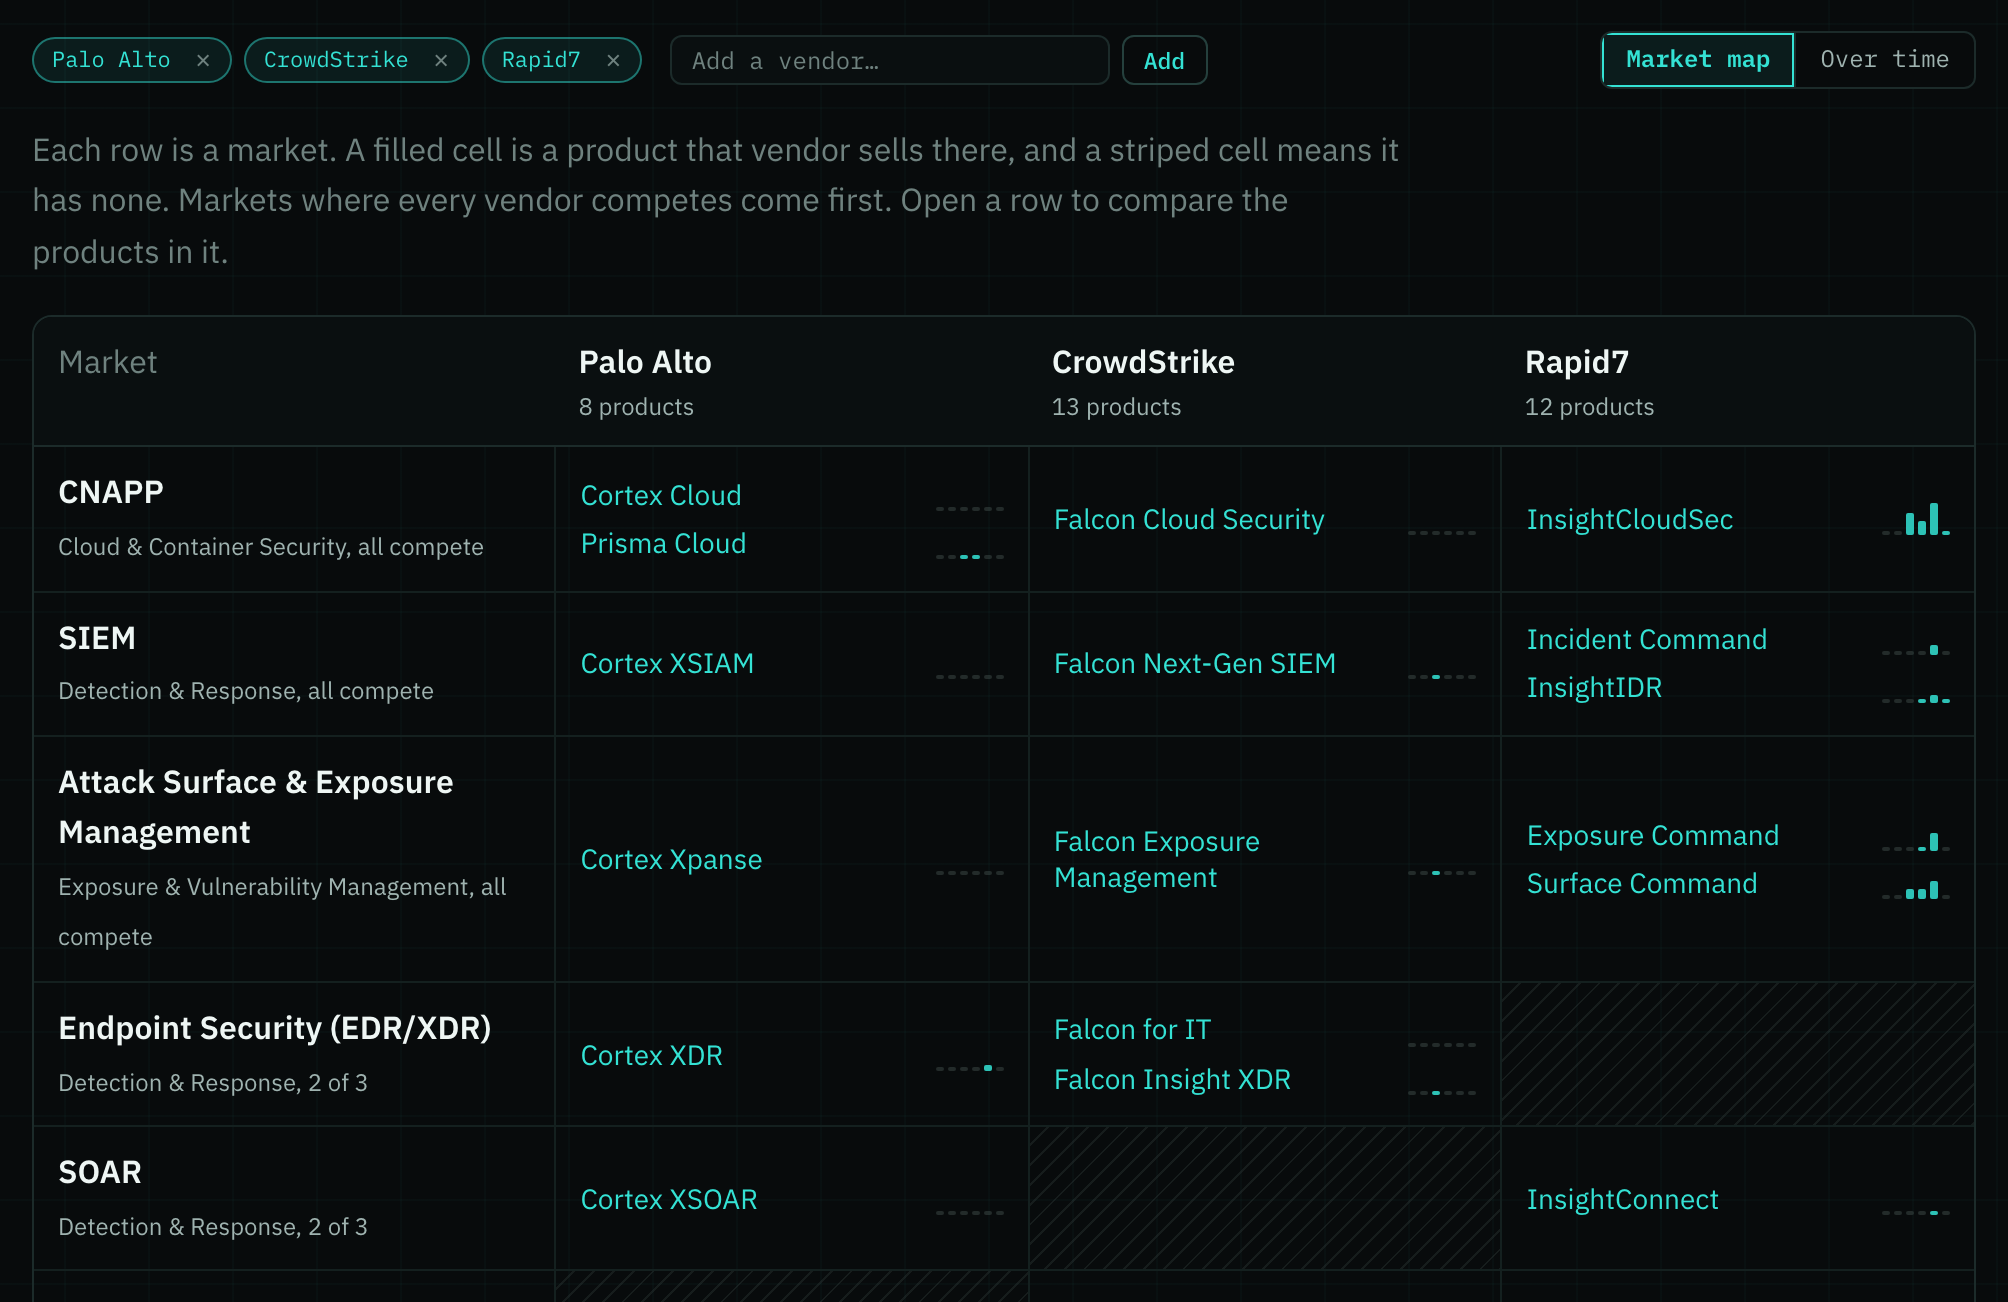
You can now compare every product from up to four vendors on one page. Tick vendors on the Vendors table and press Compare, and each market they sell into becomes a row. You see at a glance where Palo Alto, CrowdStrike and Rapid7 compete head to head and where only one of them has a product. Open a row to read those products side by side, or switch to Over time to see how often each one shipped, month by month.
-
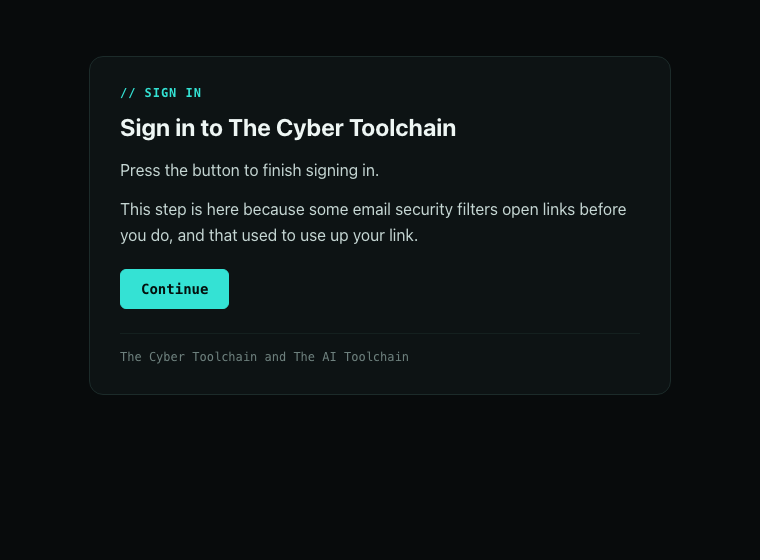
The page you land on from a sign-in link now looks like the rest of the site. It opens dark, or in the colour theme you picked on your account, instead of a plain page that followed your computer's light setting.
-
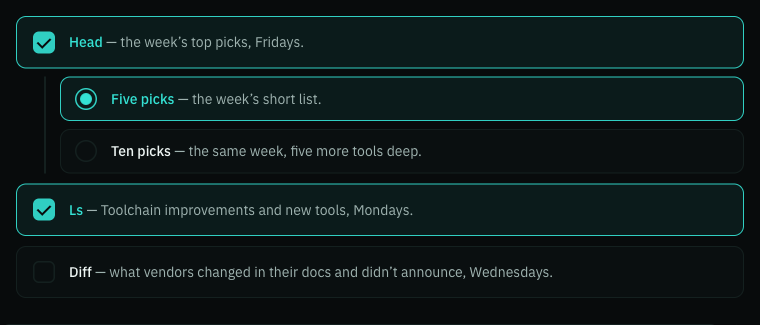
Every newsletter choice on your account page is now a card you can click anywhere, and the ones you've picked light up. At a glance you can see what you're getting, instead of hunting for a small tick box.
-
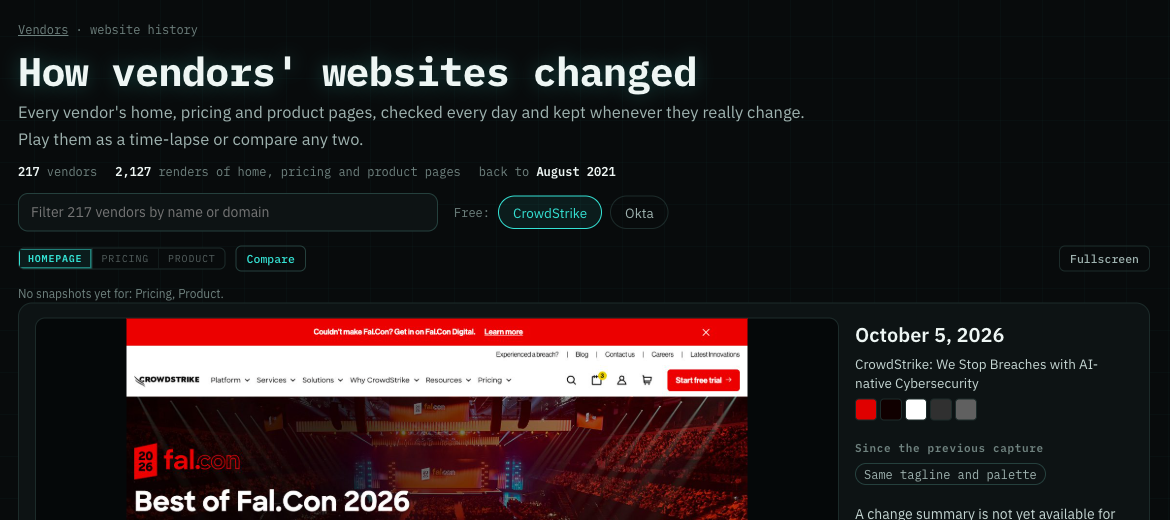
Website history now sits in the same centred column as the rest of the site, with the player and its month rail on one screen. Turn on Whole page to scroll a vendor’s full pricing or home page inside the player instead of seeing only the top. New captures are taken at twice the resolution, so pages stay sharp on high-density screens.
-
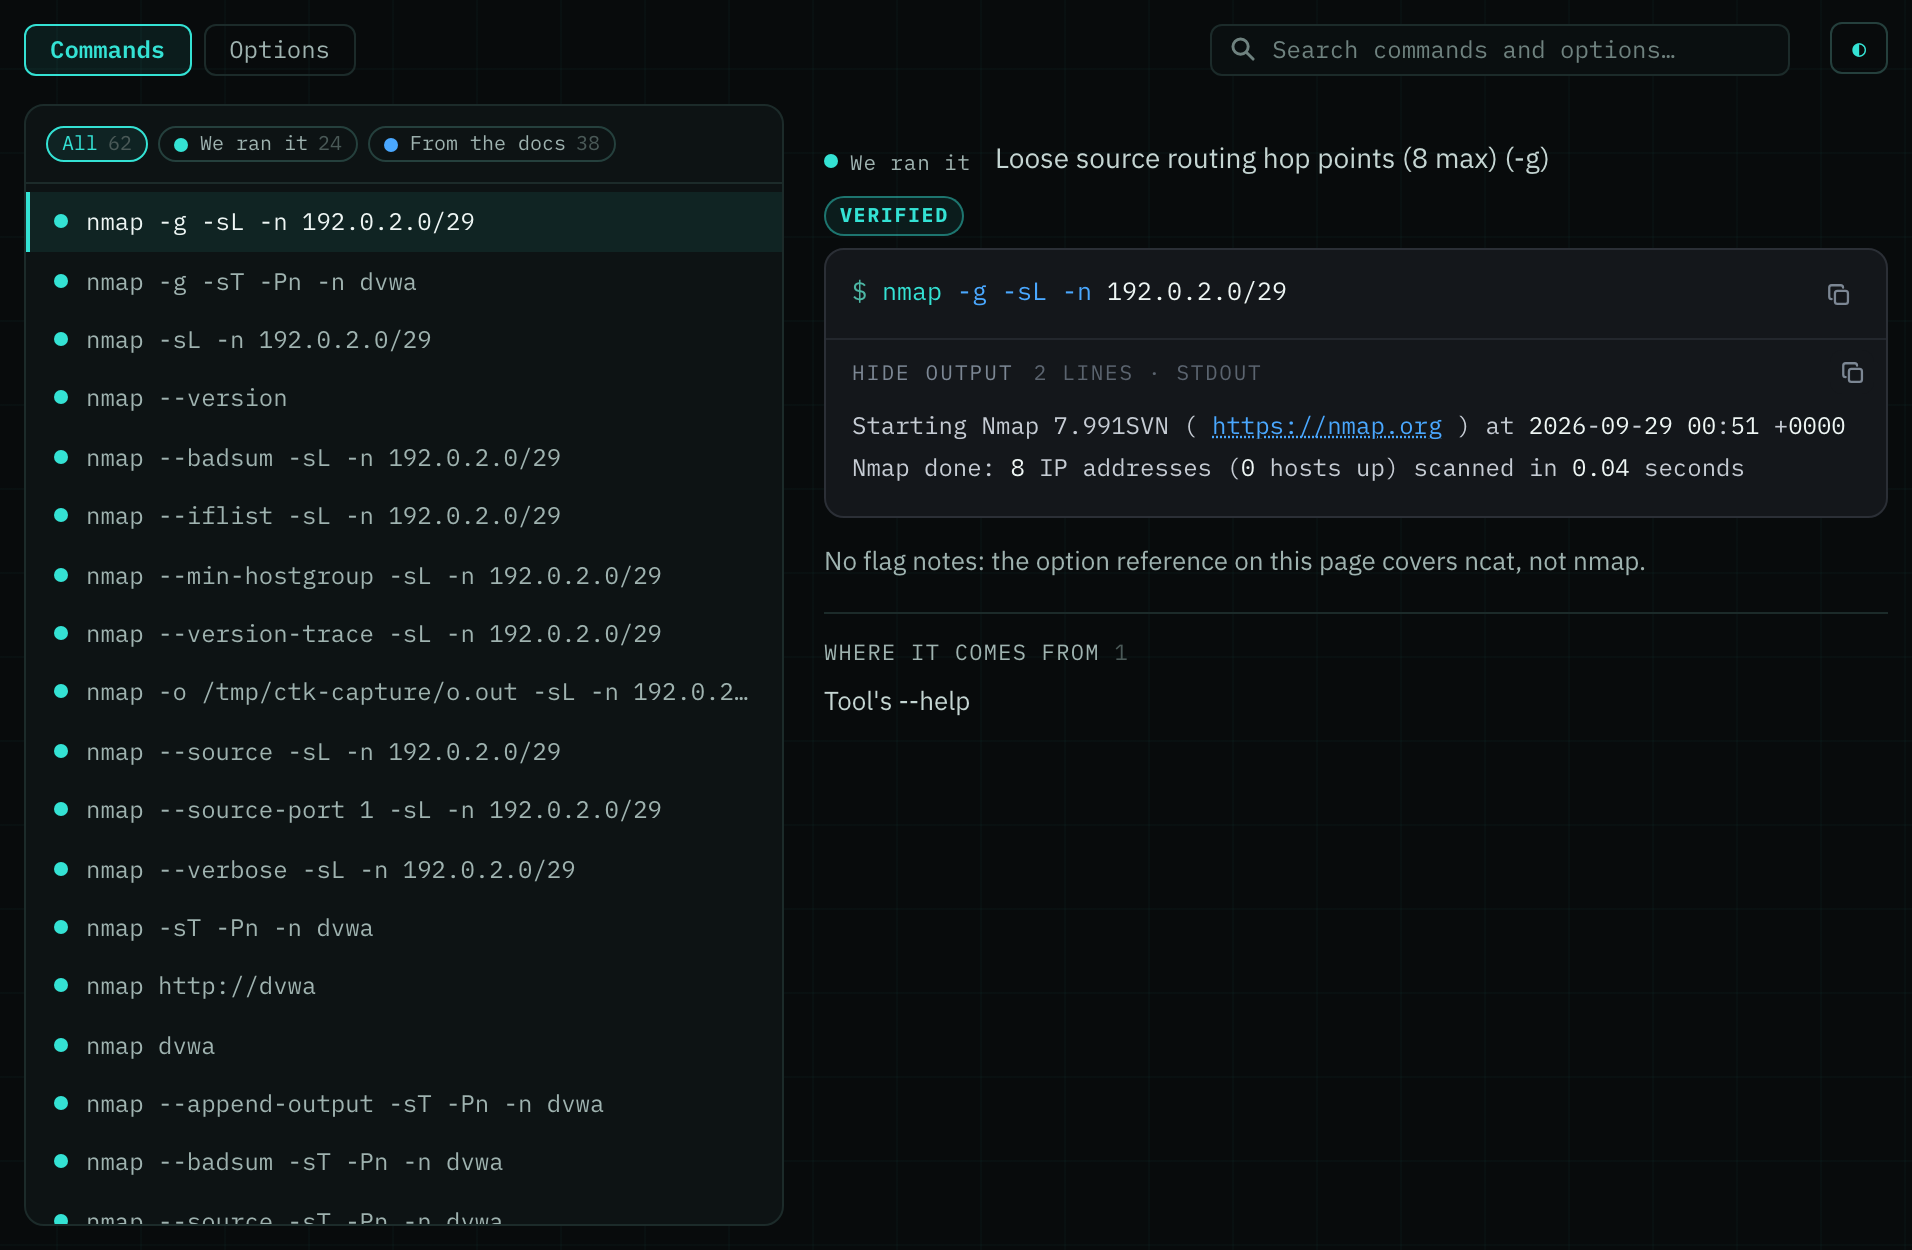
Every command a tool page knows about is now in one Commands list, instead of spread over Examples, Documented commands and the conversation cards. Each command appears once, with a dot that says whether we ran it, it comes from the docs, or the community posted it, so you can filter to just the ones that were proven to work. Pick one and it opens beside the list with its output, what its flags do and every place it was seen. Options, Timeline and Compare are tabs in the same section.
-
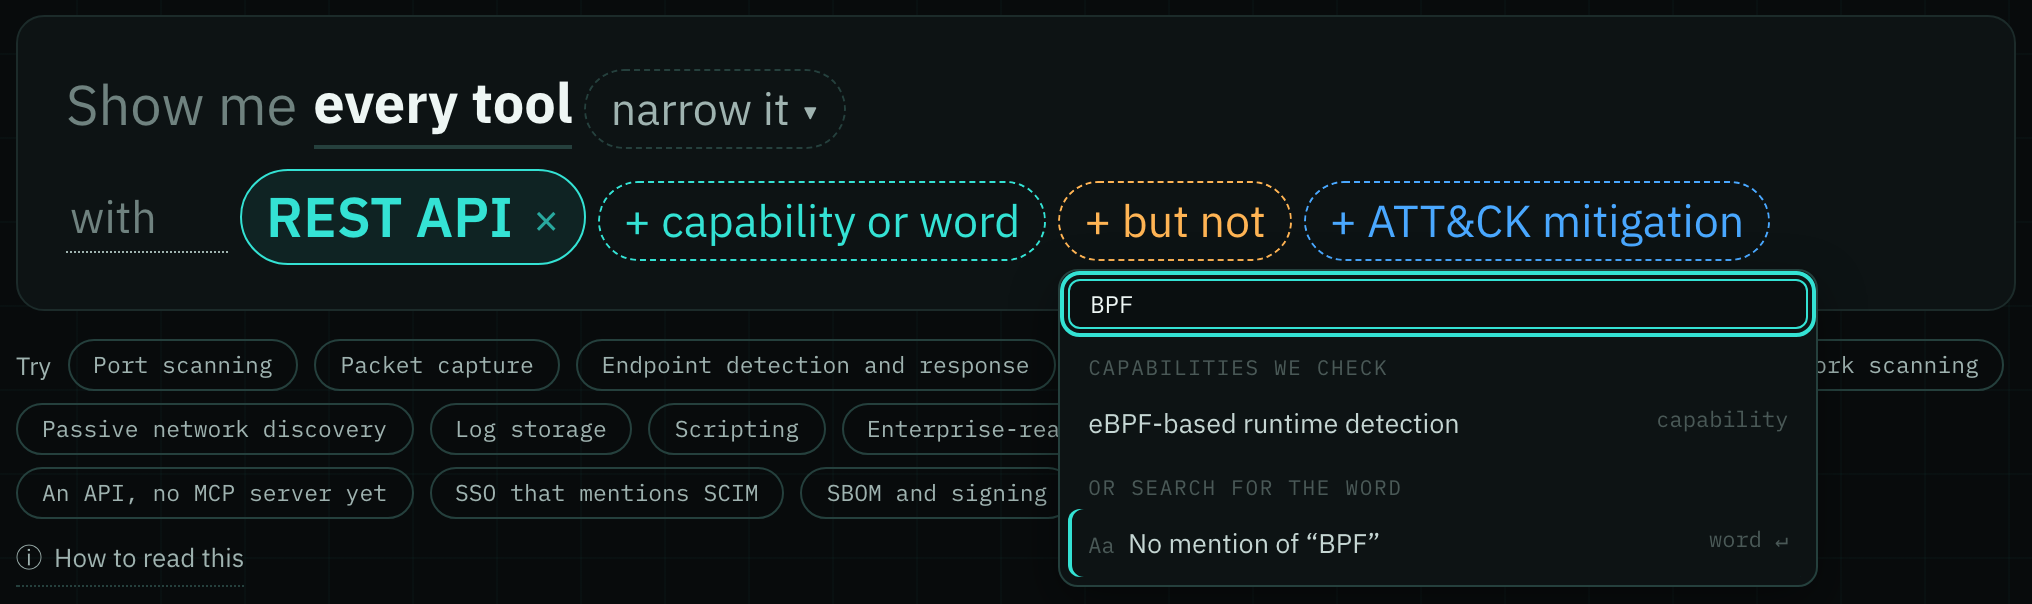
Rule tools out in a Capability Search with the new “but not” button, so you can find every tool with a REST API but no MCP server, or every tool that never mentions a word. Pressing Enter now searches exactly what you typed, so “BPF” finds the word BPF instead of the closest capability; use the arrow keys to pick a suggestion.
-
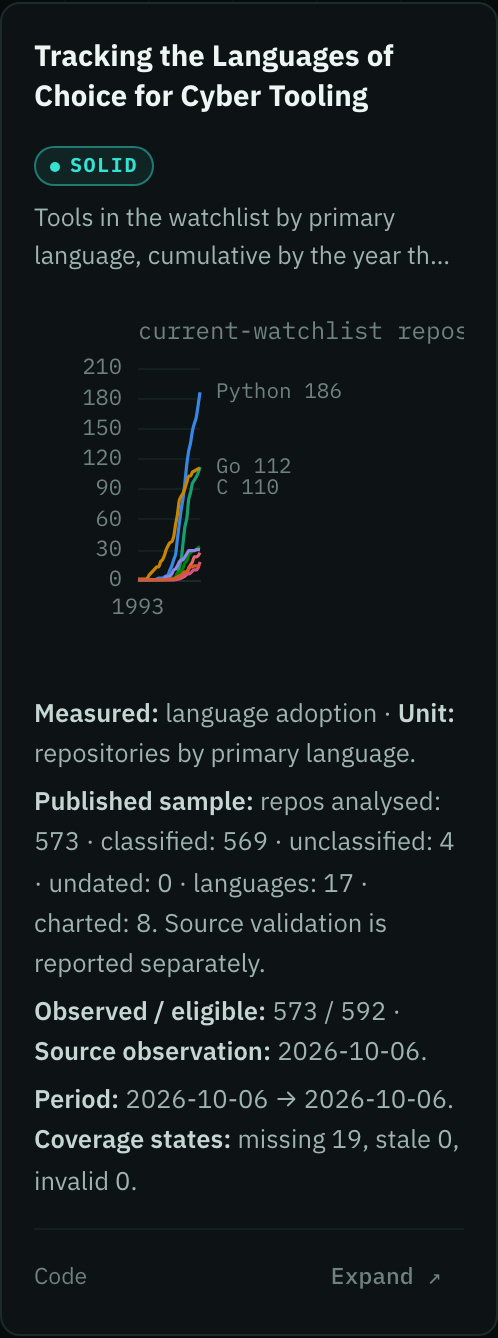
Analytics now shows coverage and source dates beside each chart, and withholds comparisons that fail evidence checks, so you can tell which conclusions the data supports.
-
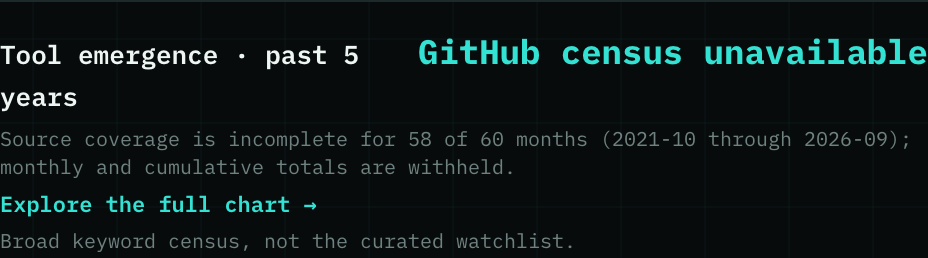
The home discovery chart now marks missing GitHub census months as unavailable, so gaps no longer appear as zero growth.
-
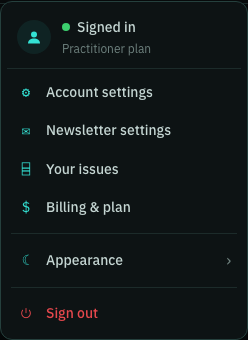
Your account menu now shows which plan you're on, right under "Signed in", on every page and however you open it, so you can check your plan without visiting your account.
-
Add an ATT&CK mitigation to a Capability Search with its own button, then join it to a capability with “and” or “or”, so you can ask for tools that do both, or either.

-
You can now offer to help shape the data. Tick the box on your account page or after checkout, and we'll occasionally invite you to short research questions and polls about the tools you use. It starts unticked, and you can untick it anytime.

-
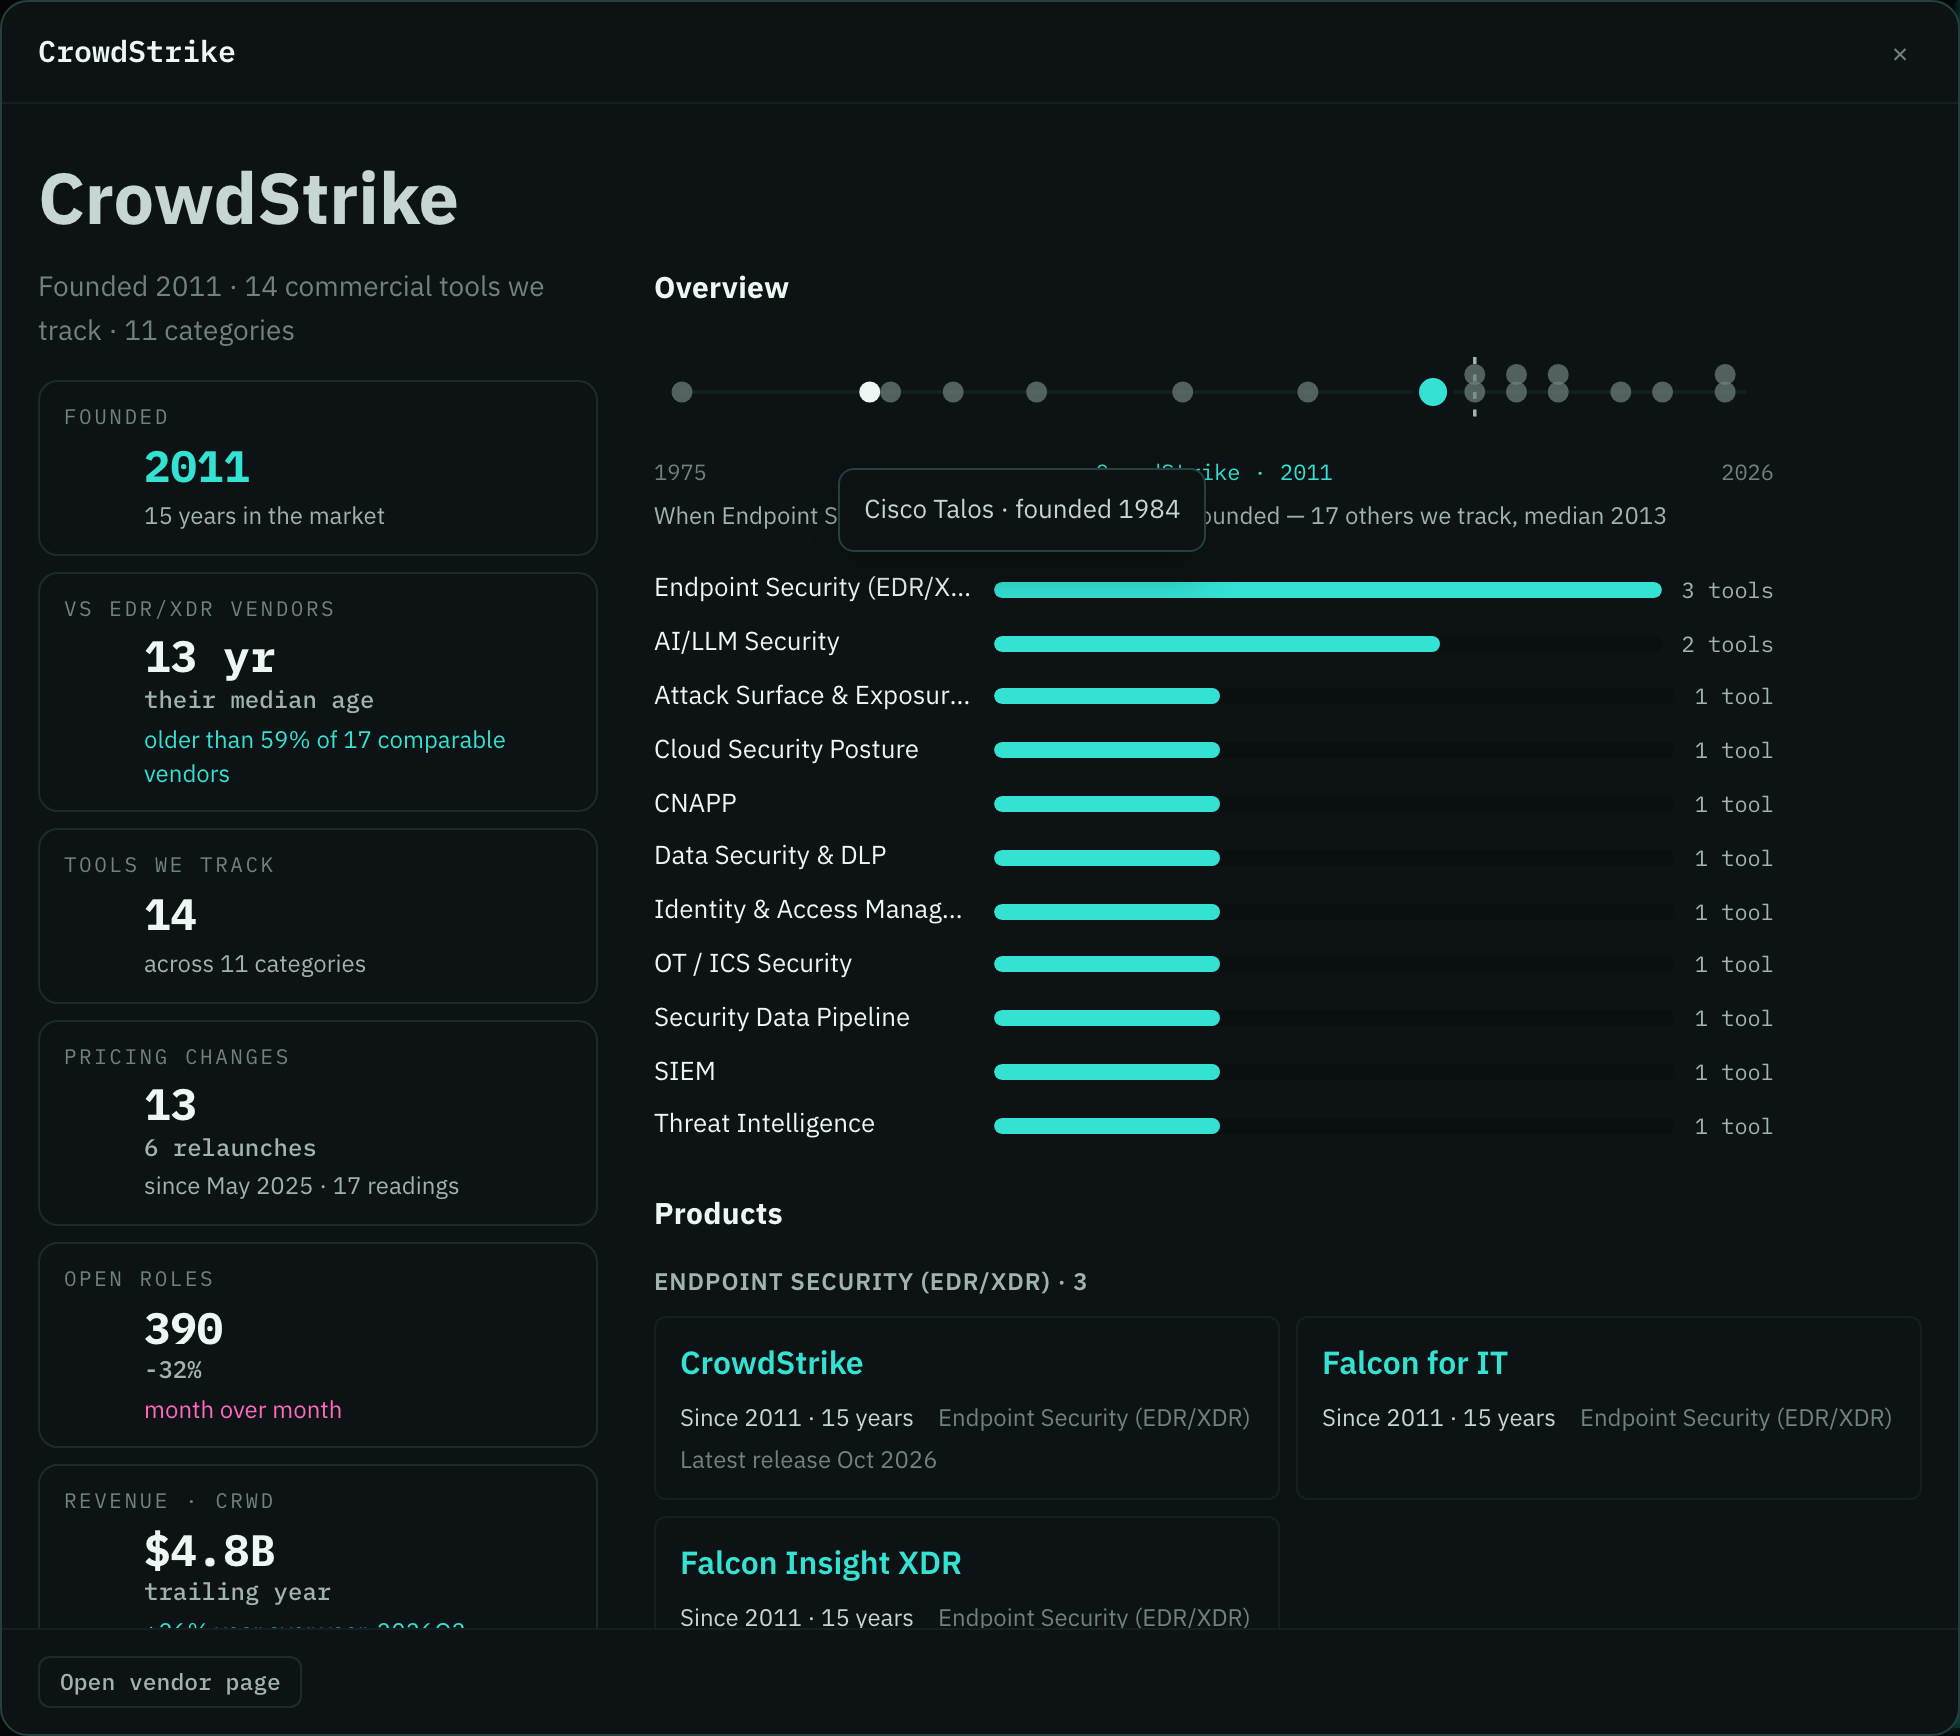
Vendor details now show the whole company, not just its tools: the year it was founded and how that compares with vendors in the same category, how fast it ships, how well it writes release notes, how often its pricing moves, open roles, uptime and revenue where we have them, then its tools grouped by category, its pricing and website history, and the launches we have covered. "History" opens the same view, landing on the history, so you no longer switch between two dialogs. Hover or tab across the founding timeline to see which vendor each dot is. Every product shows when it started and how long it has run, and one that has gone quiet or been retired says so.
-
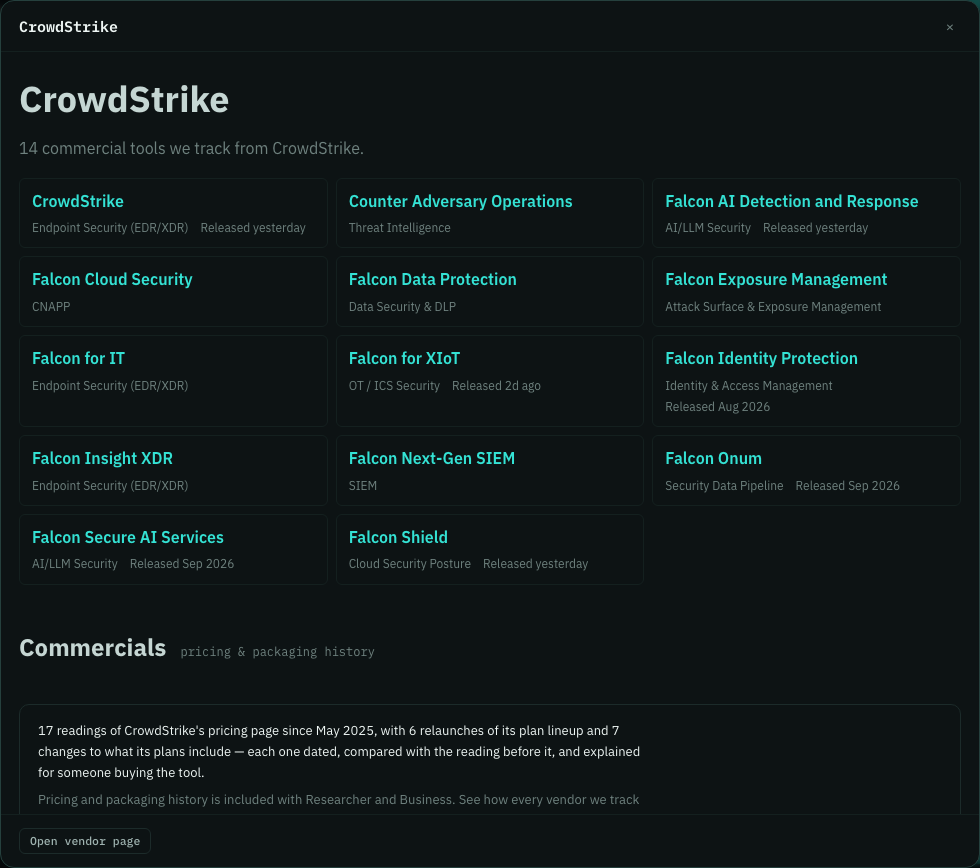
See every tool a vendor makes at a glance: vendor details now lay products out as compact tiles instead of a long scrolling list.
-
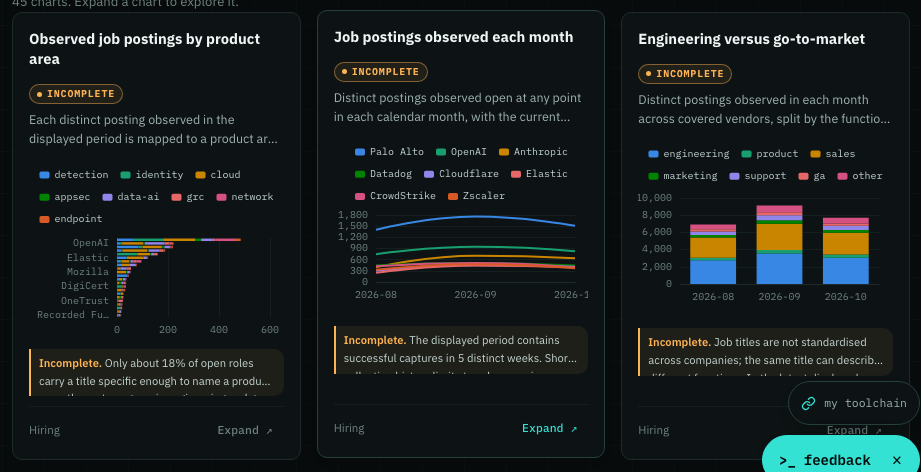
Open any chart on Analytics by clicking anywhere on its card. Cards now lift as you point at them, so you can tell at a glance what will open.
-
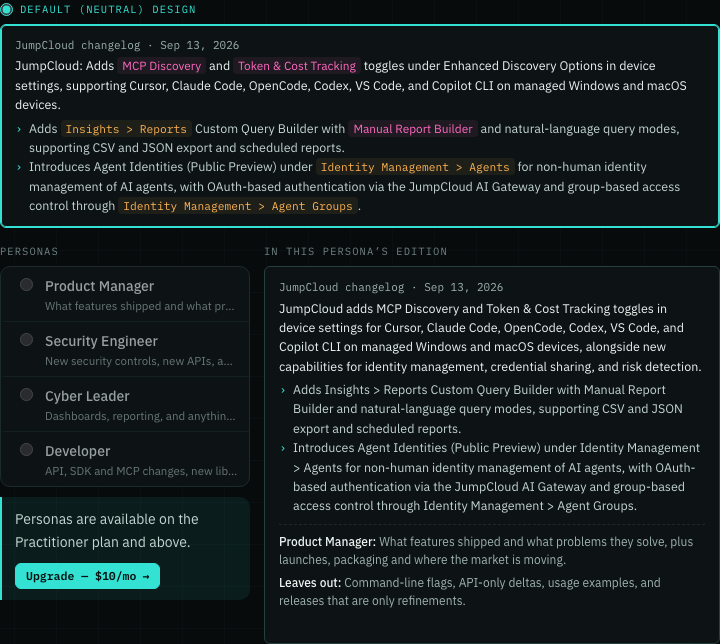
See which plan includes personas in one clear note, instead of an upgrade button on every persona.
-
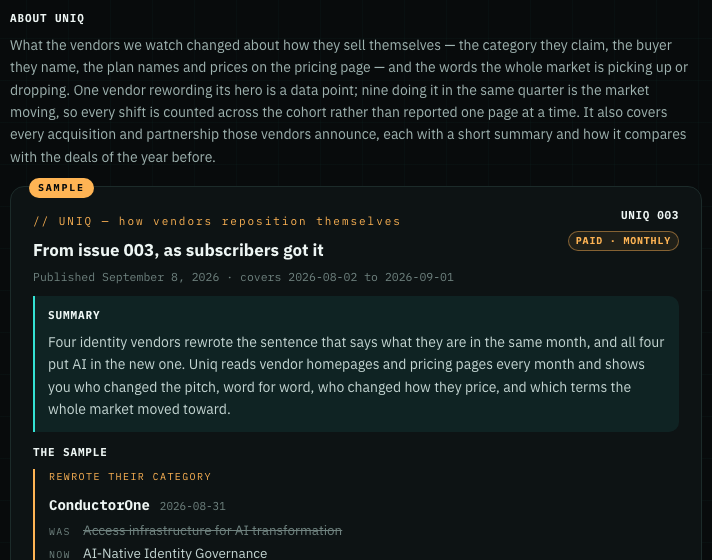
On the samples page, the description of each newsletter now sits above its sample instead of inside it, so you can tell at a glance what the newsletter covers and where the real issue excerpt begins.
-
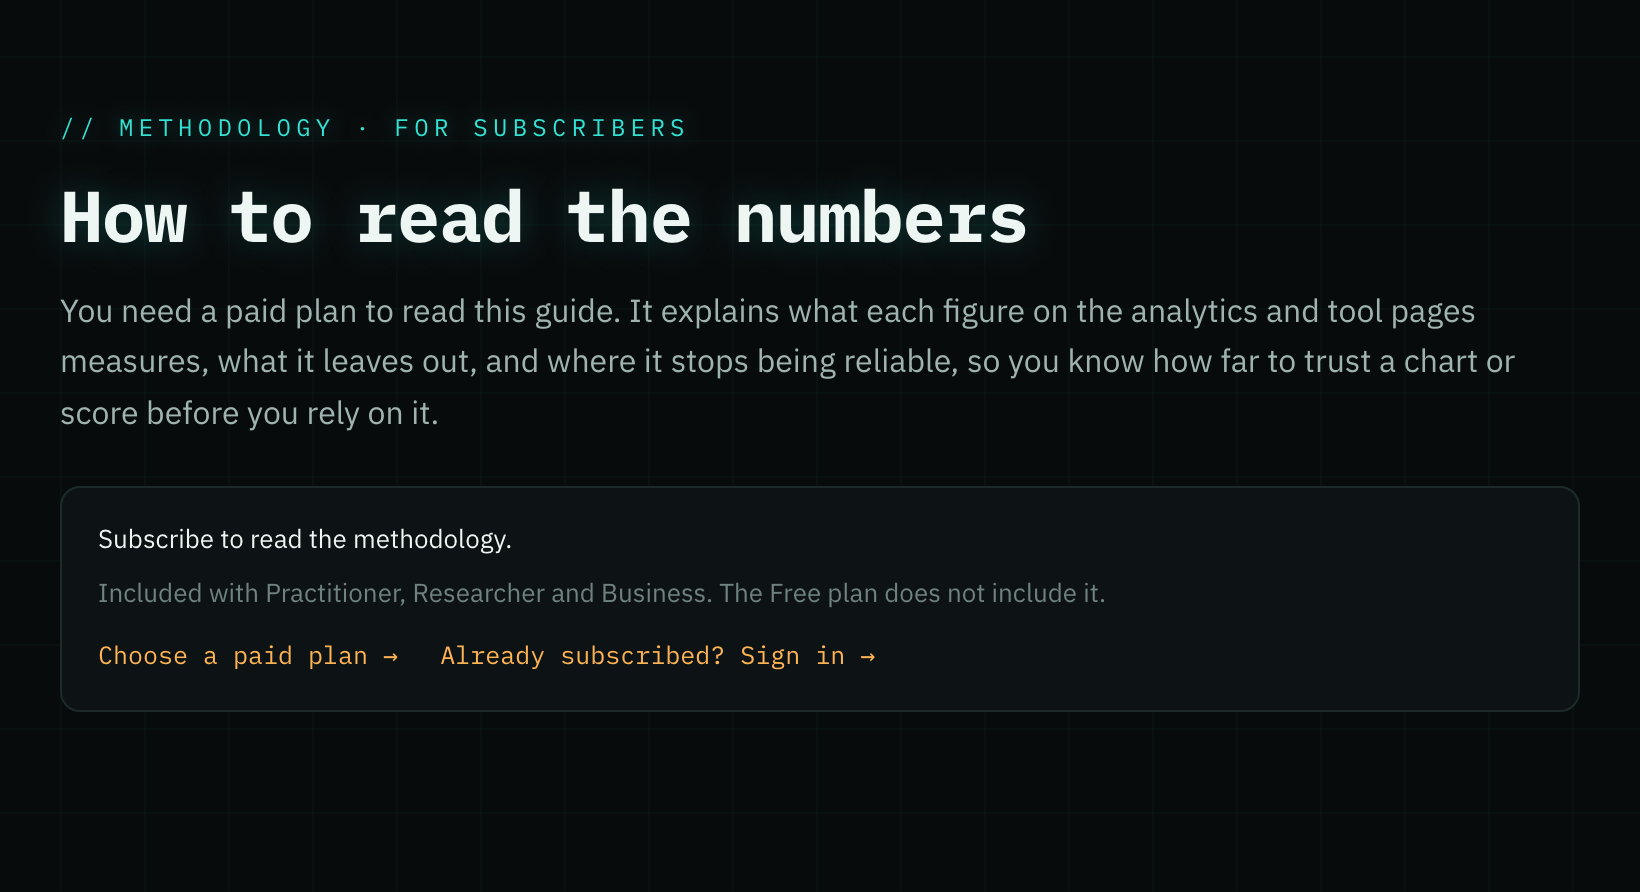
The methodology page now says plainly that it comes with Practitioner, Researcher and Business and not the Free plan, so you know before you click whether your account can open it.
- Every tool page's one-line description now tells you what the tool does. We read each description, summary and highlights list against the job that section has, and a line that only says where the code lives or asks for pull requests is replaced. Wireshark's page used to open with a note about its Git mirror. It now says it captures and analyzes network traffic.
- A hardware price change now shows the new price, the old one struck through, and a coloured arrow pill with how much it moved, in dollars and percent. Green ▼ means it got cheaper, magenta ▲ means it got dearer, so you can see a deal at a glance on the site and in your email.
- After you buy a plan, the thank-you page now says Sign in on its button, because that is where it takes you. It also lists the three steps to pick your tools, so you know exactly where to tell us which ones are yours.
- Buying a plan with an email that already has an account no longer gets you charged twice. Checkout now emails that address a sign-in link so you can change your plan instead, and if a second subscription still goes through it is cancelled and refunded in full within moments, with an email telling you so.
- Searching Capability Search by an ATT&CK mitigation now finds far more tools: 31 of the 44 mitigations return results, up from 11. Tools that audit what a mitigation configures are listed too and marked “Assesses configuration”, so M1015 (Active Directory Configuration) now shows BloodHound and adscan without claiming they configure Active Directory for you.
- Signing in as a different account now switches every open tab to it. Before, if you opened a sign-in link for a second account, pages you already had open kept showing the first account's settings and plan, and could switch you back to it.
- When you open a vendor, its Website history now comes first, so you see how the vendor's site has changed before you scroll to its pricing history.
- When you sign in from an emailed link, the top bar now shows your account menu straight away. It used to keep offering Sign in and Subscribe until you reloaded the page.
- A tool's video no longer shows up twice in a row. When a same-day update repeated the video already shown with the new features, it now appears once, so each entry is shorter and you aren't scrolling past the same clip.
*
Oct 5, 2026
-
Improvement
Read vendor updates with the precision their sources provide: month-only releases show the month, and weekly batches show “Week of” instead of an invented release day.
-
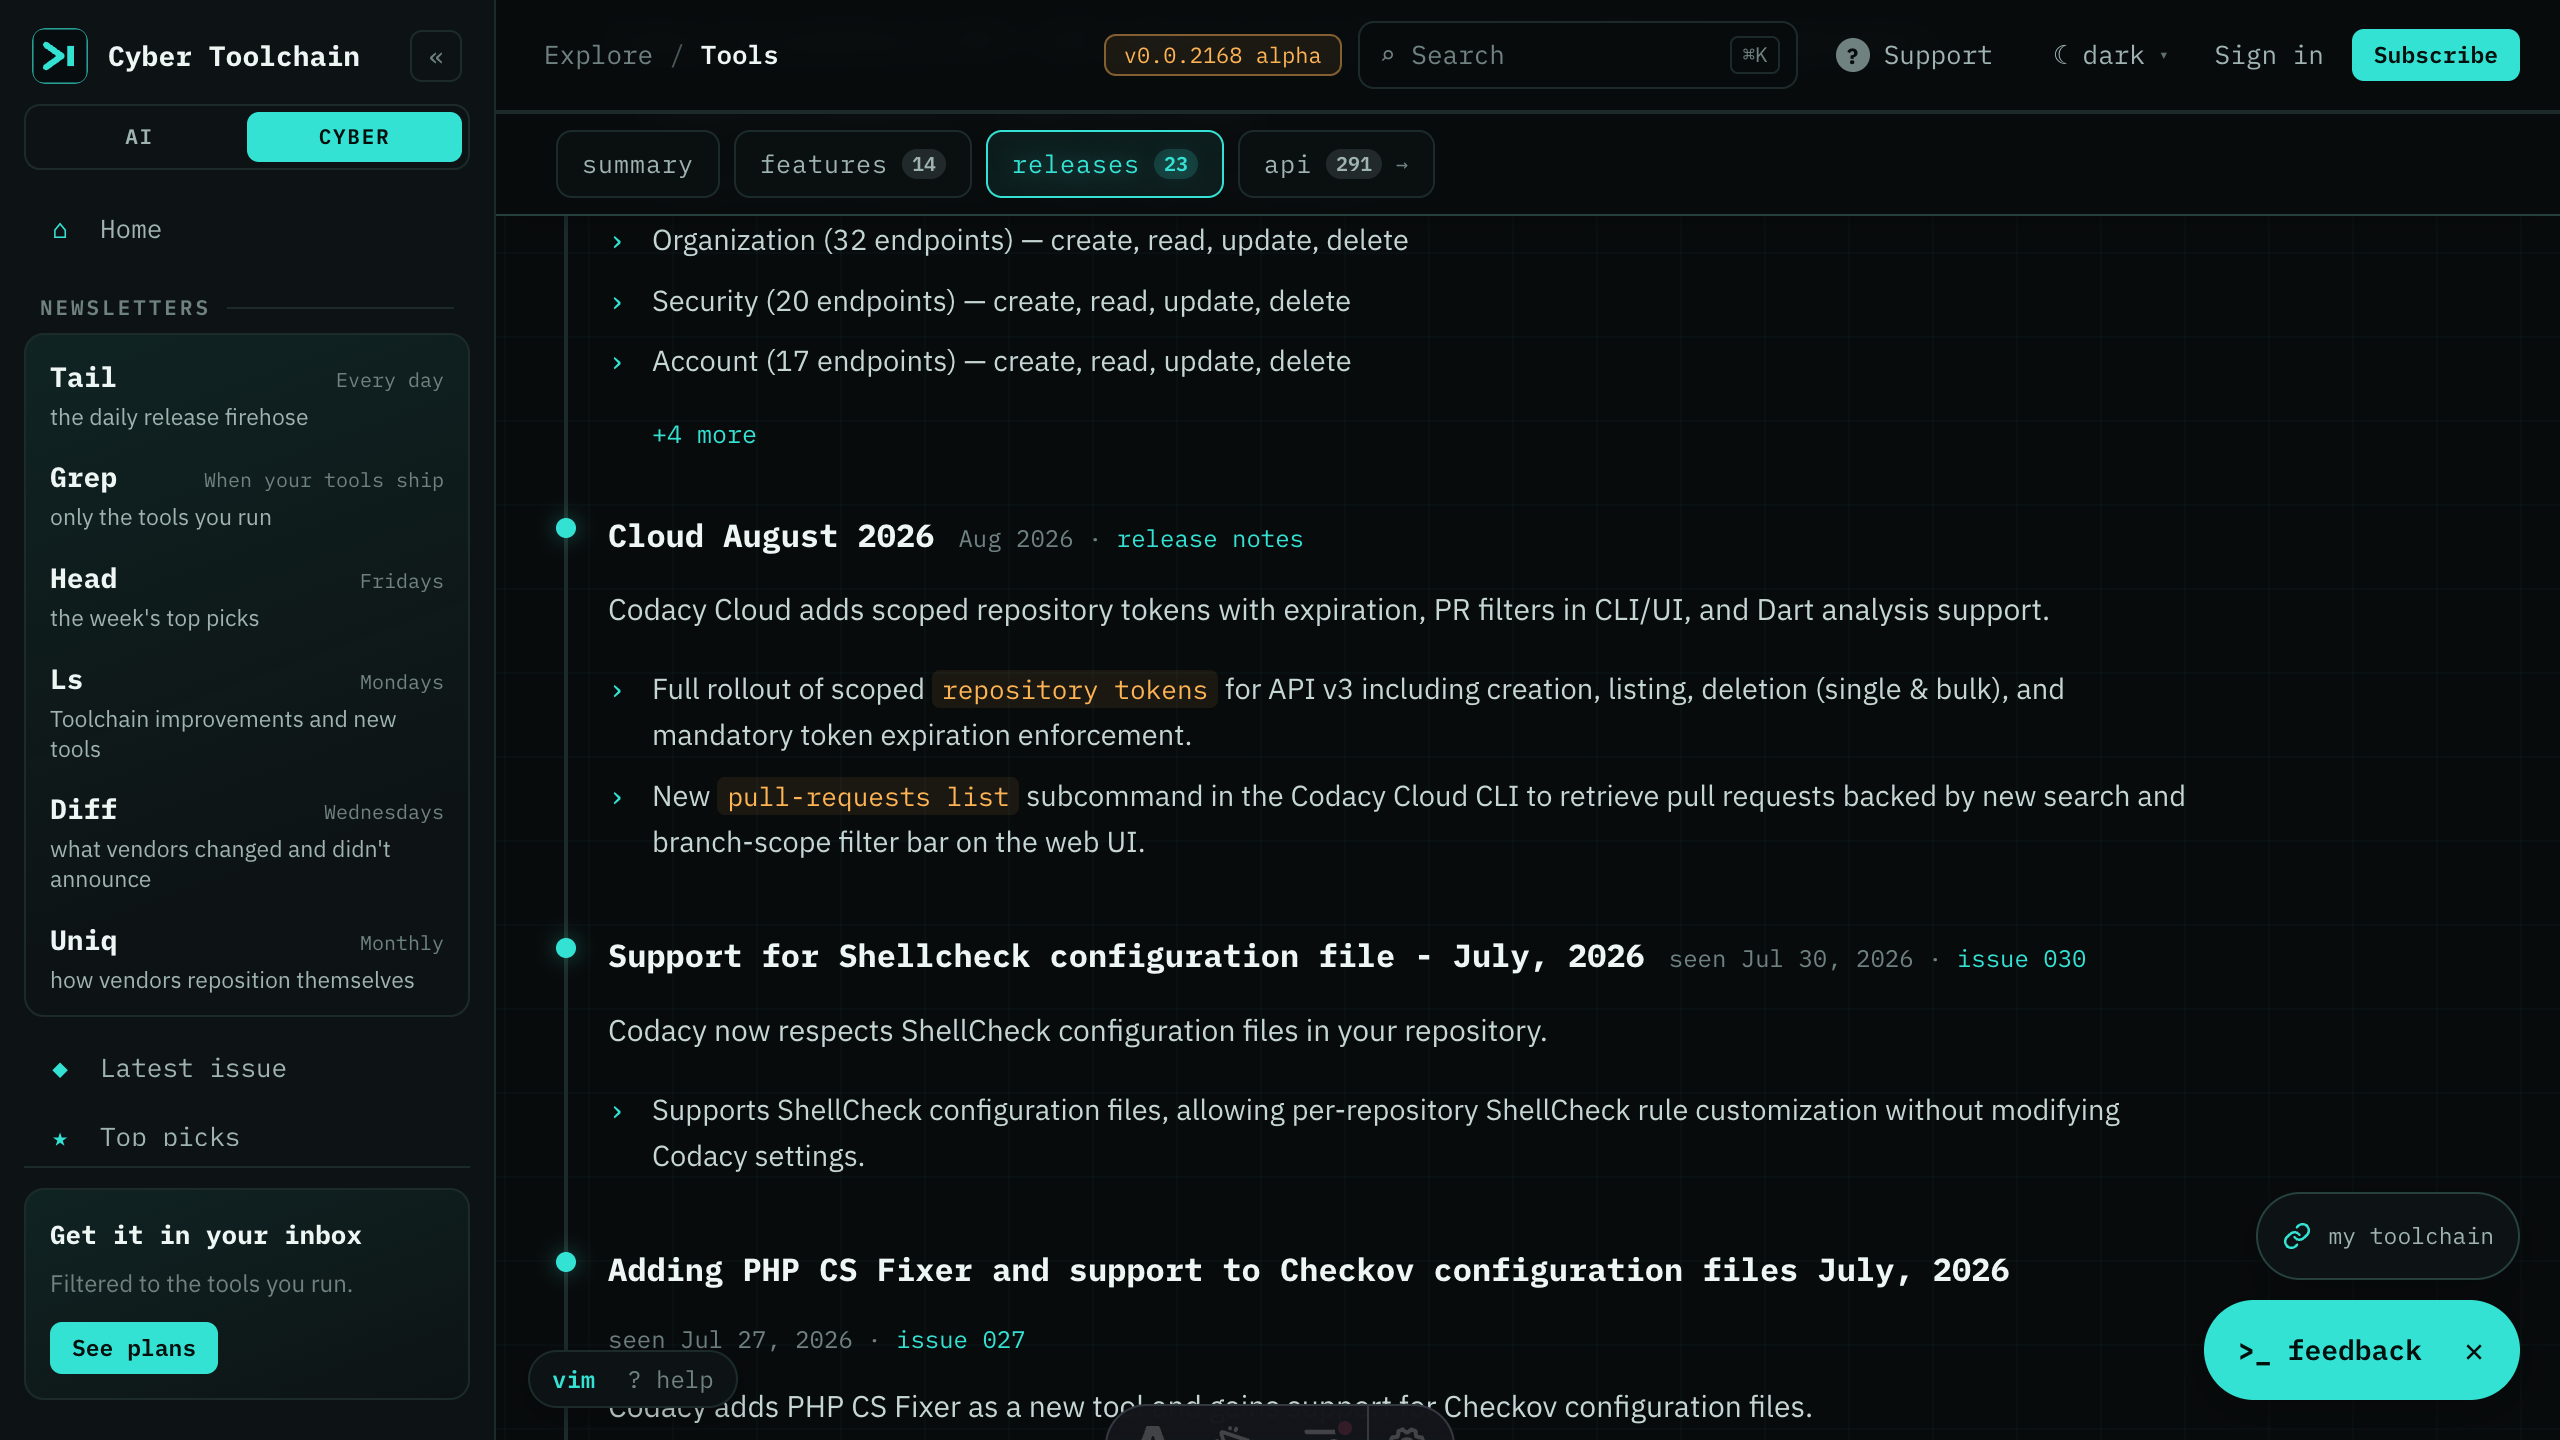
Open the original vendor release notes directly from older, reconstructed entries on a tool’s timeline.
-
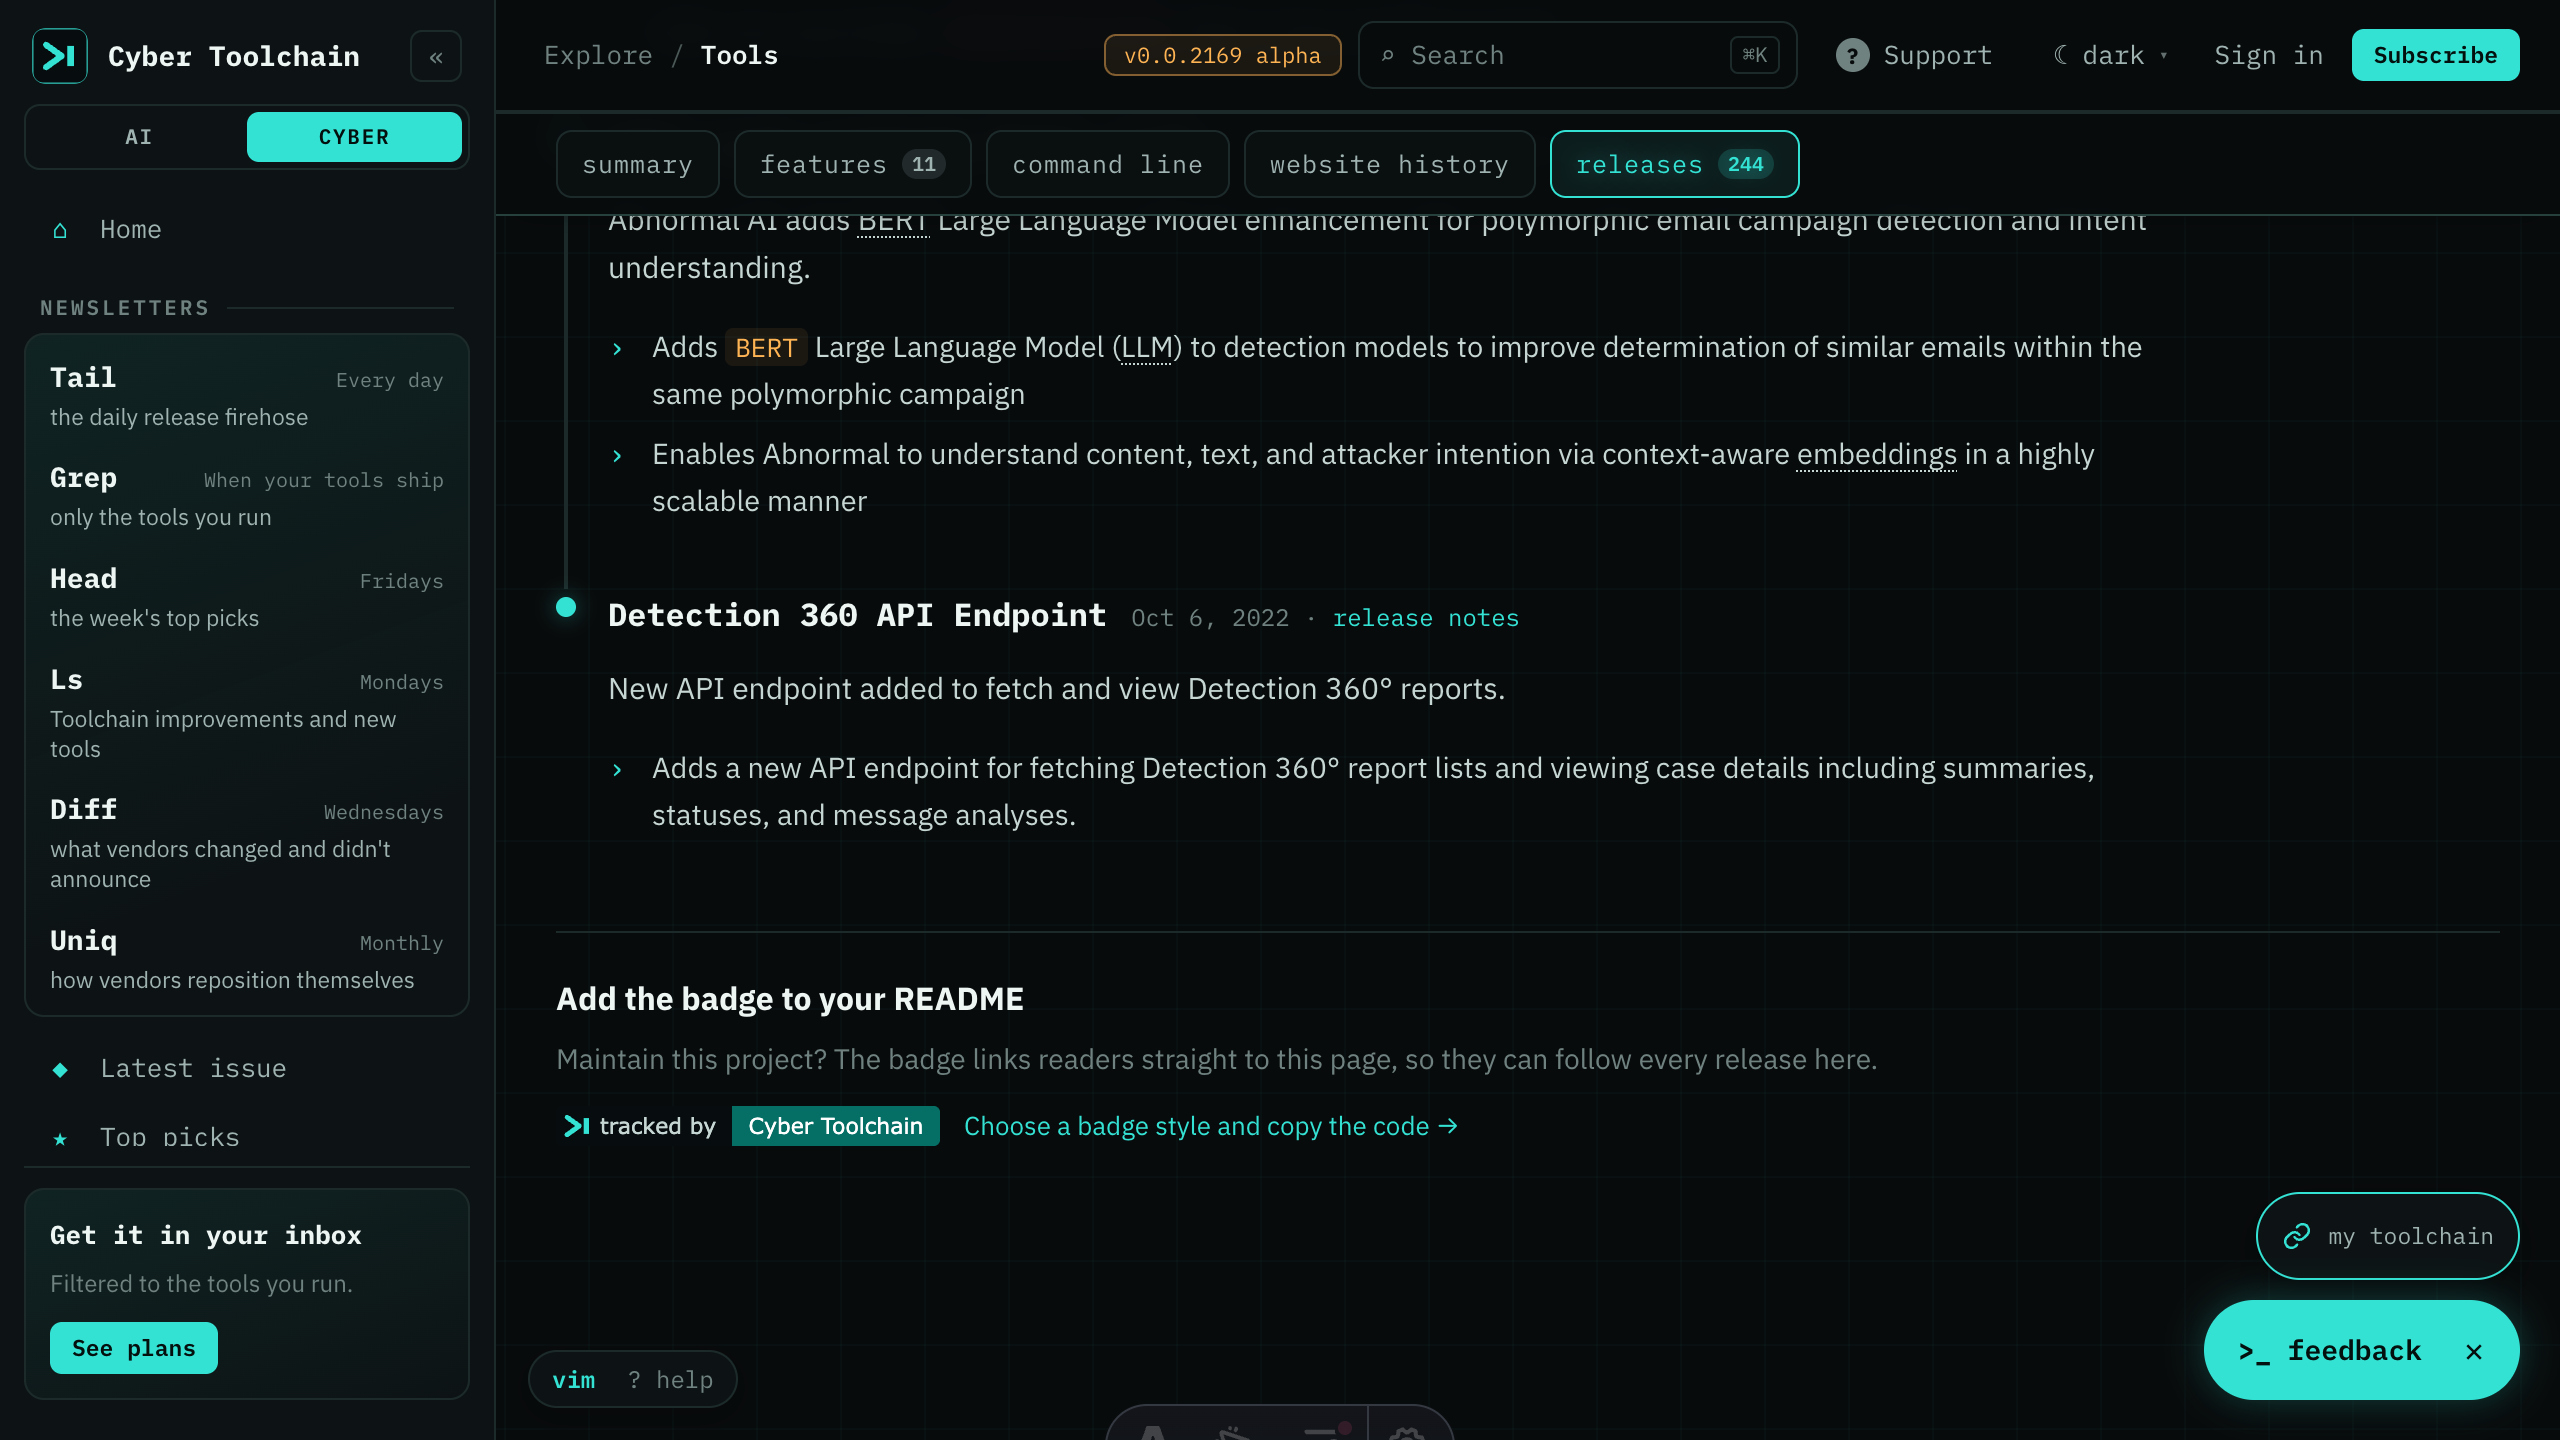
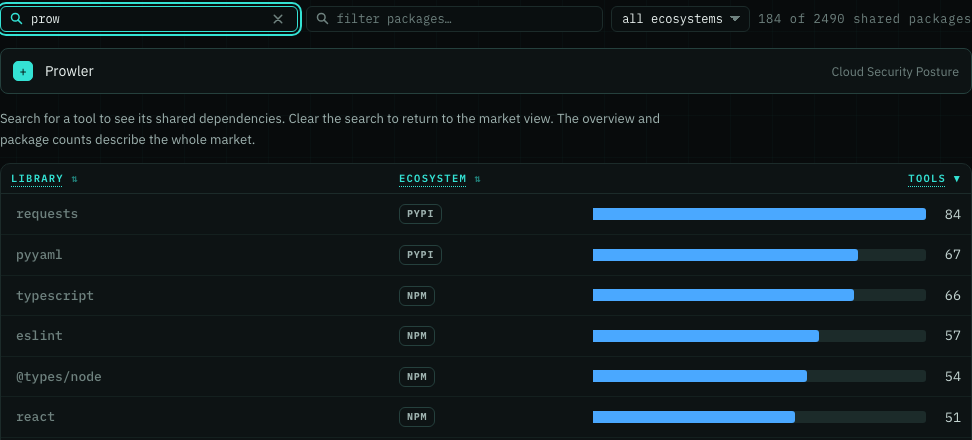
Explore shared libraries in a sortable supply-chain table with comparison bars. Start with the market view, search for a tool, and open a library for its dependent tools and package links. Measurement notes stay tucked away until you expand them.
-
Read vendor updates with the precision their sources provide: month-only releases show the month, and weekly batches show “Week of” instead of an invented release day.
-
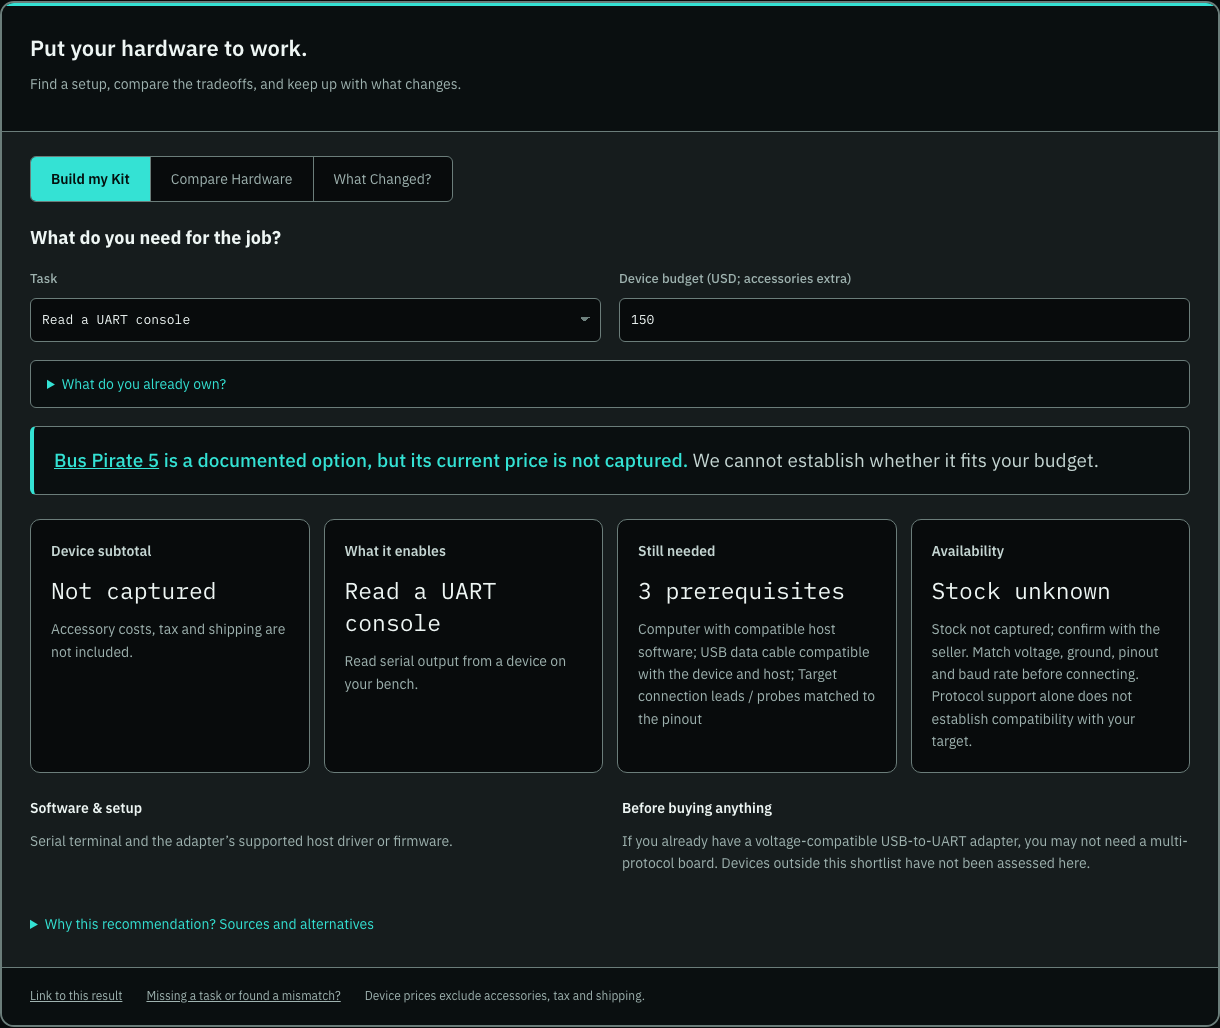
Build a kit, compare devices and follow hardware changes more easily with clearer borders, distinct result cards and larger view buttons.
-
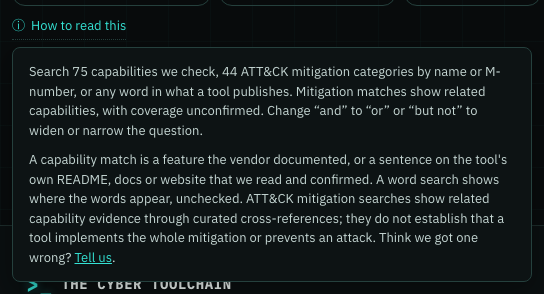
Read the Capability Search guidance from a tooltip, so you can focus on your question without scrolling past the explanation.
-
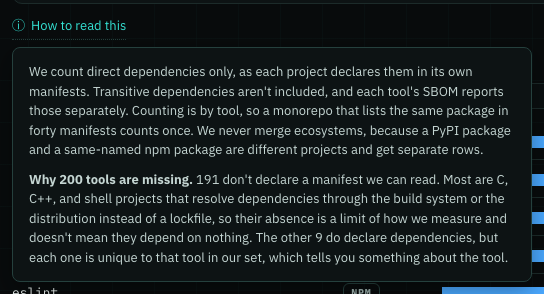
Read the Supply Chain counting rules and missing-tool explanation from a tooltip, leaving more room for the dependency chart and packages.
-
On Hardware, Compare, Clear stars and Share my toolchain stay close at hand, without the software detection button.

-
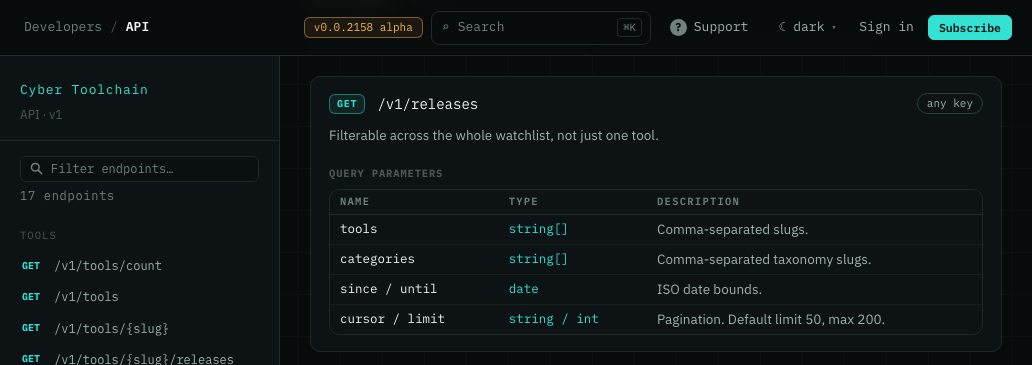
API endpoint links now bring the endpoint heading into view below the site header, and the endpoint index no longer hides beneath the header.
-
Keep your place in the navigation: the sidebar now stays where you scrolled when you open another page, including in the phone menu.
-
Explore more of a tool’s past releases, including Abnormal AI updates going back to 2022. Breaking-release figures now count each release once when it appears in both current and historical coverage.
-
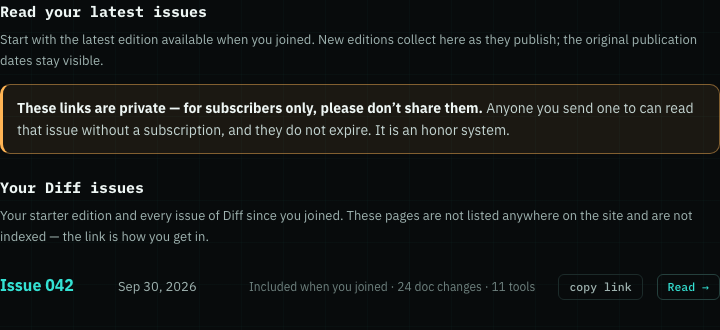
Start reading as soon as you join: Subscriber issues now includes a starter edition of each newsletter in your plan, alongside new issues as they publish. Original dates stay visible, and Methodology sits below your reading list.
-
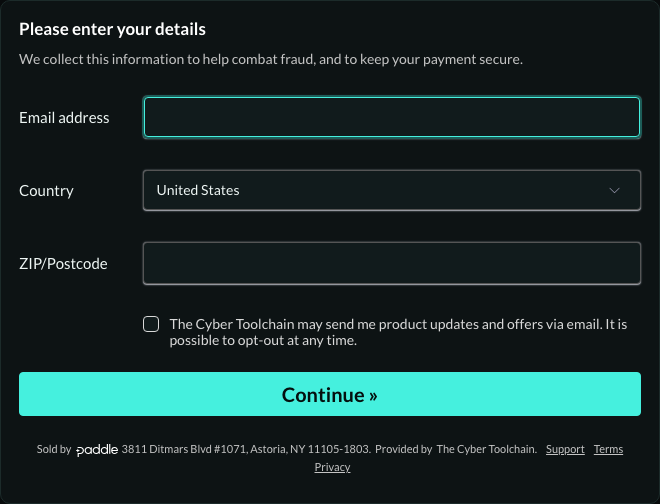
Checkout now opens with colors suited to your chosen page theme, with readable fields and consistent teal buttons in dark, light, sepia and contrast modes. Your payment details stay in place if you change the page theme while checking out.
-
Click anywhere on a page without unexpectedly dimming it. The mobile menu still dims the background while open and closes when you click outside it or press Escape.
-
Sample introductions are now labeled Summary, so you can tell them apart from the newsletter excerpts. Diff descriptions include wording fixes and individual character changes, and Uniq describes a single vendor rewrite as a data point.

-
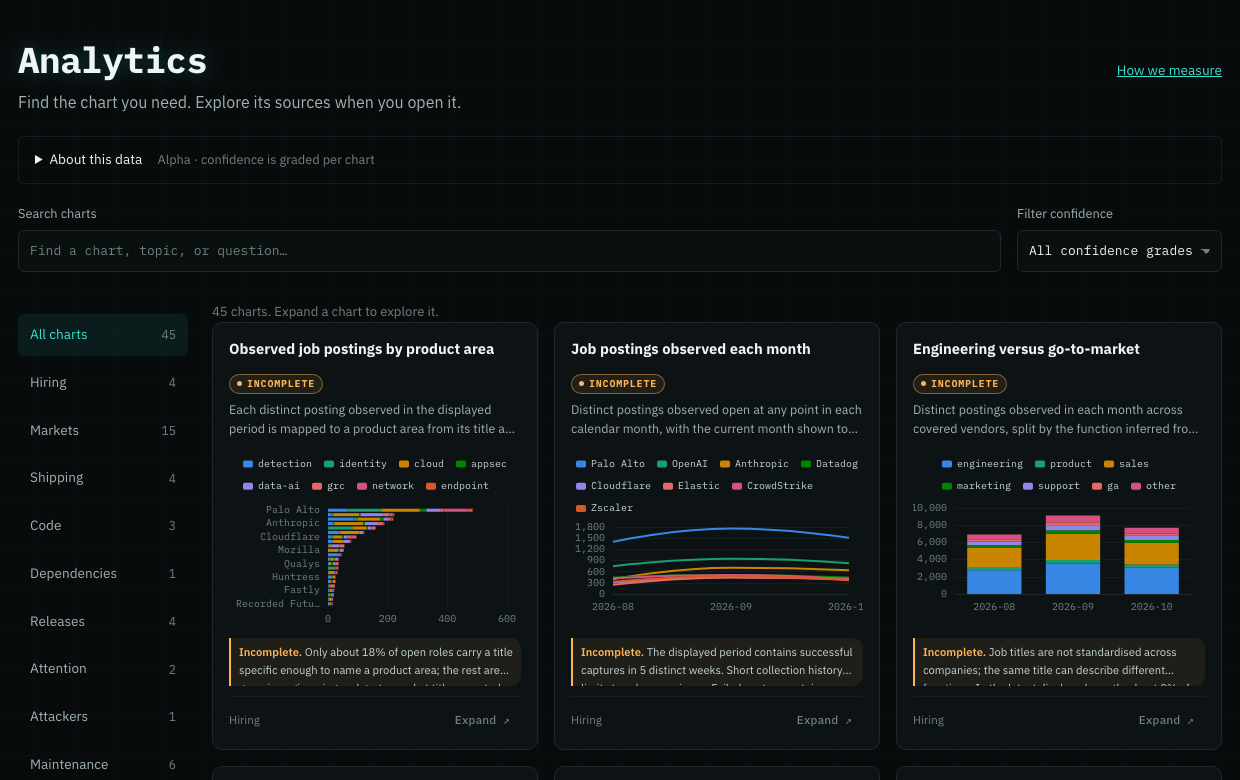
Find the chart you need without scrolling through the whole Analytics page. Search the chart library, filter by topic or confidence, and expand any chart to explore its controls and sources, with a full-screen option. Closing it keeps your place.
-
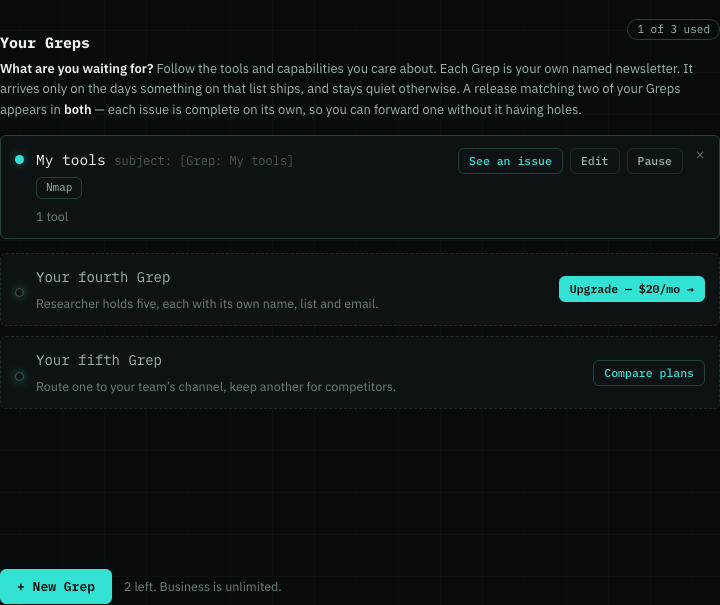
Practitioner now includes three Greps per site, so you can keep separate newsletters for your tools, your team and the vendors you follow.
-
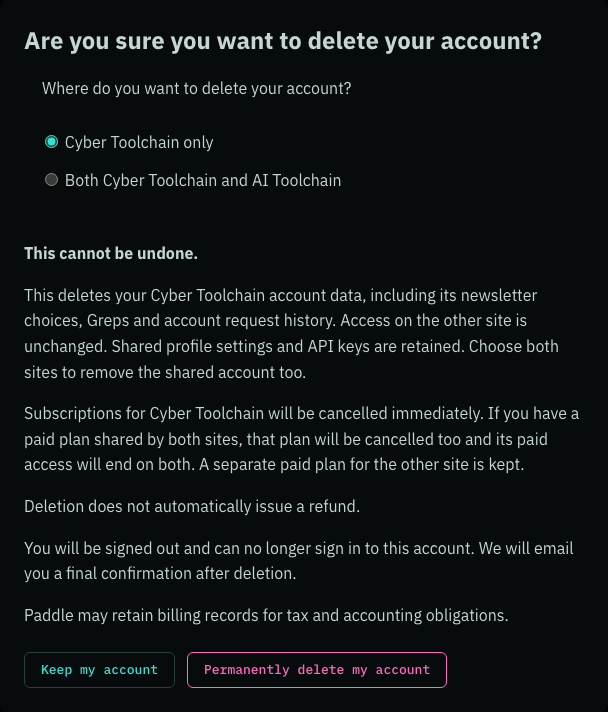
Delete your account yourself from My account, choosing this site only or both Cyber Toolchain and AI Toolchain. Review the permanent deletion and subscription cancellation details before confirming, then receive a final email. Our privacy policy, terms and refund policy explain what is removed and retained.
- The Manage your subscription link in your purchase email now signs you in when needed, just like Pick my tools, so you can reach your billing and account settings from either link.
-
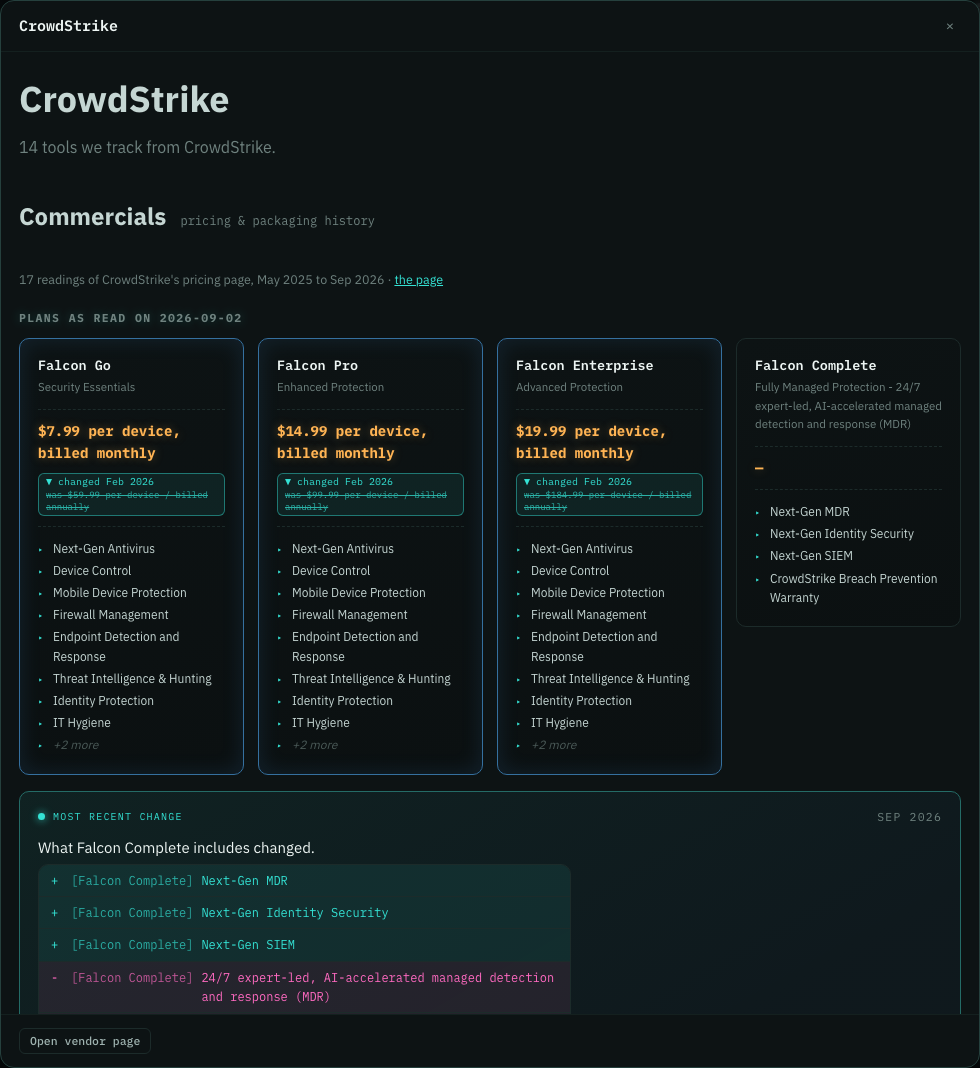
Read vendor pricing changes in color-coded diffs, with clearly styled plan cards and price labels that fit on mobile. Vendor histories now keep their formatting when opened from the Vendors page.
-
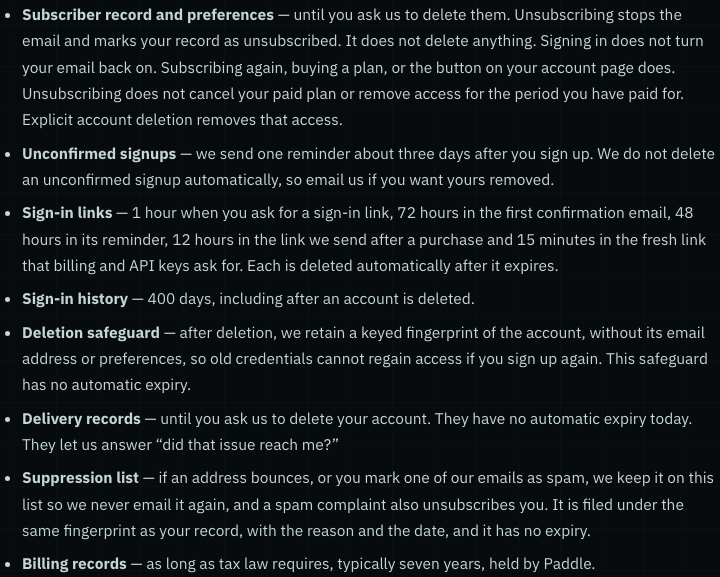
Deleting your account now prevents its old sign-in links and API keys from opening a later account at the same address. Unsubscribing from email keeps your paid access for the period you have paid for; our privacy policy explains the difference and the deletion safeguard we retain.
-
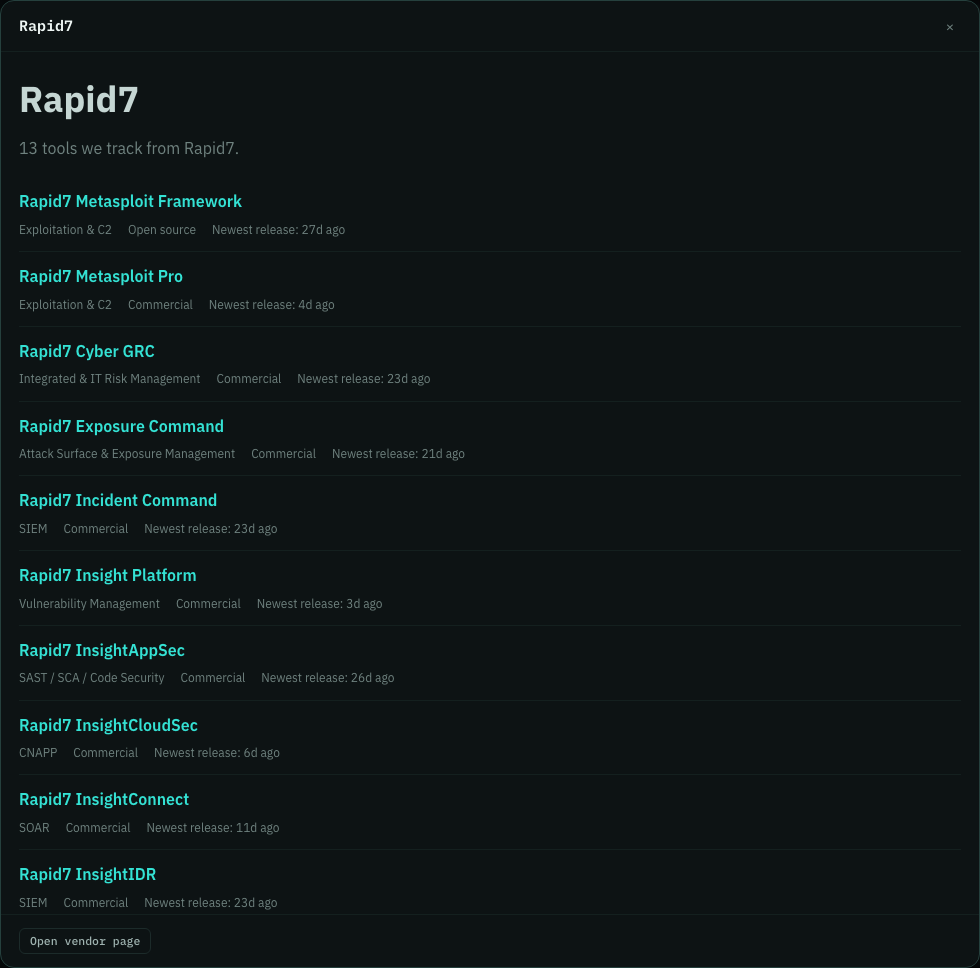
Browse every vendor from one Vendors page, with the pricing stats and chart still at the top. Open vendor details without leaving your search or losing your place in the list.
-
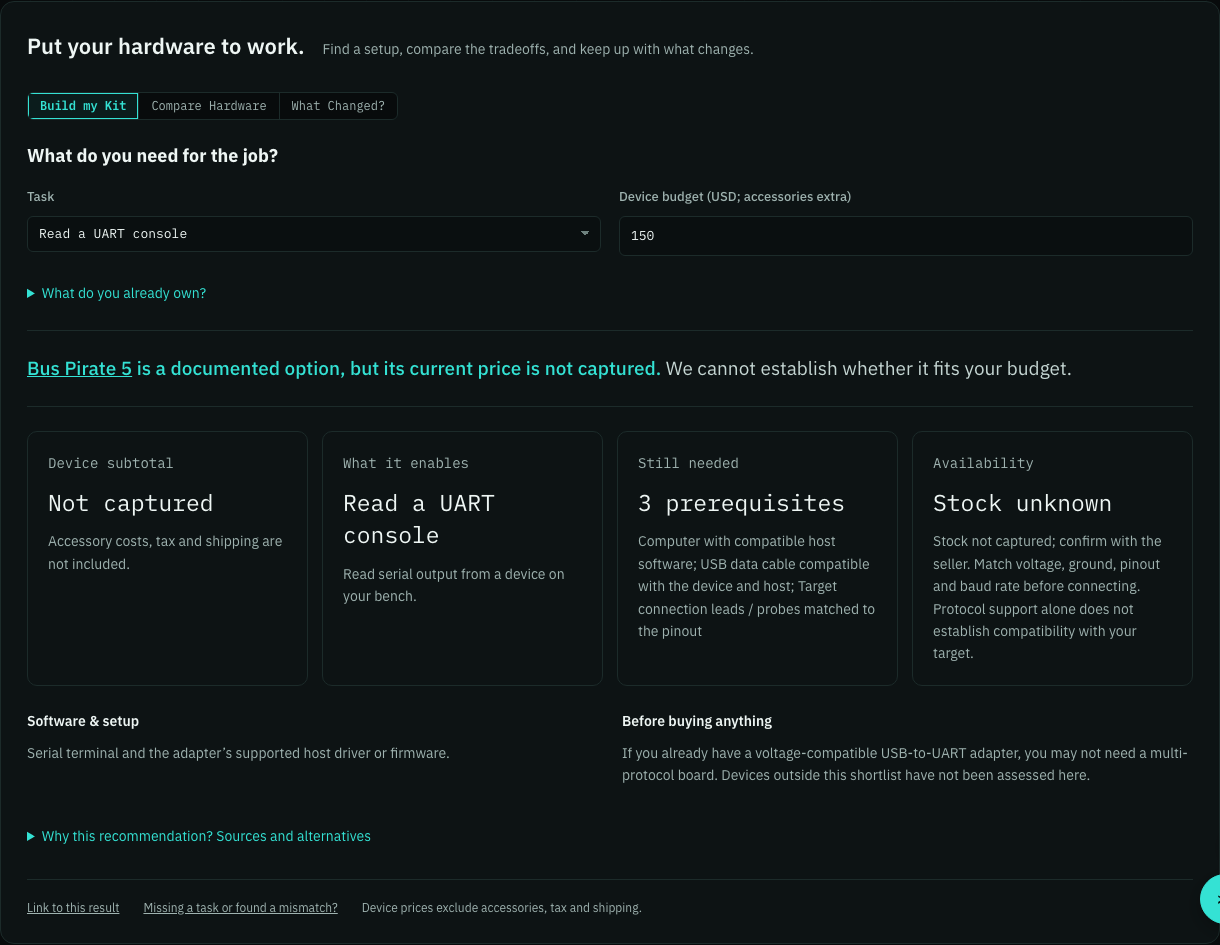
Find hardware for a UART, SPI flash or radio-receive task with Build my Kit, reuse gear you own, and see the prerequisites still needed. Compare Hardware puts two devices side by side with sourced specifications, and What Changed lets you follow their firmware, price and availability history. Historical launch prices and unpriced accessories stay separate from your device budget.
-
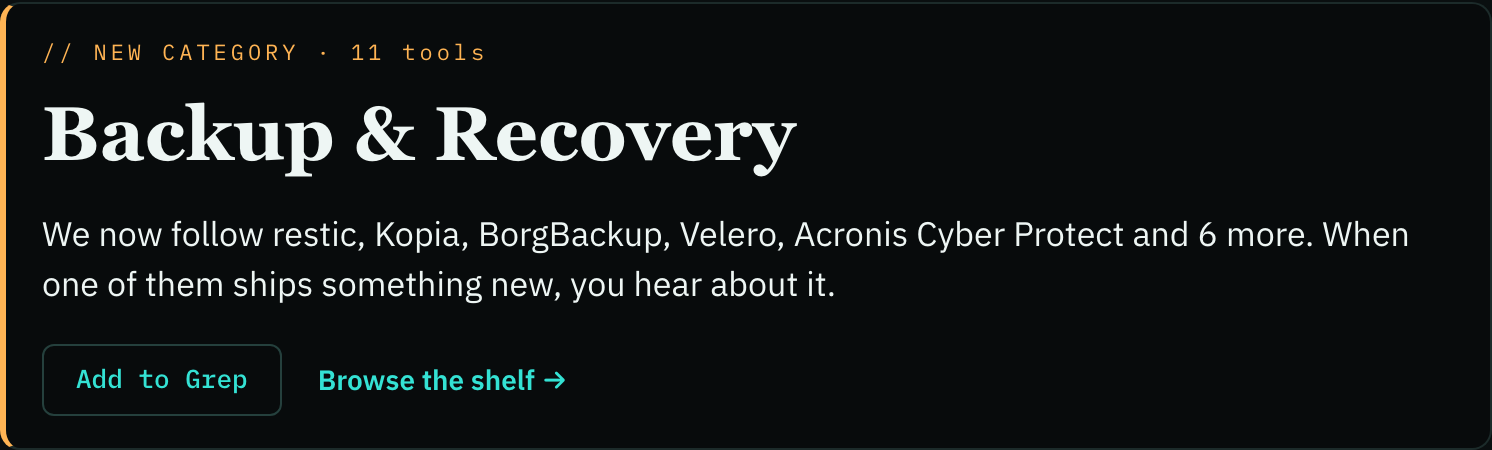
New categories in Ls now have prominent headings, so you can spot a newly added shelf at a glance. Browse the shelf opens only that category’s tools, including from older emails.
-
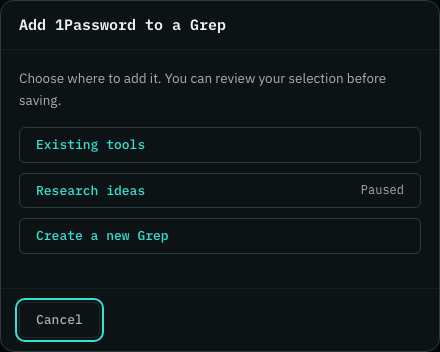
Choose which Grep gets a tool from the New on the Toolchain email, or create a new Grep for it. The buttons now say Add to Grep. If you are signed out, your picks are saved to My Toolchain in this browser so you can keep them without signing in.
-
See what you can do with this week’s Toolchain improvements before browsing new tools in Ls. Screenshots, practical examples and links help you try what shipped; an improvements-only week now gets an issue too.
-
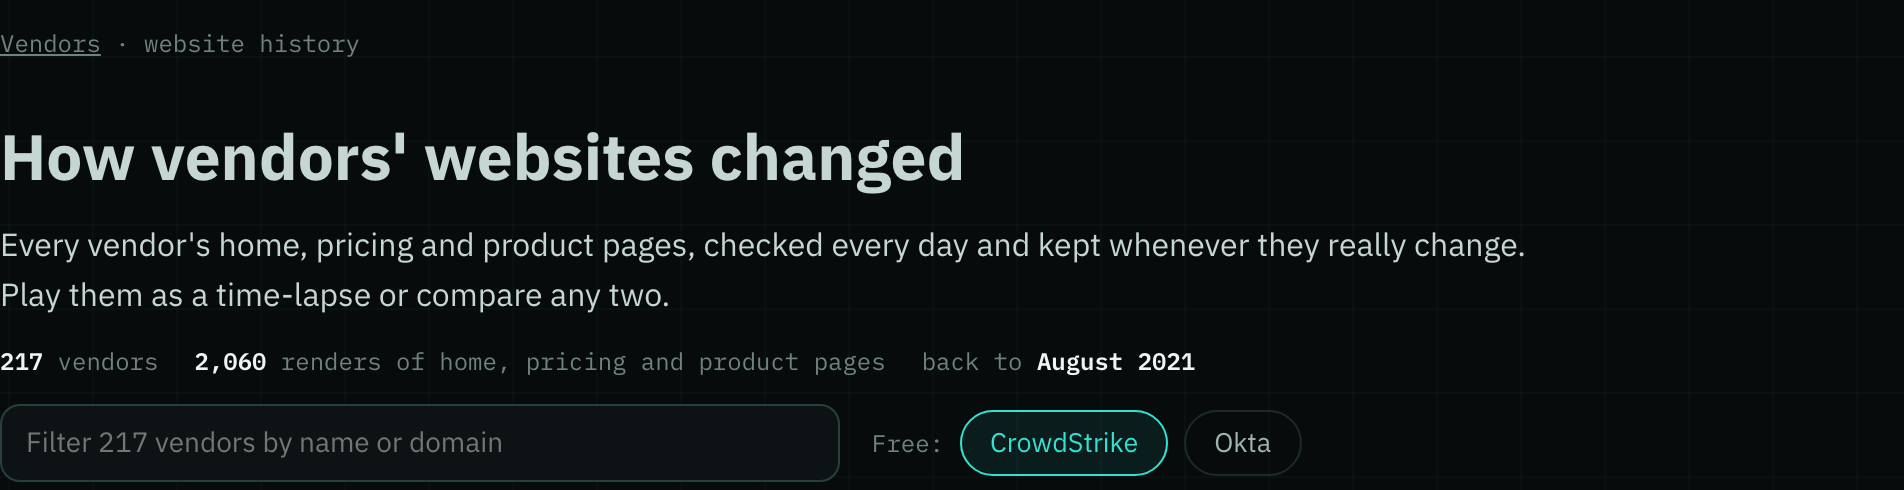
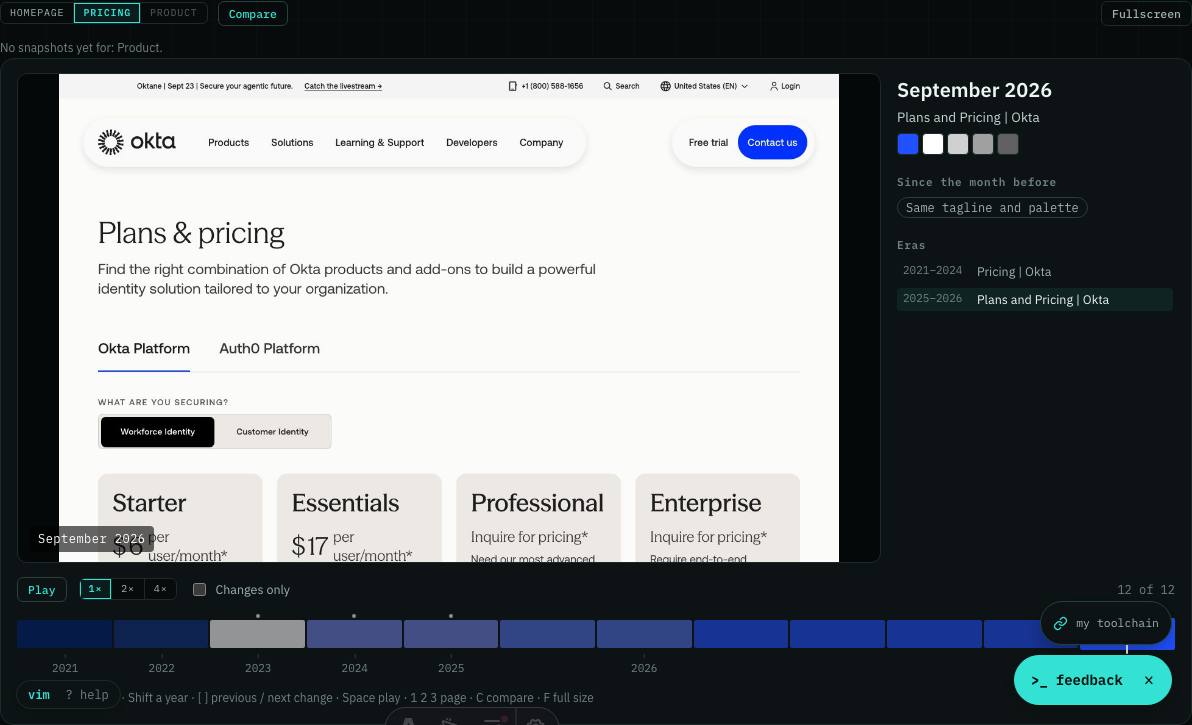
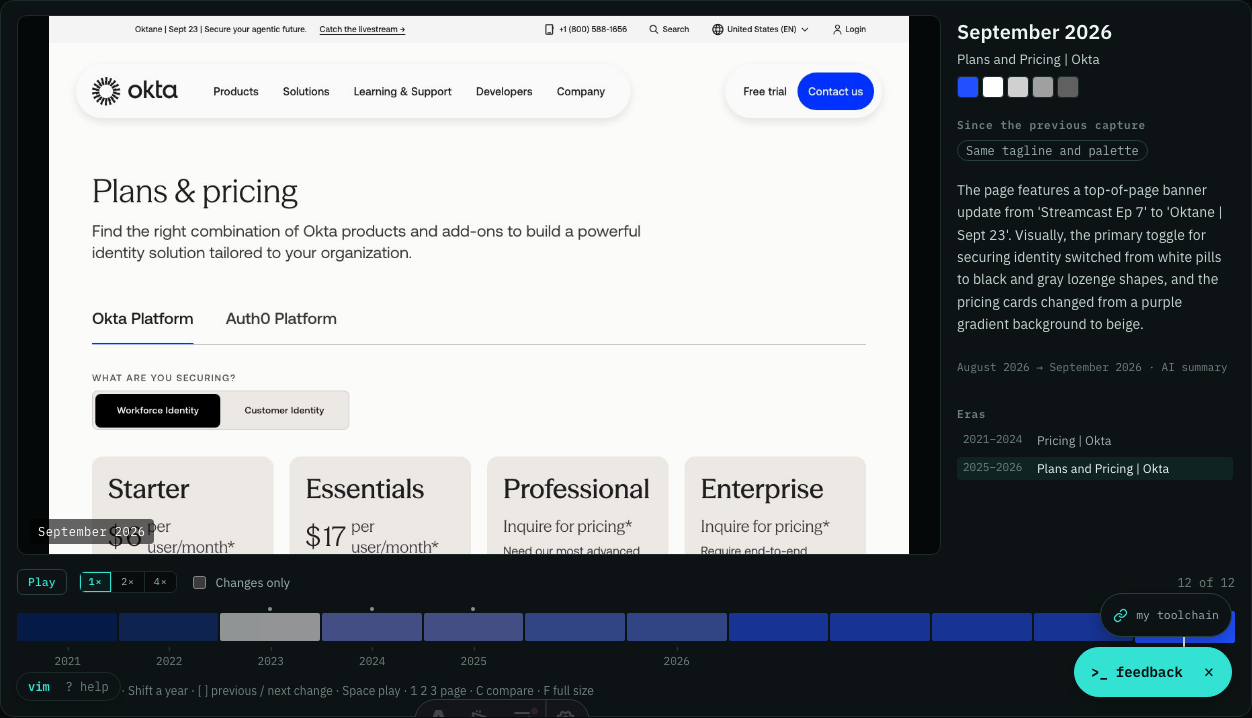
Website history now checks every vendor's home, pricing and product pages every day and keeps a new frame whenever one really changes, a new headline, new colours, a reworked layout or rewritten copy. You see a rebrand or a pricing change within about two days, dated to the day, instead of waiting weeks for an archived copy, and a rotating banner or one-day promotion never clutters the timeline.
-
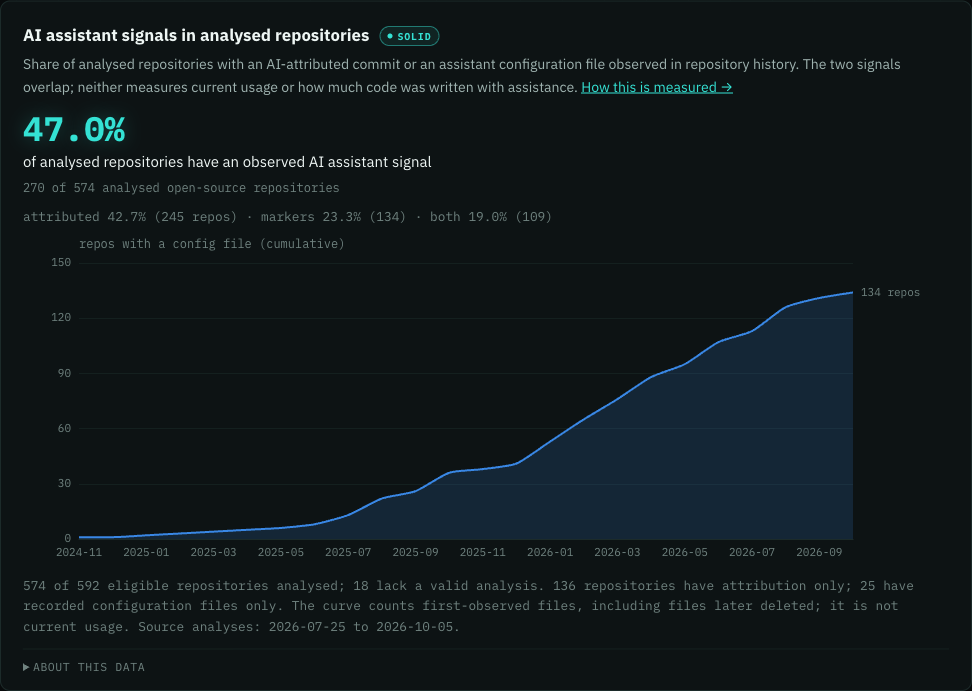
Analytics now shows a quality grade on every chart and the collection gaps behind each comparison. AI assistant signals and captured API changes earn Solid, hiring charts label carried observations, and incident charts distinguish reported activity from service uptime.
-
Follow how a vendor’s homepage, product and pricing pages change over time: switch page histories in the timeline or comparison view, with a clear note when snapshots are not available yet.
- Reply to any Toolchain email with a support question, feature request, or other feedback; your message goes directly to Jon.
- Saving account preferences and creating an API key now show the successful result even when your browser storage is full, so a saved change is not reported as lost and a new key remains available to copy.
- Newsletter retries now keep the original issue content tied to its newsletter and site. Recovered Diff issues check that their promised paid details are available before sending, so a recovery cannot silently drop those details.
- Watchlist notices now respect your email pause and unsubscribe settings, keep separate history for each site, and avoid repeating a notice when delivery confirmation is uncertain.
- Watch buttons in the New on the Toolchain email now open your Grep editor with the tool already picked, wherever you were last on your account page. Before, some readers landed on a page that would not scroll until they refreshed.
-
Understand website changes with AI summaries beside each analysed snapshot. Follow dated rebrand observations and yearly vendor and market charts; Uniq includes recent observations with before-and-after images. Possible rebrands are labeled, and coverage shows how much history has been assessed.
*
Oct 4, 2026
-
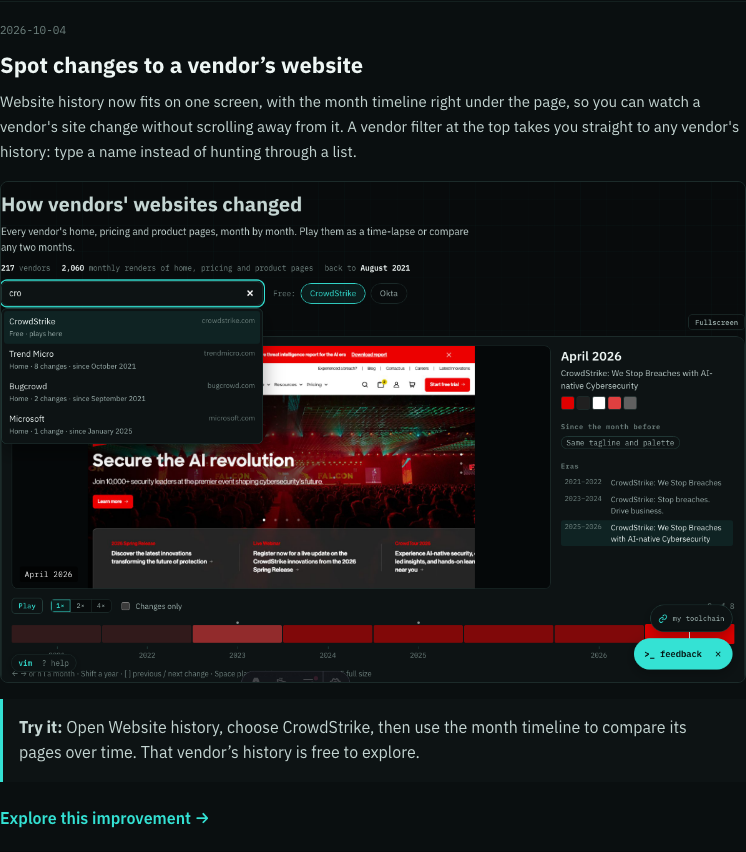
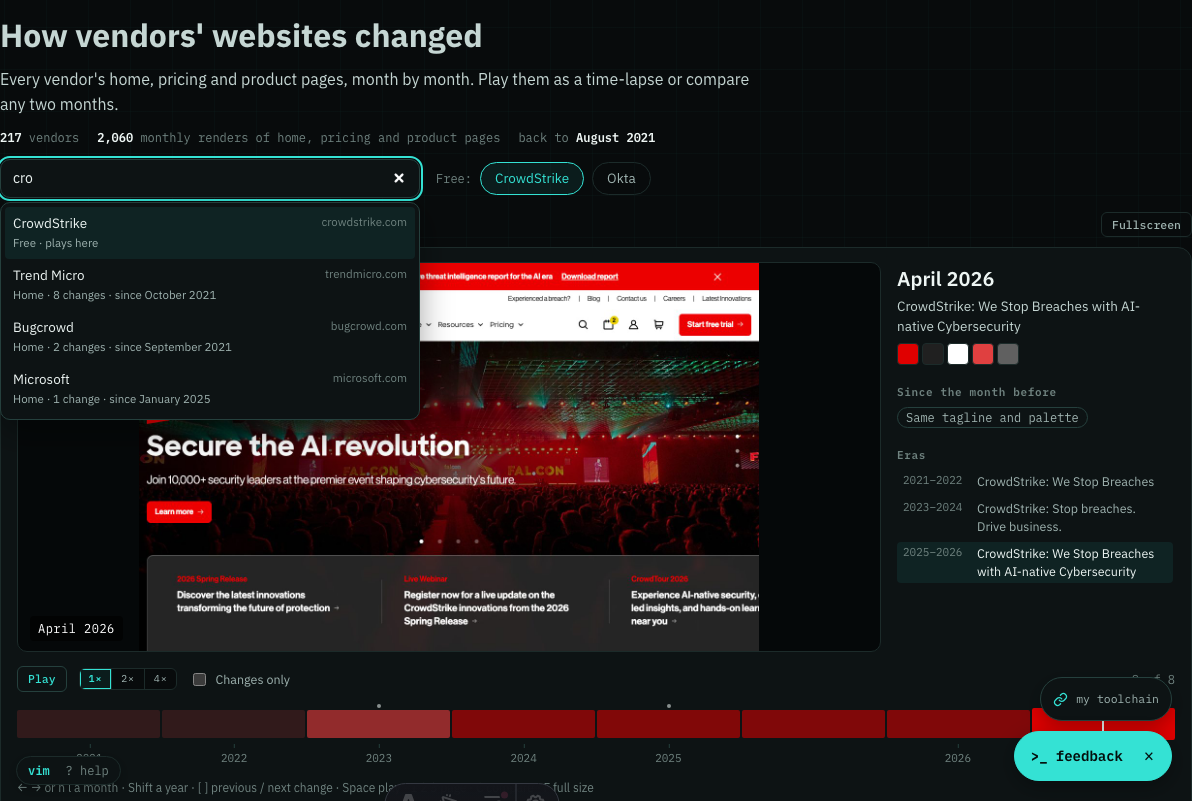
Website history now fits on one screen, with the month timeline right under the page, so you can watch a vendor's site change without scrolling away from it. A vendor filter at the top takes you straight to any vendor's history: type a name instead of hunting through a list.
-
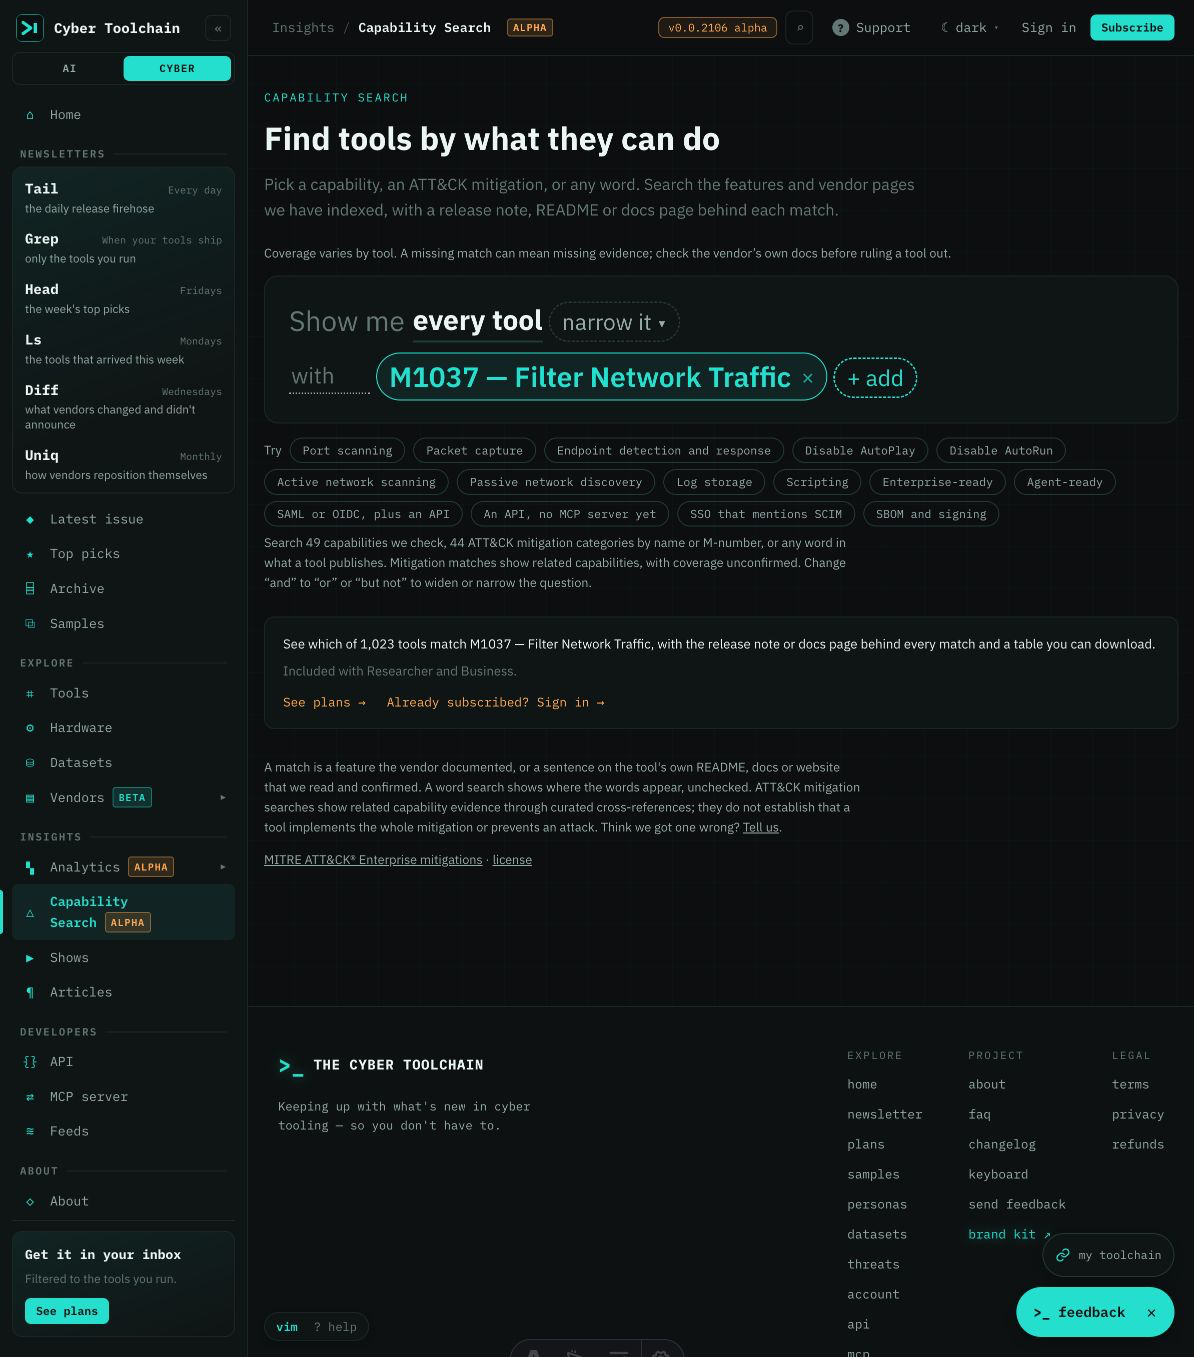
Find tools by MITRE ATT&CK mitigation, such as Vulnerability Scanning (M1016) or Filter Network Traffic (M1037). Search by name or M-number to see related documented capabilities and their sources, so you can compare products against your defensive requirements. Included with Researcher and Business.
-
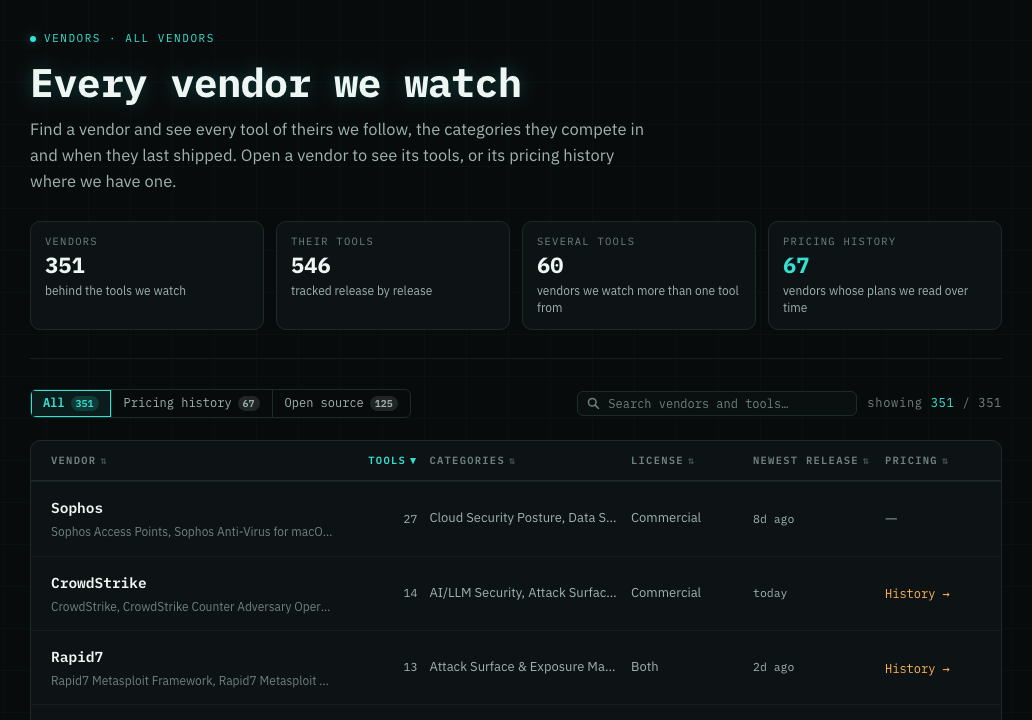
New: All vendors, under Vendors in the menu. See every vendor behind the tools we watch on one page, with how many of their tools we follow, the categories they compete in and when they last shipped, so you can size up a vendor without searching tool by tool.
-
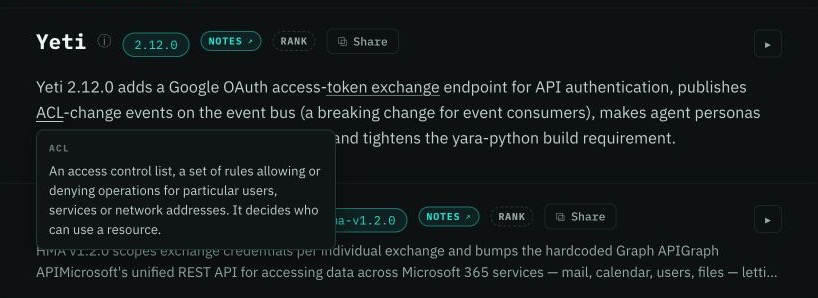
More of the terms used in our issues now have short explanations, including NTLM, CIDR, PKCE and personal access tokens. Compact issue summaries also explain terms such as ACL, so you can understand an update before opening its full details. Hover, focus or tap a dotted term to read it.
-
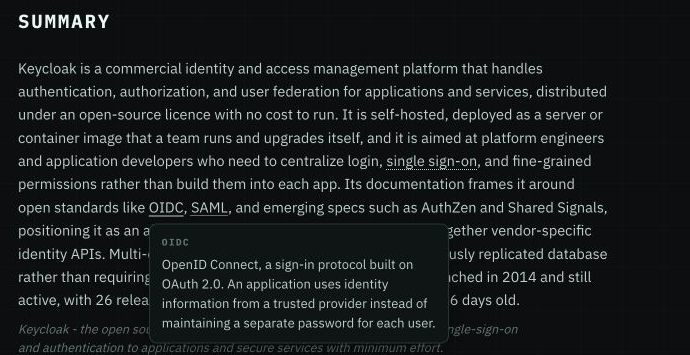
More of the terms in an issue now explain themselves, including SBOM, OIDC, EPSS and eBPF. Tool-page introductions and summaries also have these short explanations, so you can understand what a tool does without leaving the page. Hover, focus with your keyboard or tap a dotted term to read it.
-
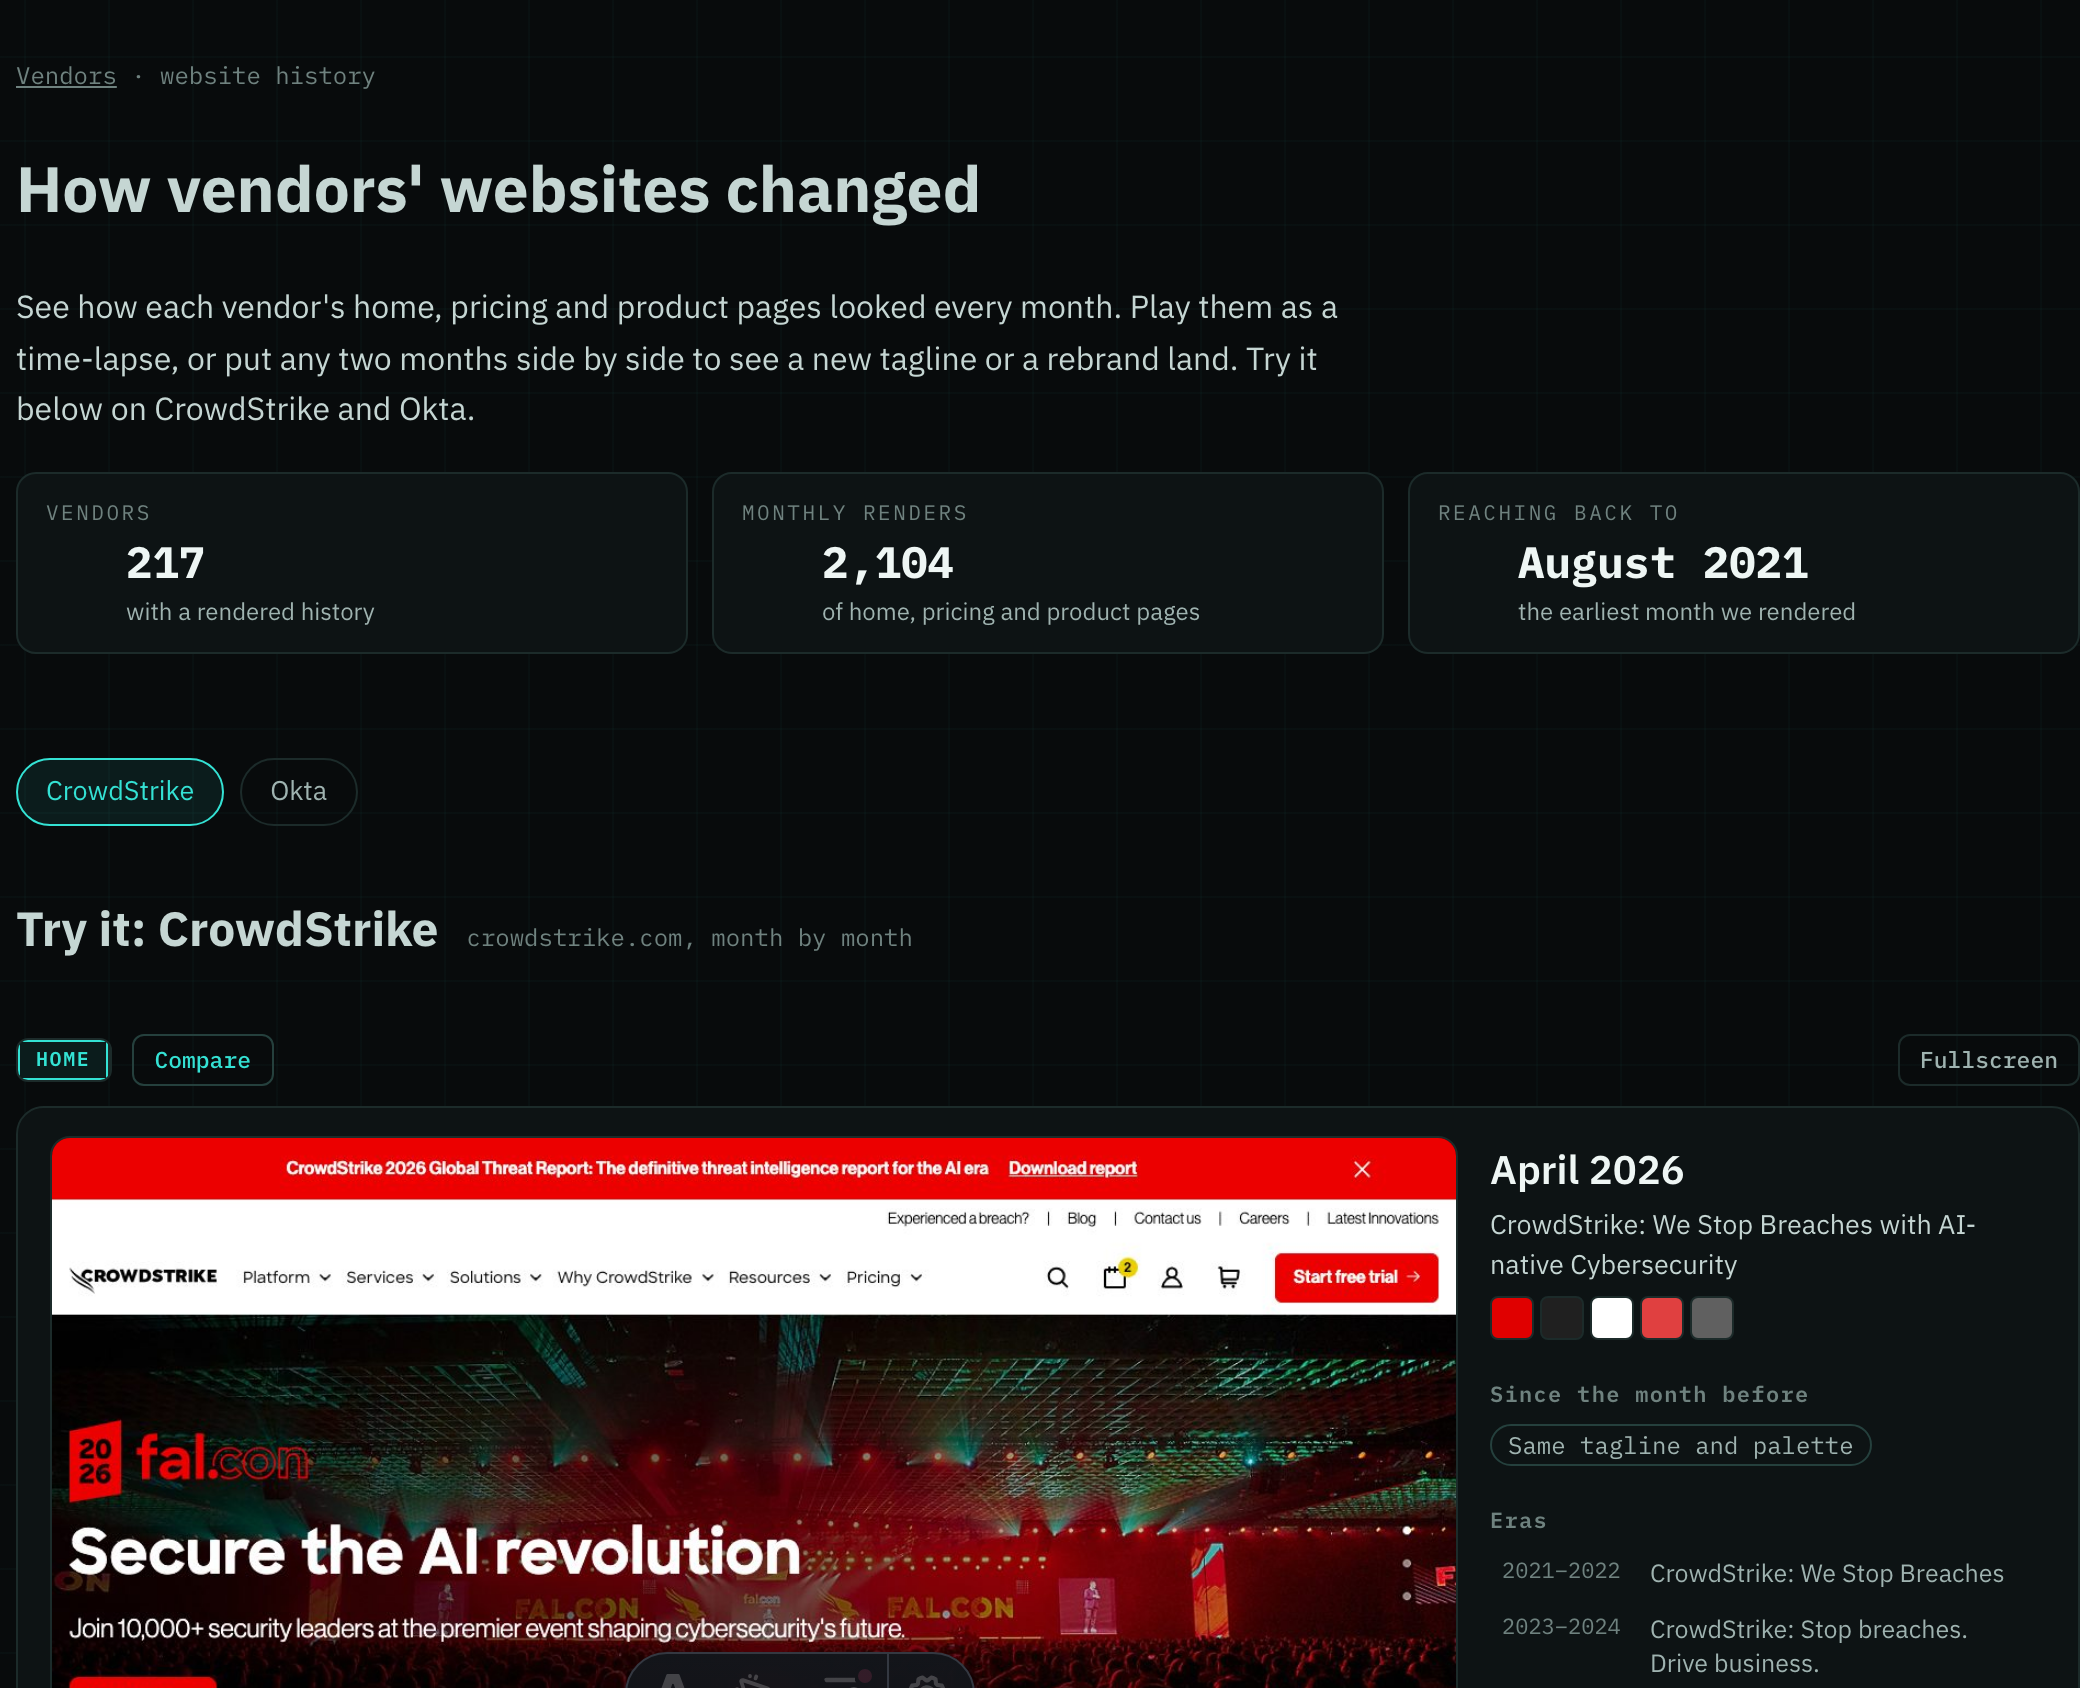
Vendors now has a Website history page. Pick any vendor to see how its home, pricing and product pages changed month by month, so you can spot a rebrand or a pricing change the month it landed. The CrowdStrike and Okta histories are free to step through, no account needed. Every other vendor's history is included with Researcher and Business.
-
Plans and samples now agree: one Grep for up to three tools is free, and paid samples take you to the plans that include them. Each product appears once in the catalog. Research pages explain what is indexed and what missing evidence means, so you can judge the coverage before subscribing.
-
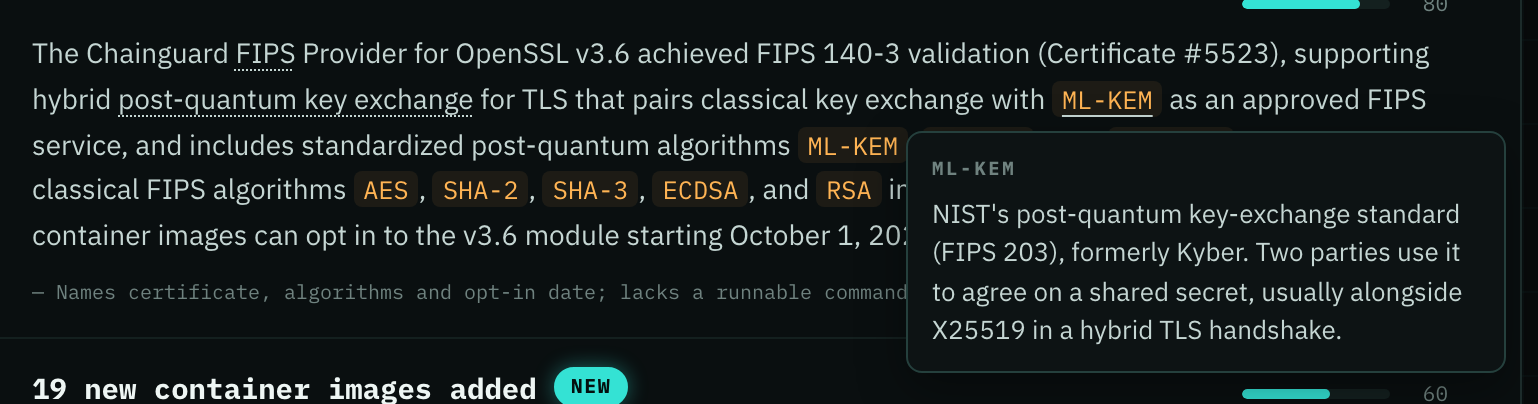
More of the technical terms in an issue now explain themselves. Algorithms like ML-KEM and ML-DSA, and standards like FIPS 140-3, carry a dotted underline wherever they appear in a tool's summary, feature list or examples, not only in the opening paragraph. Hover or tap for a sentence on what the term is, and the explanation now stays inside the card instead of being cut off at its edge.
-
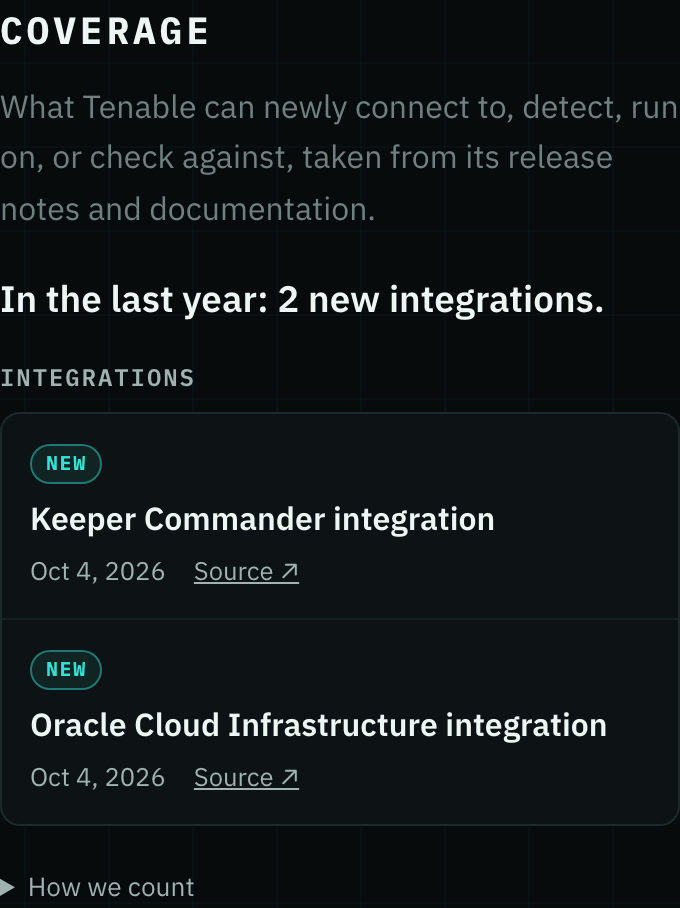
A tool's Coverage section now opens with what changed in plain words, like "In the last year: 26 new integrations", and groups each change under Integrations, Detections or Platforms with its date and source. You no longer have to work through dropdowns, a one-bar chart and repeated quotes to learn what a tool newly supports. In each release, Coverage lists the new integrations or detections by name instead of hiding them behind a count.
-
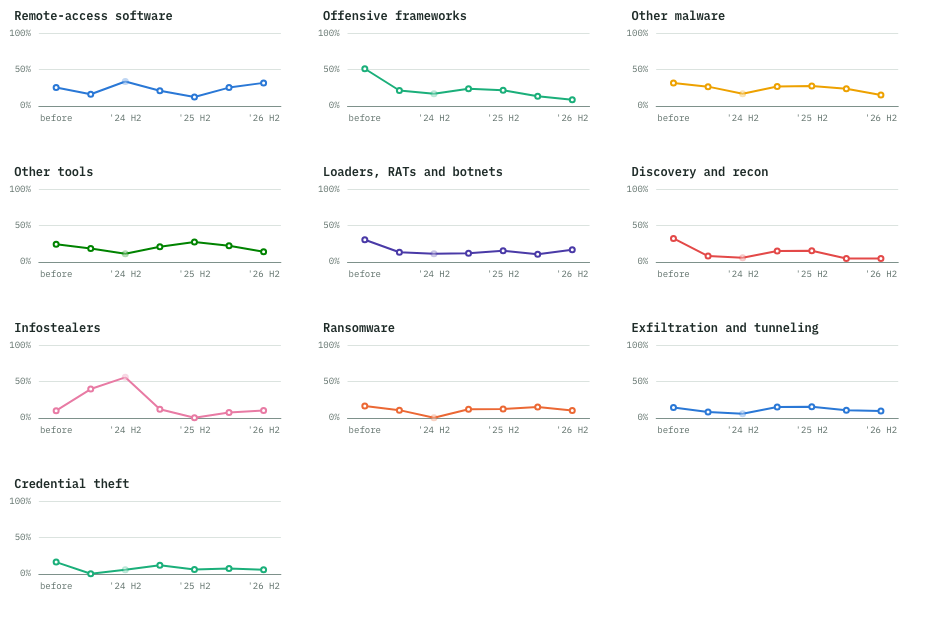
Analytics now shows which tools attackers actually use, and how that is shifting, from the attacks researchers and vendors write up. So far in the second half of 2026, remote-access software like ConnectWise and AnyDesk turns up in about three attacks in ten, more than any other kind of tool, while offensive frameworks are down to fewer than one in ten. A table lists the most-used tools of the last 12 months, and a checkbox adds Windows built-ins like cmd and PowerShell.
-
Opening Uniq from the menu now takes you straight to your latest issue, with no sample flashing up first. The issue also opens inside the site, with the menu and your chosen theme, instead of as a bare email page.
- Corrected tool descriptions that started with lowercase letters.
- Capability Search understands more capability names, including port scanning, packet capture, EDR, AutoPlay, AutoRun, active and passive discovery, log storage and scripting. Results distinguish confirmed capability evidence from mentions, and an unassessed capability does not count as missing.
- Threat coverage uses verified techniques and checks that product-specific content applies to the threat. A report that only mentions a tool is listed separately from documented use in an attack, and response content we have not indexed is shown as unknown.
- Capability search's "but not" now leaves a tool out when anything it publishes mentions what you asked to exclude, even unconfirmed. Tools we hold too few features for are no longer listed as if they passed, so the list you get is one you can trust to lack it.
- Articles on a tool page are cleaner. A vendor's own blog or lab no longer counts as an outside article about its own tools, headlines keep their acronyms (CVE, not Cve), and an article with a date in the future shows no date rather than a wrong one.
- On the score card compare page, the tool list now closes when you press Escape or click anywhere else, so the score cards you picked are right there to read instead of hidden under the list.
- Billing settings now require the email address used for payment. Refunds update the account that received the subscription, even when its sign-in address differs from the billing address.
- Release and documentation history is saved safely when jobs run at the same time. Interrupted email sends are held for review to prevent duplicate issues. If our scraping protection blocks you by mistake, the block page now gives you a working support address.
- Website history now shows only the vendor's own site. Snapshots from before a vendor owned its domain, parked pages, bot checks and pages that failed to load are left out of the timeline and Then & Now.
- Capability searches now separate MITRE D3FEND defensive techniques from general analytics methods, reducing unrelated matches. Defense references distinguish framework guidance from evidence about a specific tool.
- Switching to The AI Toolchain from a newsletter issue or the vendors page now takes you to the same series or the vendors page there, instead of dropping you on the newest Tail issue or the home page.
- Head test emails now link to the exact published issue, so you can move from the inbox preview to the full edition on the website.
*
Oct 3, 2026
-
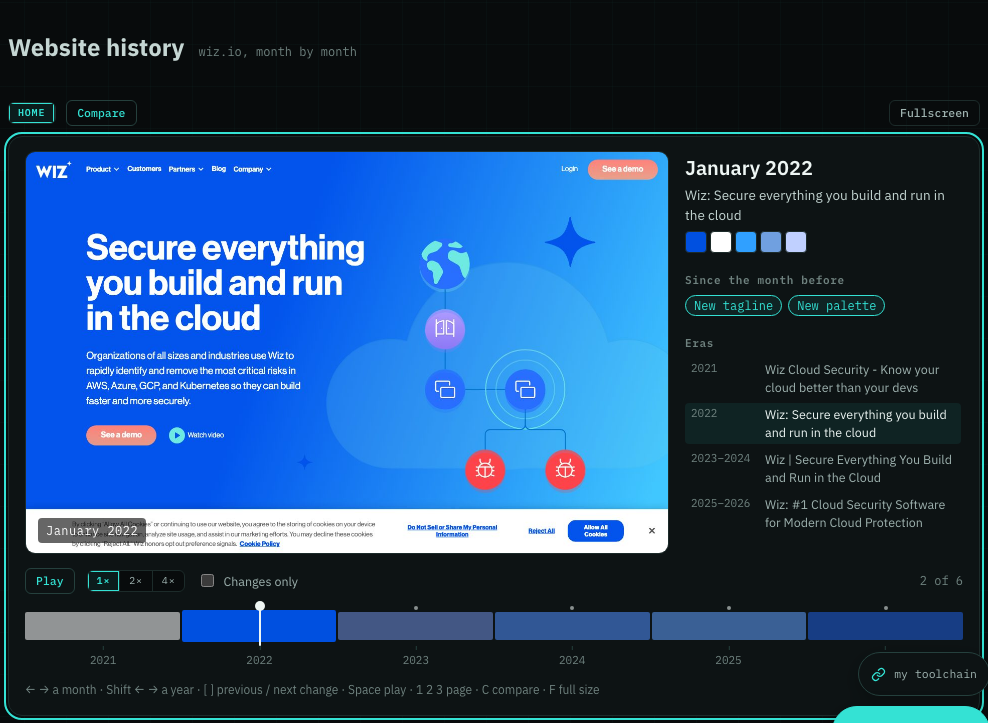
See how every vendor's home, pricing and product pages have looked month by month since 2021, and step through the years from your keyboard. Included with Researcher and Business.
-
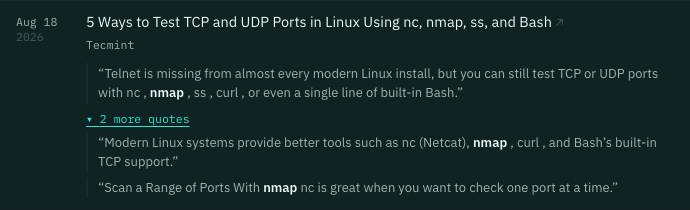
Articles on a tool page now quote the article itself. Each row shows the sentence where the article names the tool, with the name in bold, and a click on "more quotes" shows up to two more. You can tell what an article says about the tool before you open it.
-
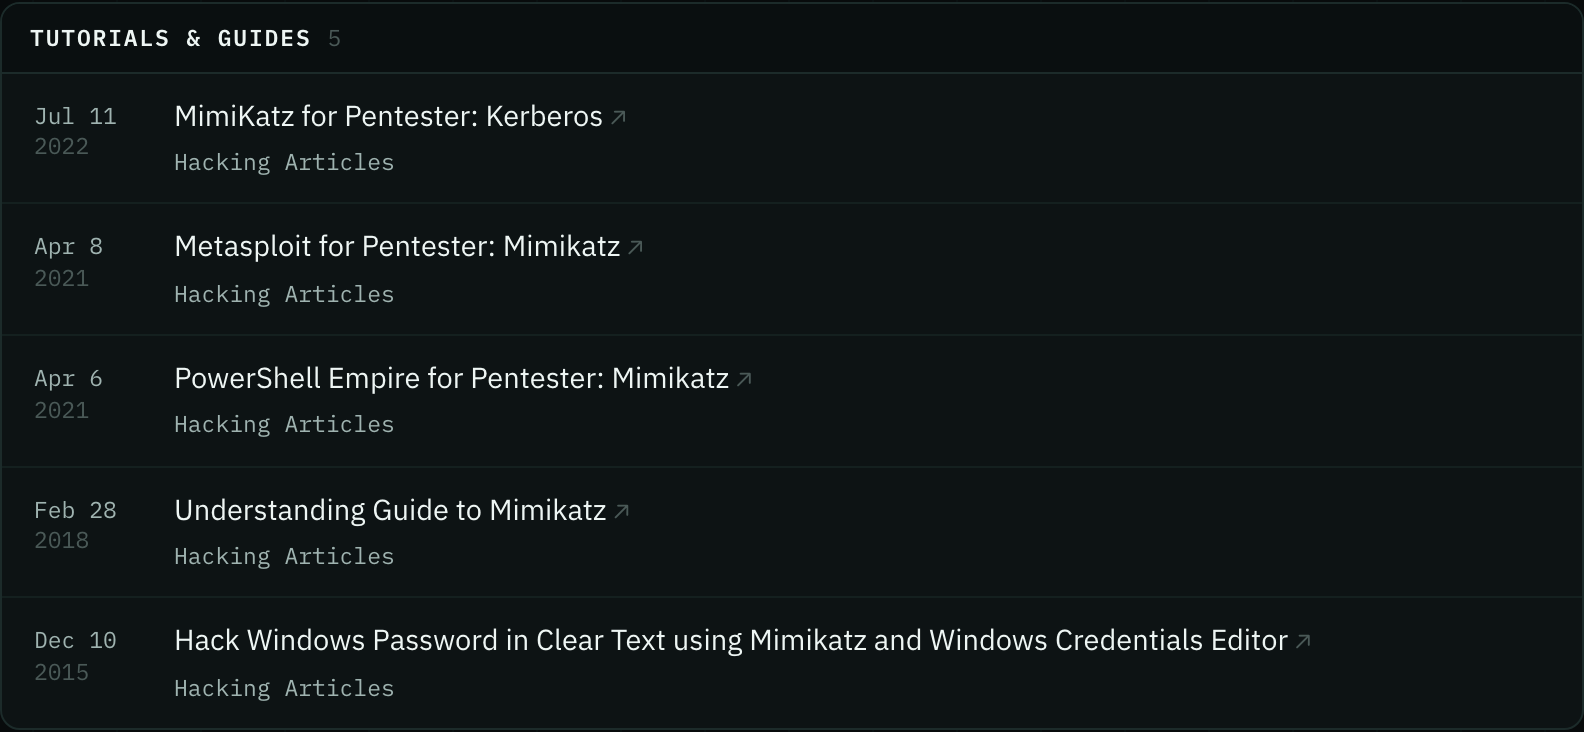
Tool pages are easier to scan. Articles now list each one by its real headline with the date in its own column, so you can see at a glance what is recent. Threat coverage leads with three counts, and each threat shows the CVE or technique it matched and the content that covers it. On the command line view, "new in" next to an option is now a link that opens that release's changes.
-
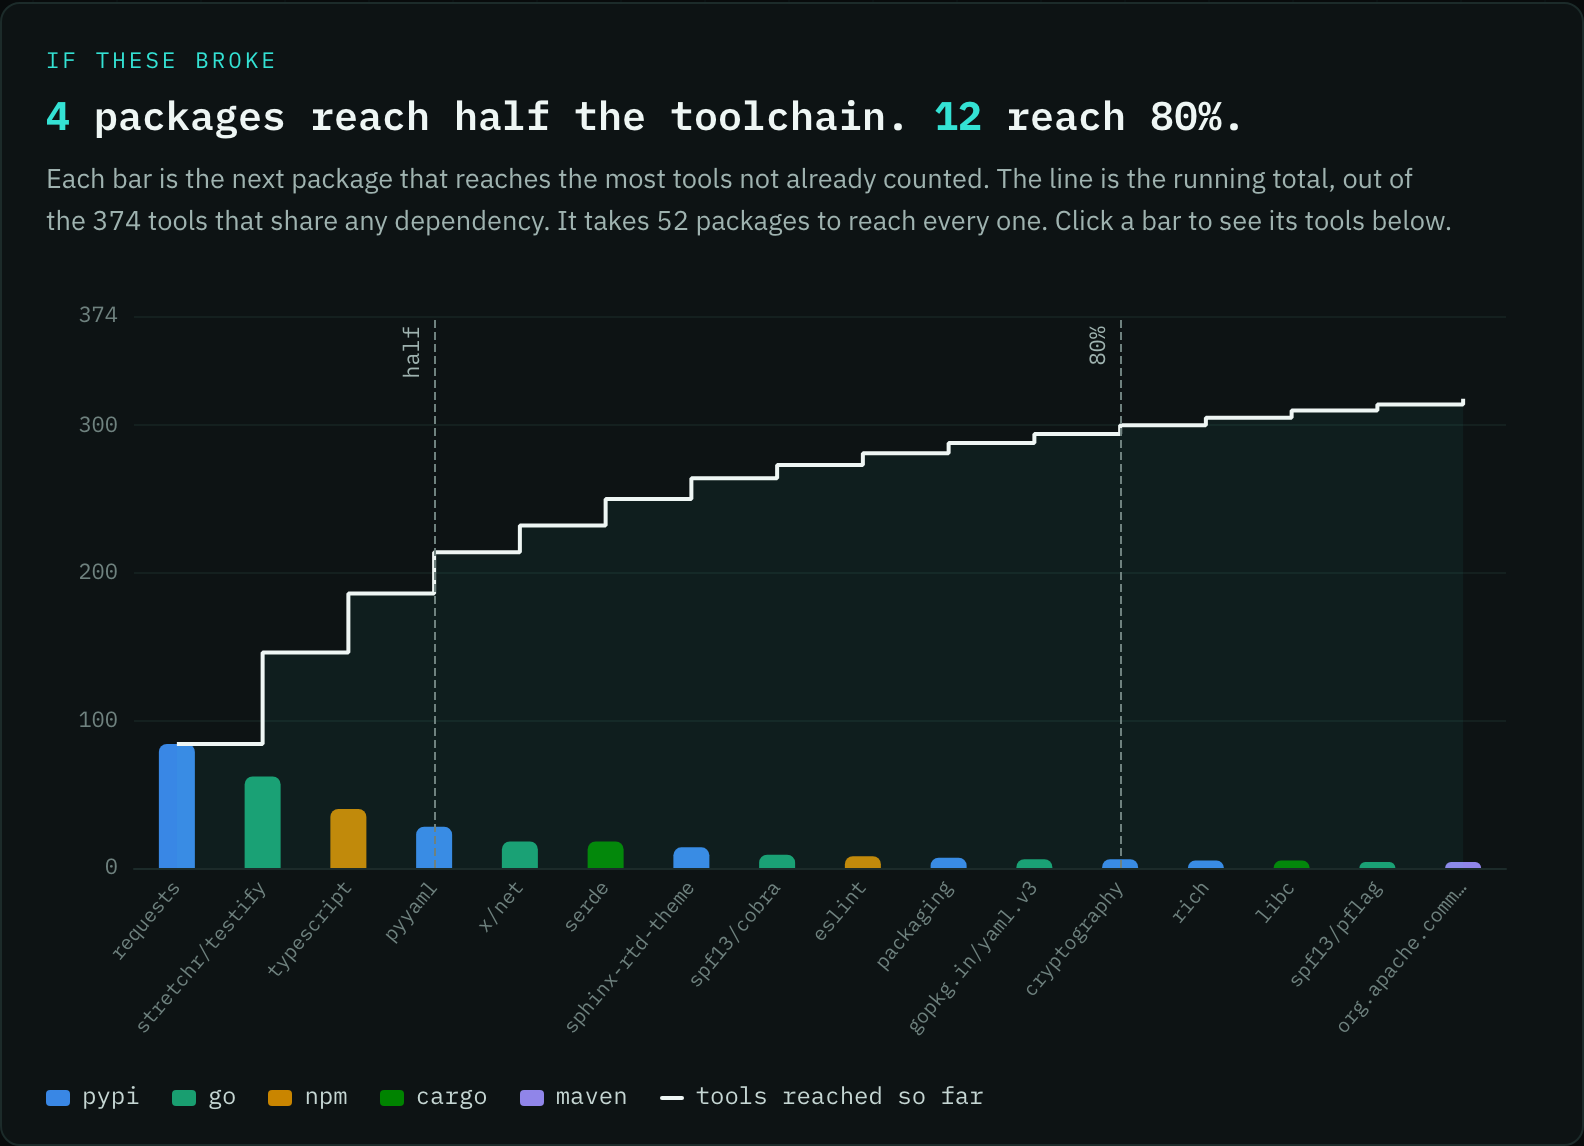
The Supply chain page now opens with a chart of how few packages reach most of the cyber tools we track: four packages touch half of them and twelve touch 80%. Each bar is the dependency that would hit the most remaining tools if it broke, and the line counts how many are reached so far. Click a bar to list the tools that use that package.
-
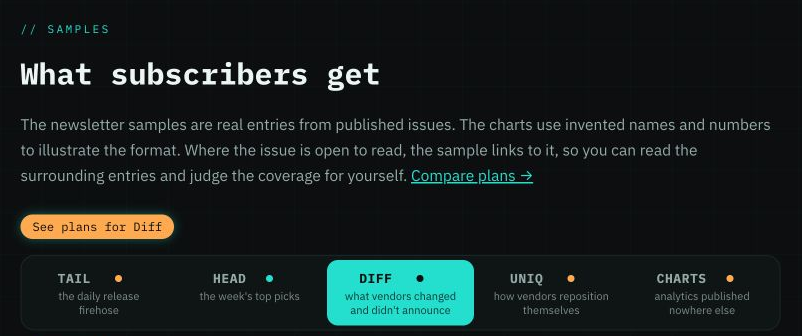
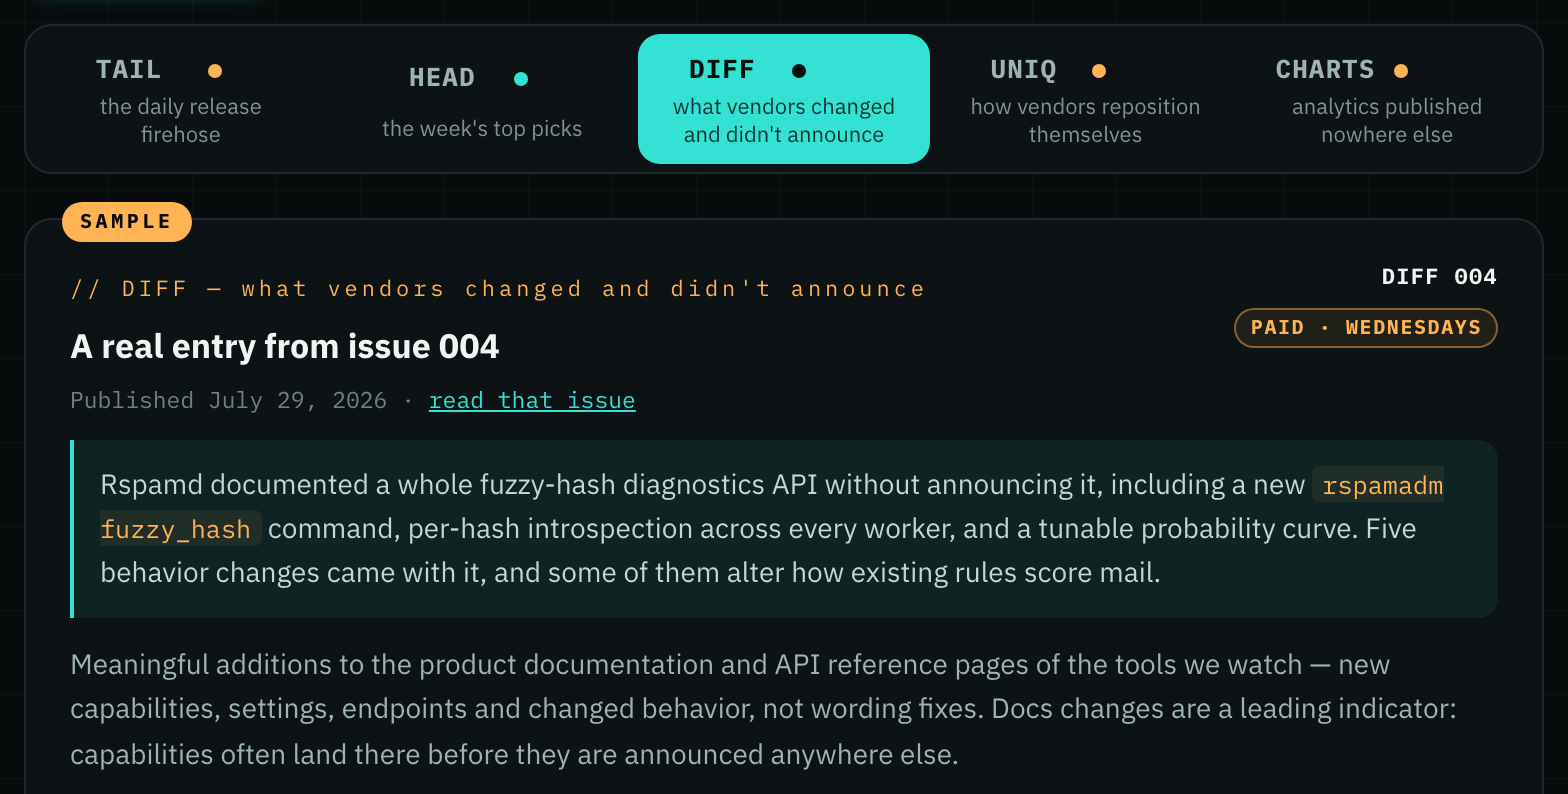
The samples page now shows one sample at a time. Pick Tail, Head, Diff, Uniq or Charts from the tabs at the top and read just that one, instead of scrolling past every other sample to find it. Each sample has its own link, so you can send someone straight to the one you mean.
-
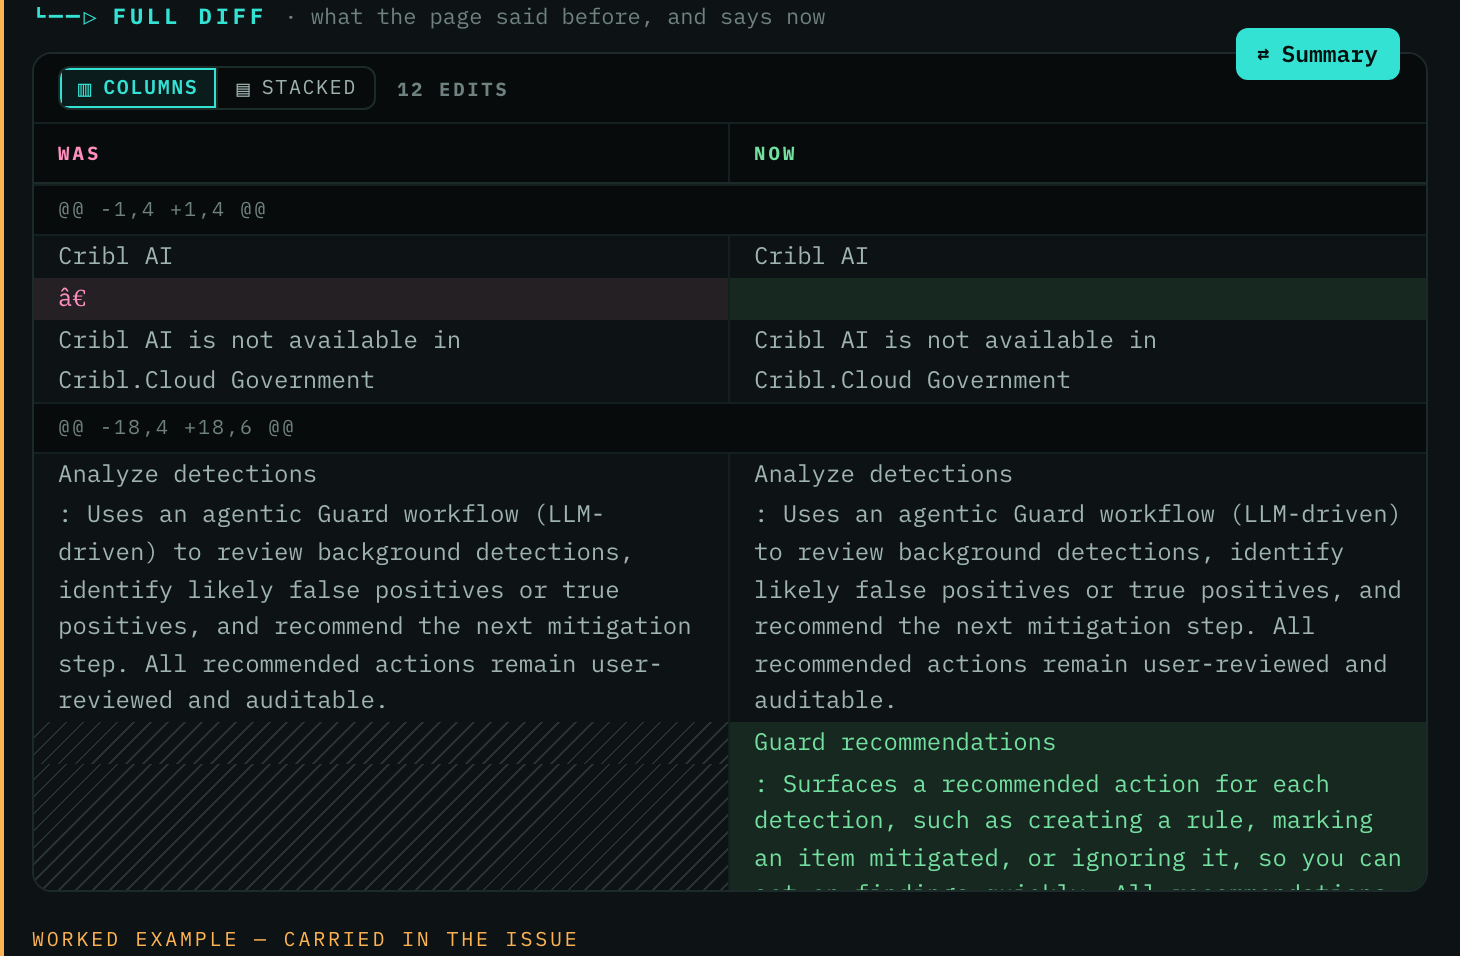
The Diff sample on the samples page now opens on the full diff, so the first thing you see is the documentation itself changing, line by line. It also has a better example: Cribl quietly documented an MCP server for Cribl AI and a new Guard recommendations feature, with no release post to announce either.
-
The Uniq sample now shows how vendors changed their pricing, not only how they describe themselves. You can see Dradis Framework drop its published prices for a single quote-only plan, and CrowdStrike add a free trial, each with the plans that appeared and disappeared.

-
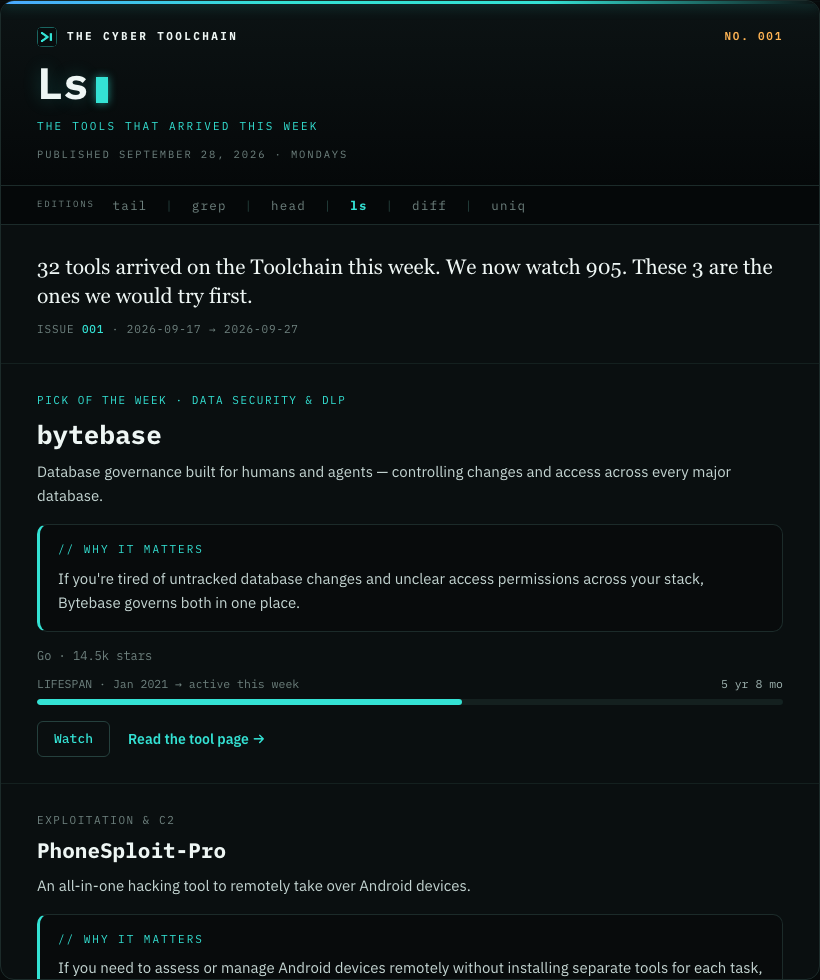
New on the Toolchain issues now open as a proper page on the site, with the same masthead, edition switcher and layout as Tail and Head. Before, the page showed the email as it was mailed, so it looked out of place and was hard to read on a phone. Each pick links to its tool page, and Watch adds it to Your Tools in one click.
-
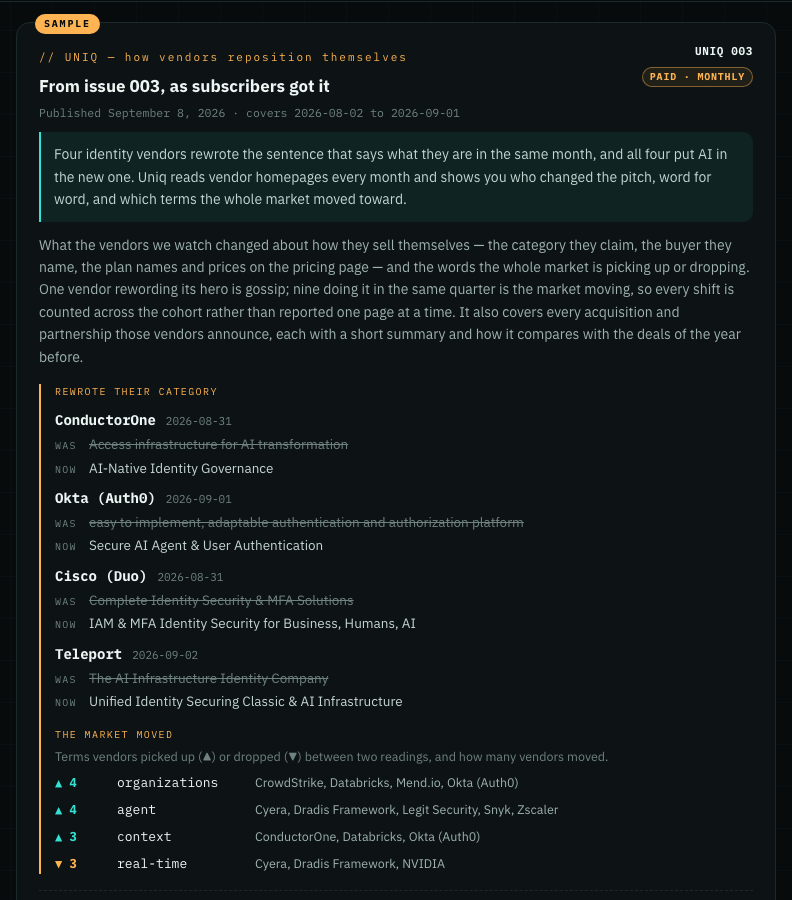
The samples page now shows Uniq, taken from a real issue: four identity vendors rewriting how they describe themselves, word for word, and the terms the market moved toward that month. It also appears on the Uniq page and in the plans dialog. Every sample now carries a Sample tag, so you can tell a past issue from the newest one at a glance.
-
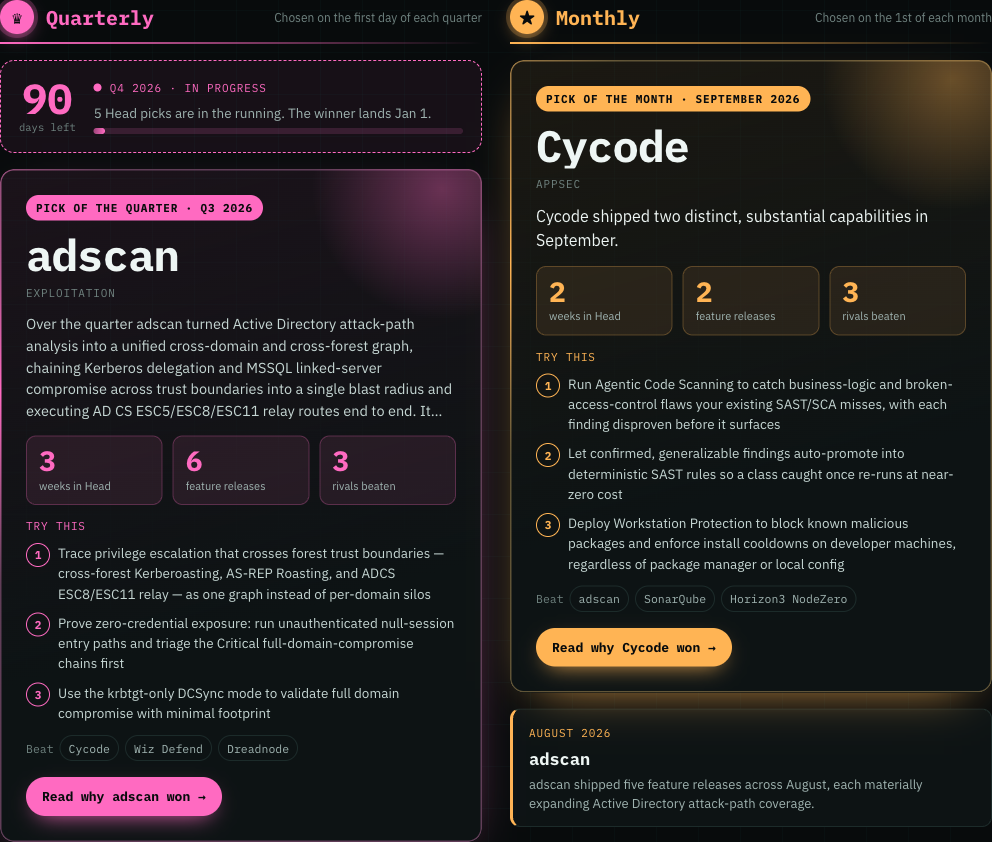
Top picks now puts the winners up front instead of in a list. The newest pick of the quarter and pick of the month each get a full card with why it won, how long it held a Head spot, the rivals it beat and three things to try, with last period’s pick just below. A countdown shows how many days are left in the current quarter and how many Head picks are in the running, so you can see the next winner taking shape. Every earlier pick is one click away at the bottom.
-
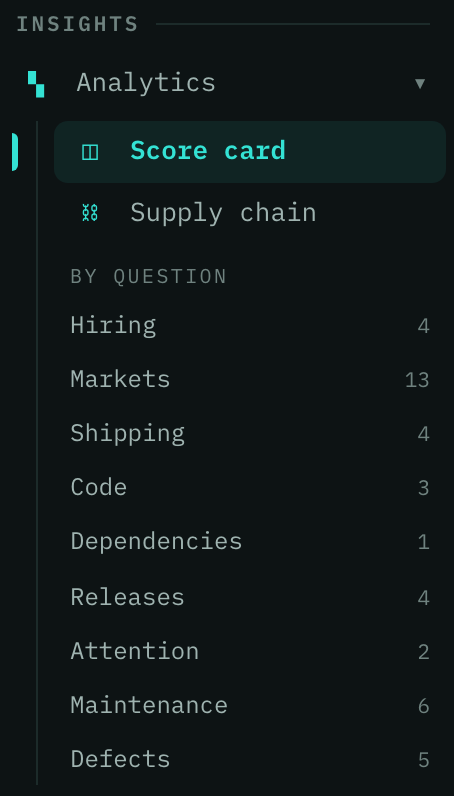
Score card and Supply chain now sit under Analytics in the left-hand menu, with every question the charts answer listed below them: hiring, markets, shipping, code and the rest, each with how many charts it holds. Pick one and the analytics page opens filtered to just those charts, so you can go straight to the question you came with instead of scrolling the whole page. The menu opens with a click and stays open as you move around the site.
-
The vendors page now opens with a chart of how often cyber tool vendors change their pricing, quarter by quarter, and which way list prices move when they do. Right now that is about two in three vendors every quarter, and price changes mostly go up: 12 rises against 6 cuts. On the analytics page, two new market charts show how many vendors still put a price on every plan and which months the market reprices most, so you can time a renewal or a pricing review against what everyone else is doing.
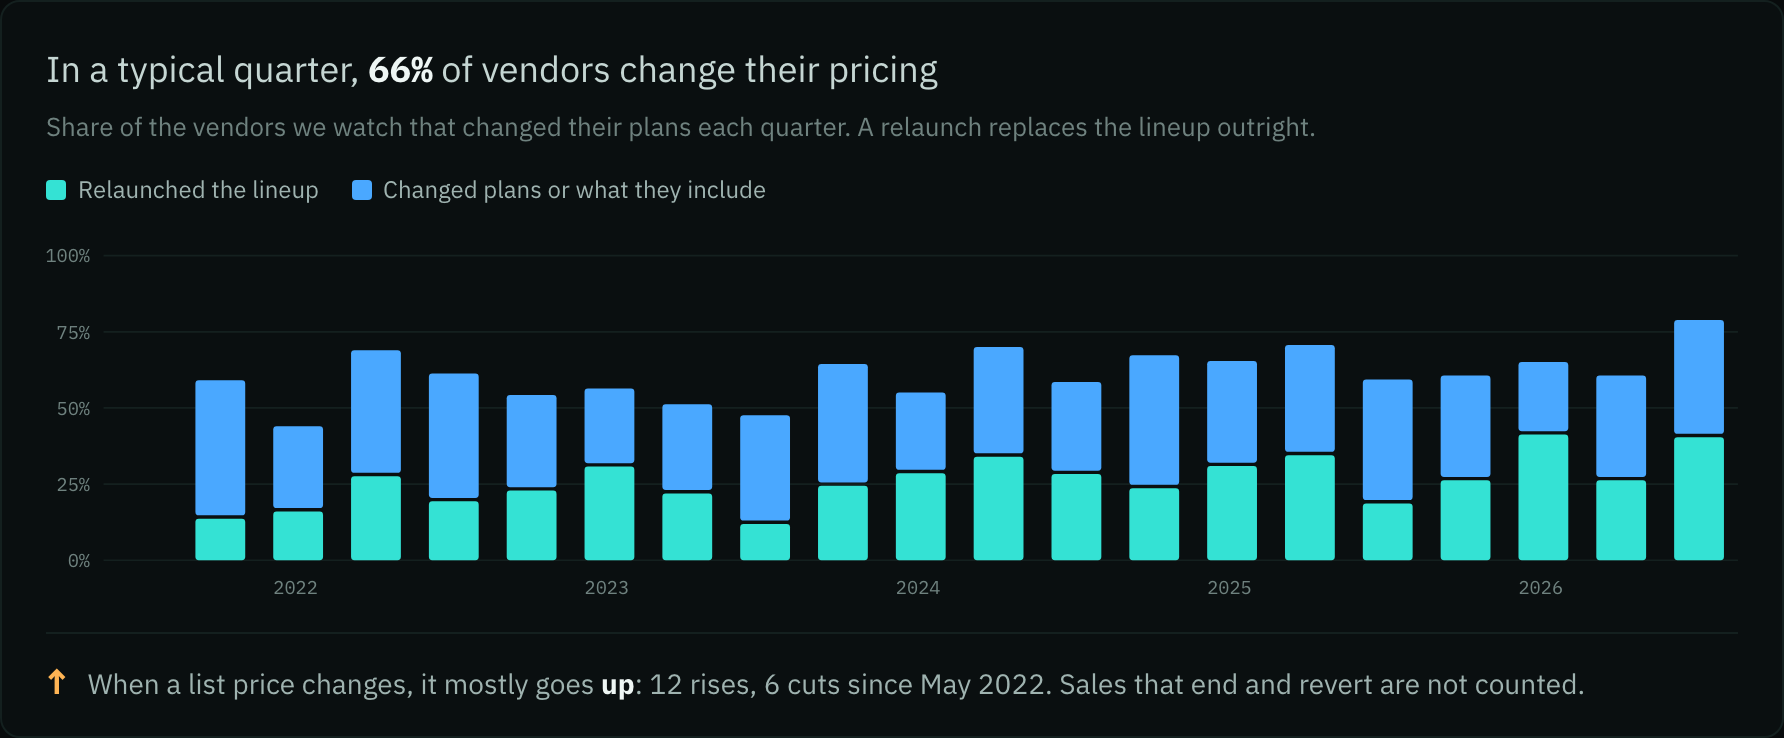
-
The Tools page now opens with a chart of how much the watchlist shipped each week over the last year, so you can tell at a glance whether the latest week was busy or quiet. Hover any week to see its releases and how many tools shipped. The cards underneath compare the latest week with the four before it and show how the watchlist has grown.
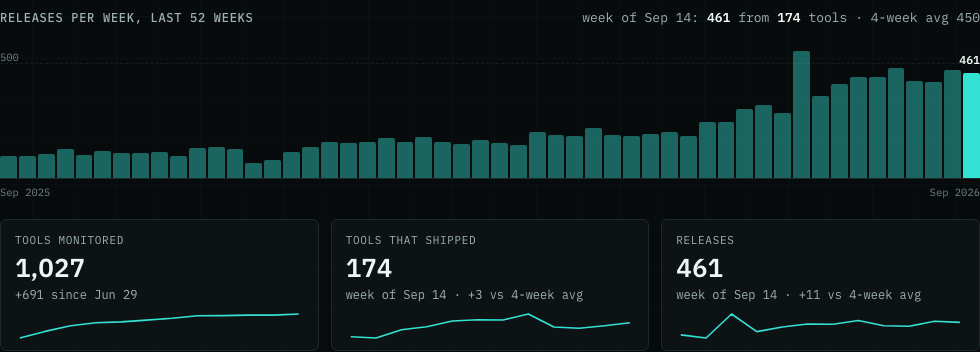
-
The test datasets page now opens with a chart of how many datasets there are of each type, from vulnerable targets to packet captures, with the ones that contain live malware hatched. You can see what is on offer before you scroll, and click any bar to show only that type in the table. Click it again to see everything.
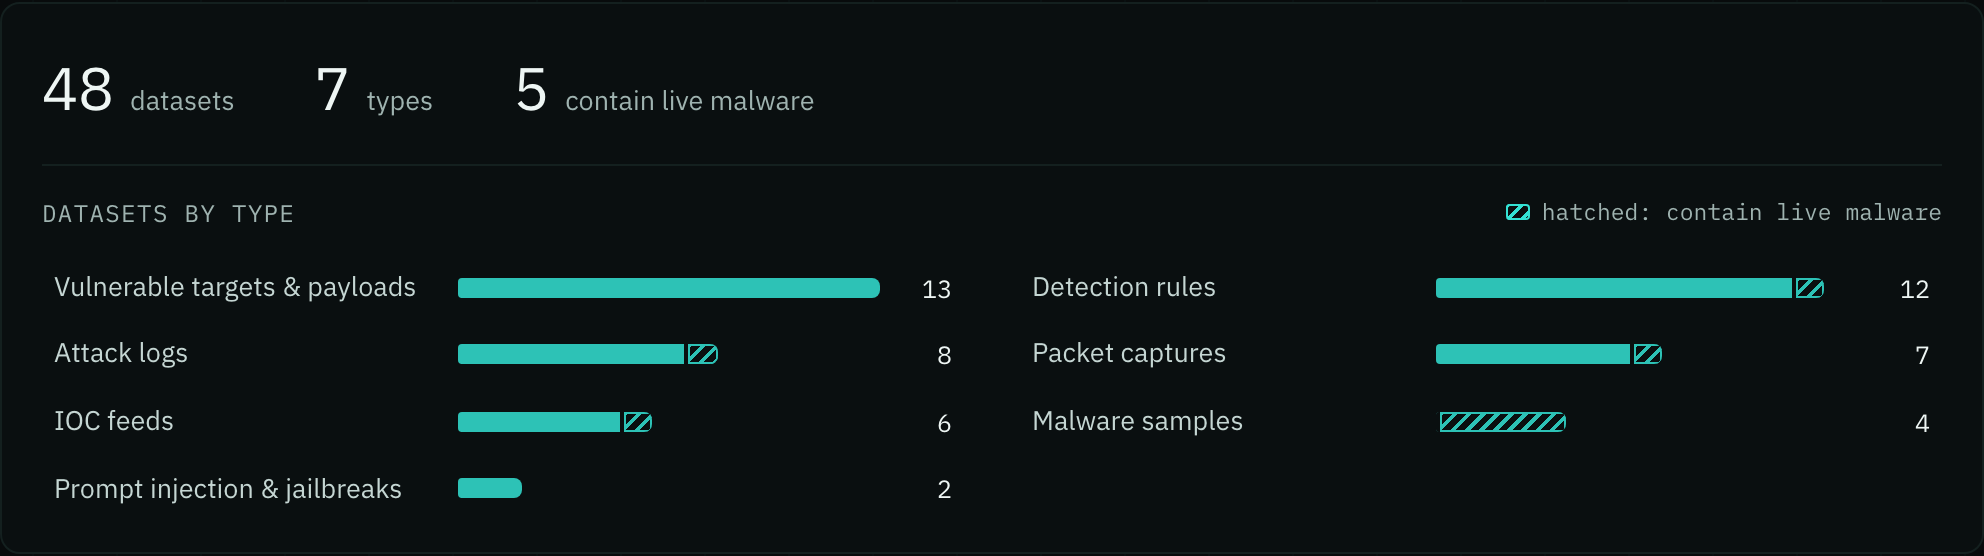
-
Click any newsletter in the left-hand menu to land where you meant to go. Tail, Head and Ls open their newest issue. Diff, Grep and Uniq open their own page, which says when each one arrives and which plan includes it, with a real sample where we have one. If your plan already includes it, you go straight to your newest issue.
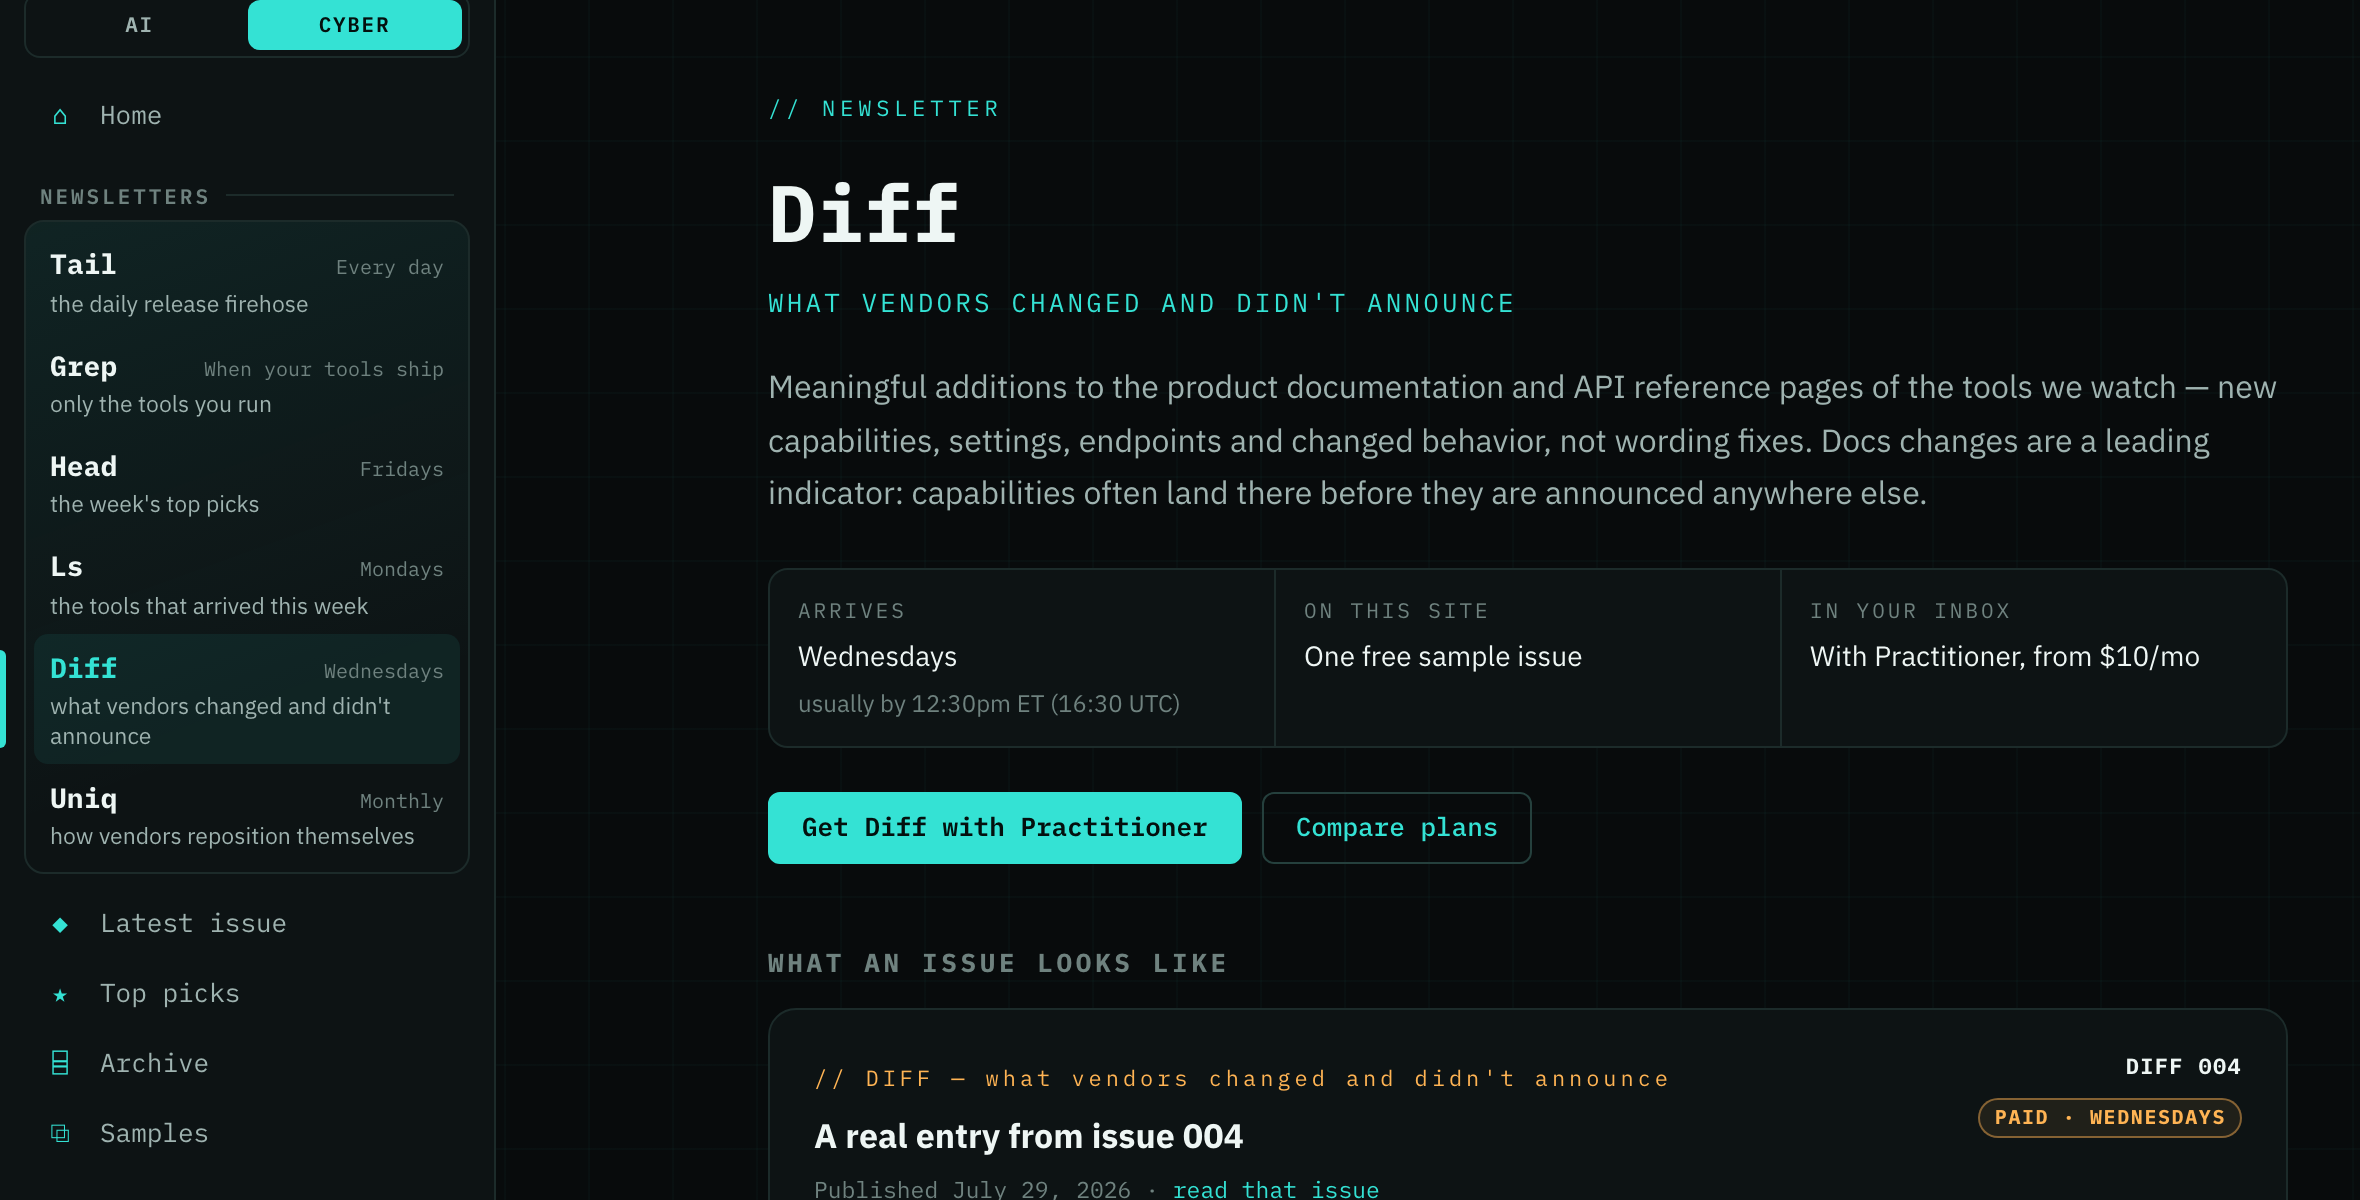
-
Every table on the site now filters the same way: click a column heading to filter by it. On the vendors page, click Vendor to find a vendor or any of its tools. In the newsletter archive, click Issue to find an issue by name, or Inside to pick a tool and see every issue that covered it, busiest first. Each filter shows as a chip above the table, the heading turns teal while it is set, and clicking the chip clears it, just as on the tools and datasets pages.
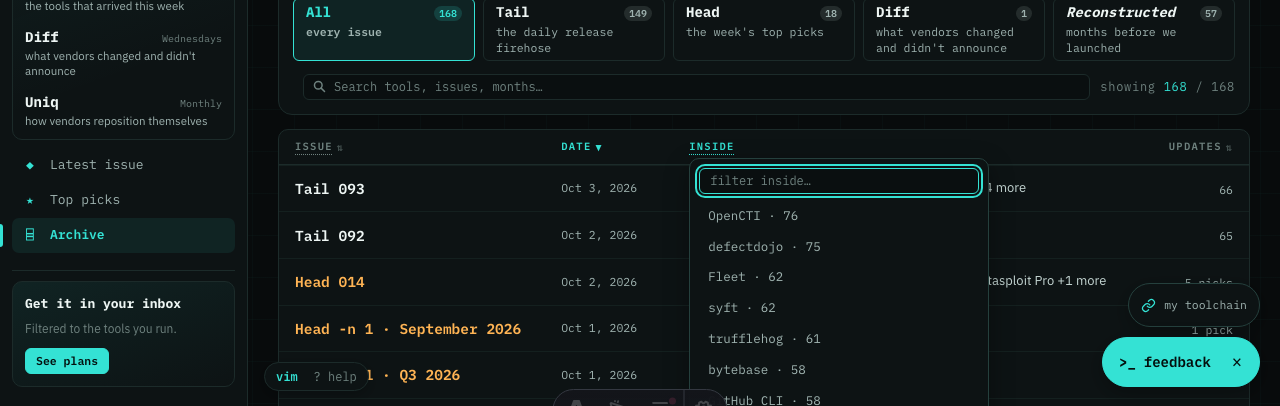
-
The top of the threats page now shows two charts for the CVEs being exploited right now. Defense gap shows how many have a check, rule or module written for that exact CVE, how many have nothing at all, and where the gaps sit from discovery to detection. Time to first defense shows how long after CISA listed each one a tracked cyber tool first named it. You can see at a glance whether the tools you rely on keep up with what attackers are using, and switch both charts between the last 90 days and the last year.
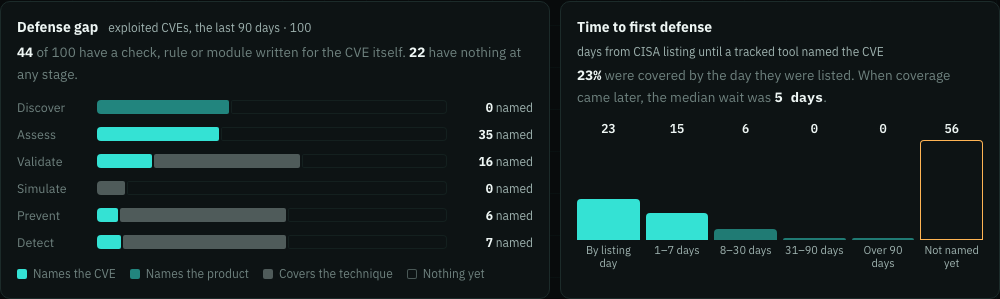
-
The newsletters now sit at the top of the left-hand menu, always open, each with a line on what it covers and the day it arrives, so you can pick the one you want without opening a submenu. The series you are reading is highlighted, and Latest issue no longer lights up when you are on the archive or top picks.
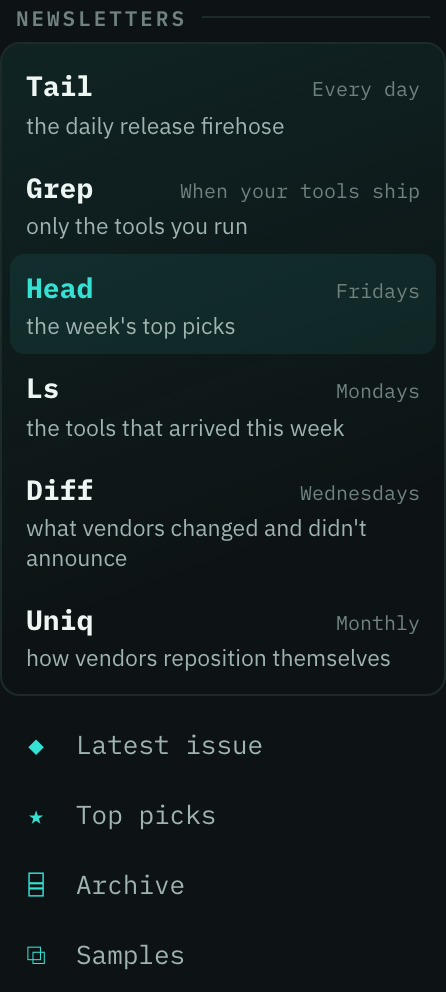
-
Capability gaps is now Capability Search. Ask for the capabilities you need, or any word, join them with “or” and “but not”, and search every cyber tool we follow at once instead of one category at a time. Each match shows where the vendor says it, with a link, so you can check it yourself before you shortlist a tool. Click a row to see every piece of proof for that tool. Old capability gaps links still open your question. Included with Researcher and Business.
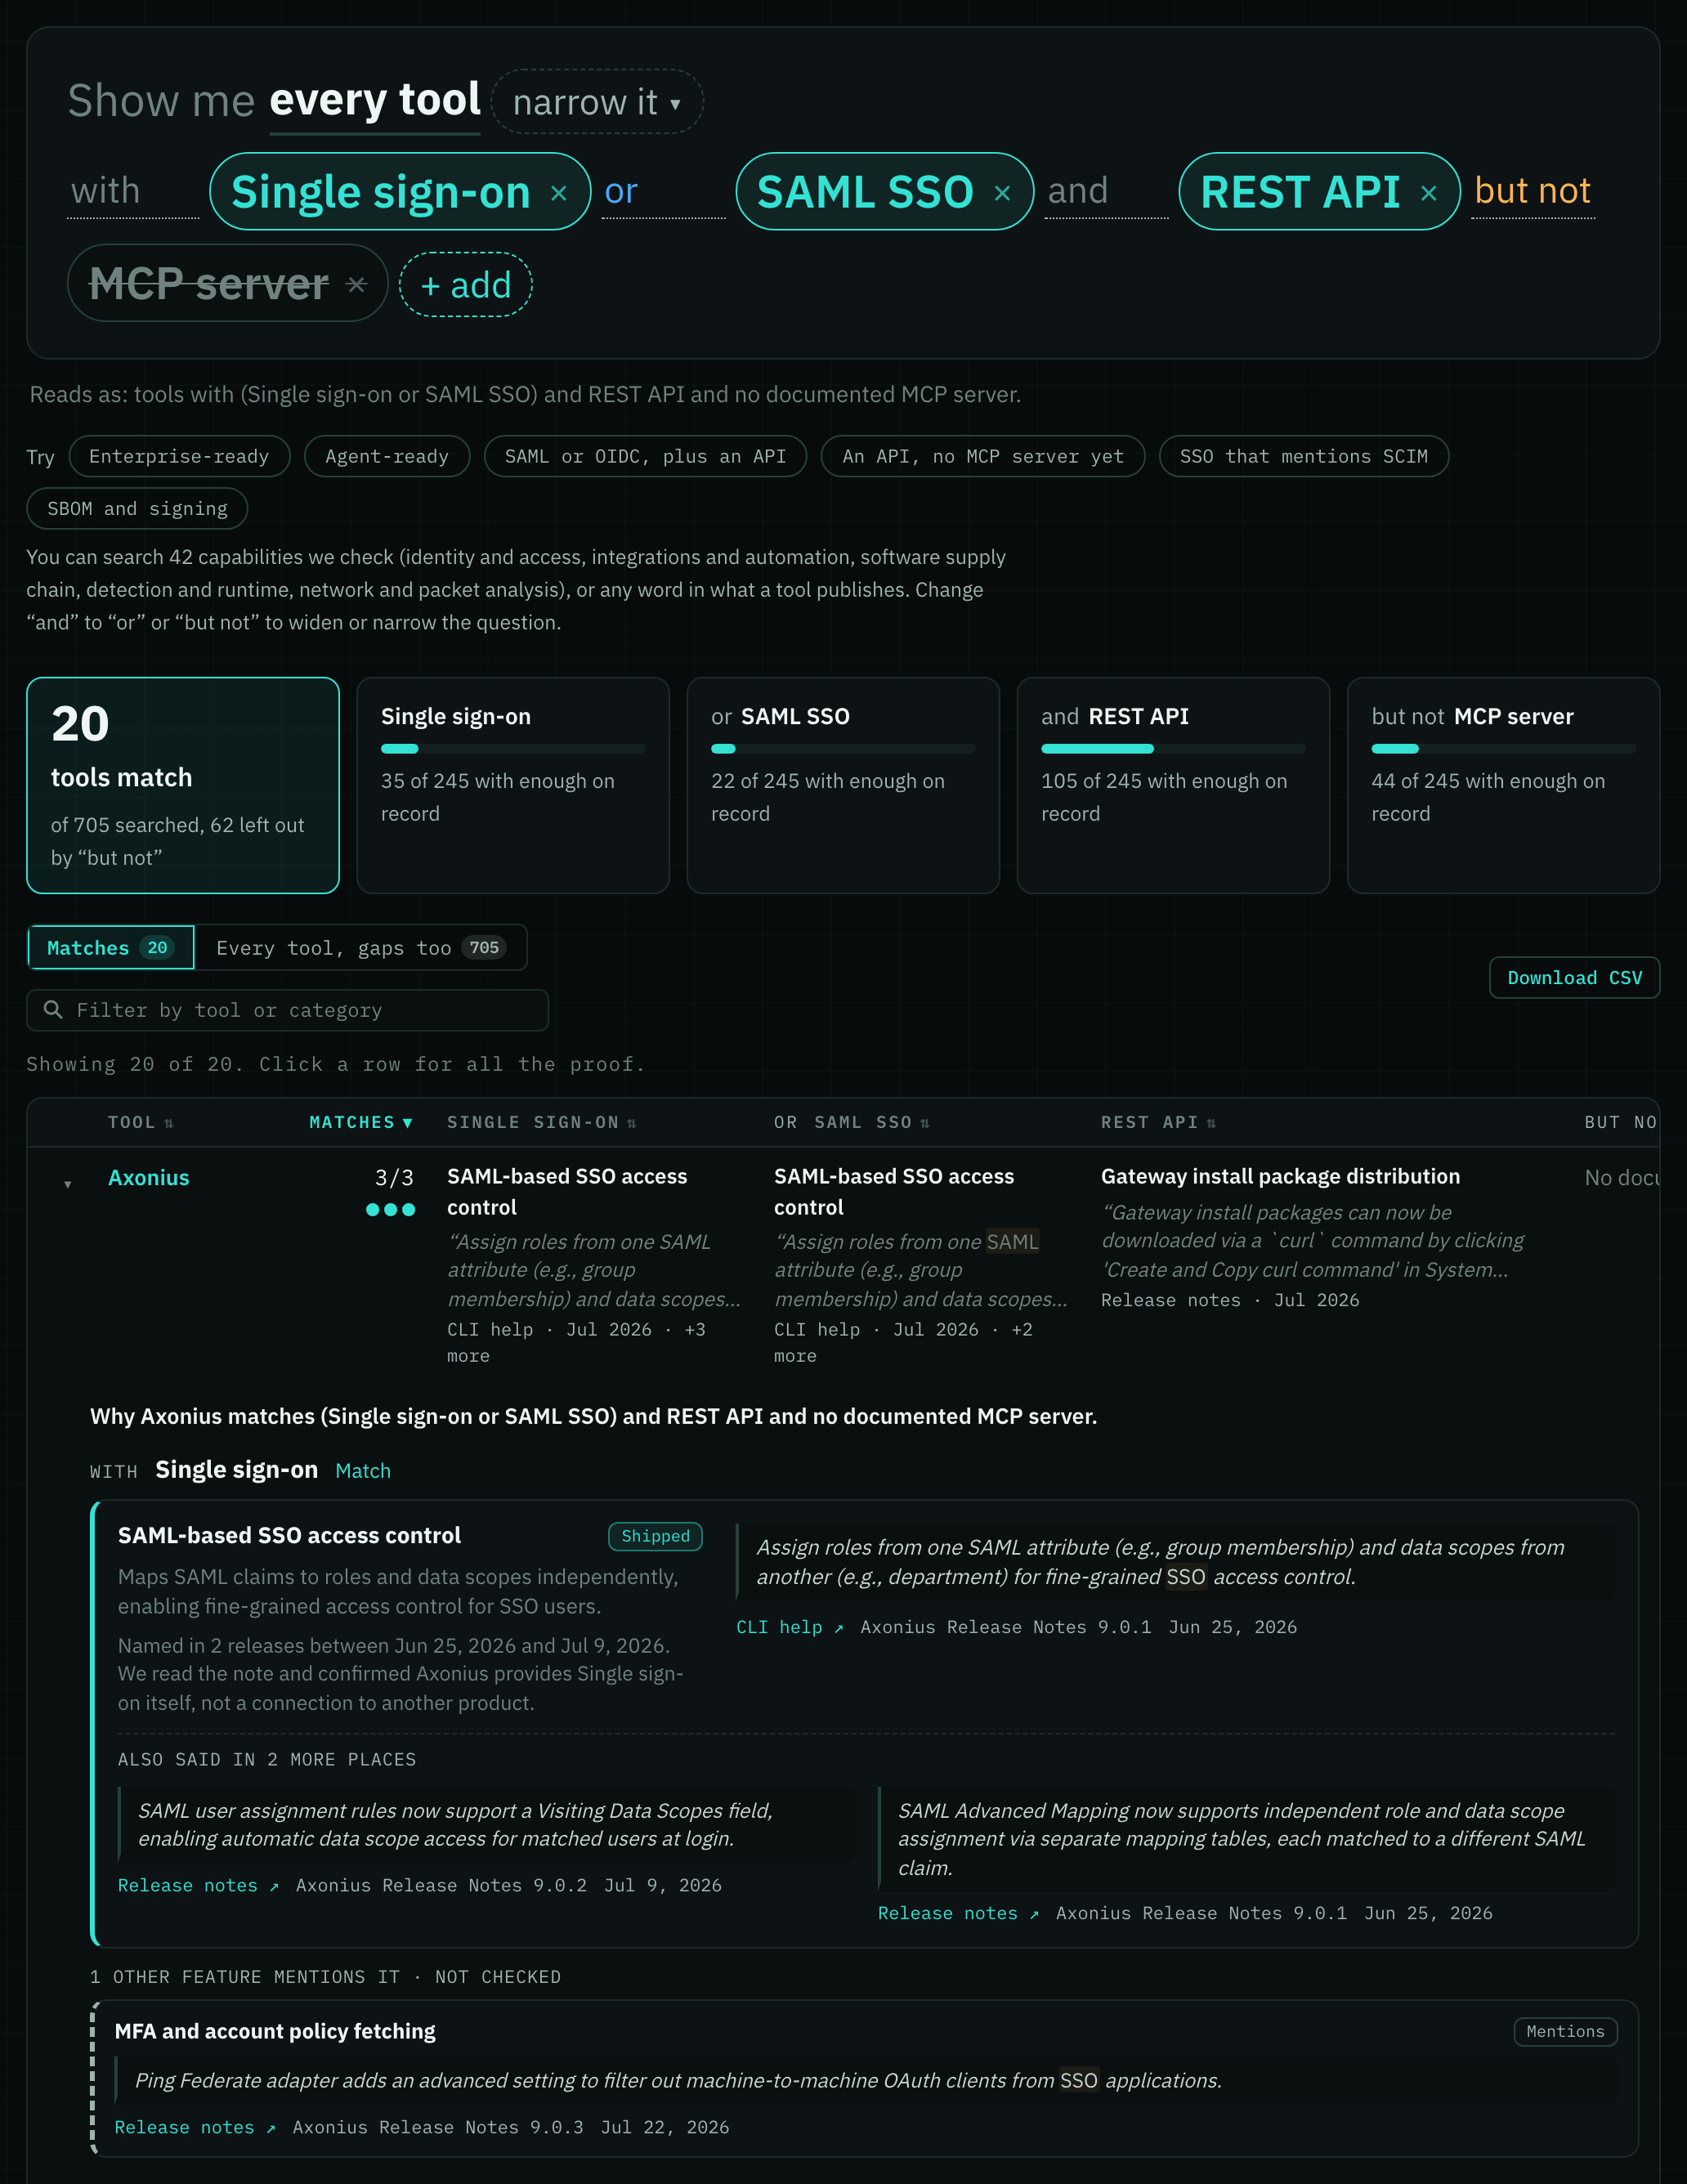
-
Open any threat on the threats page to see each control you can put in place against it, from finding where the affected product runs to detection rules, and which of those already have content built for that threat. You can tell in one glance what you can deploy today and where you are on your own. With Researcher or Business you also get the tool for each control, the rule itself and the command to run it.
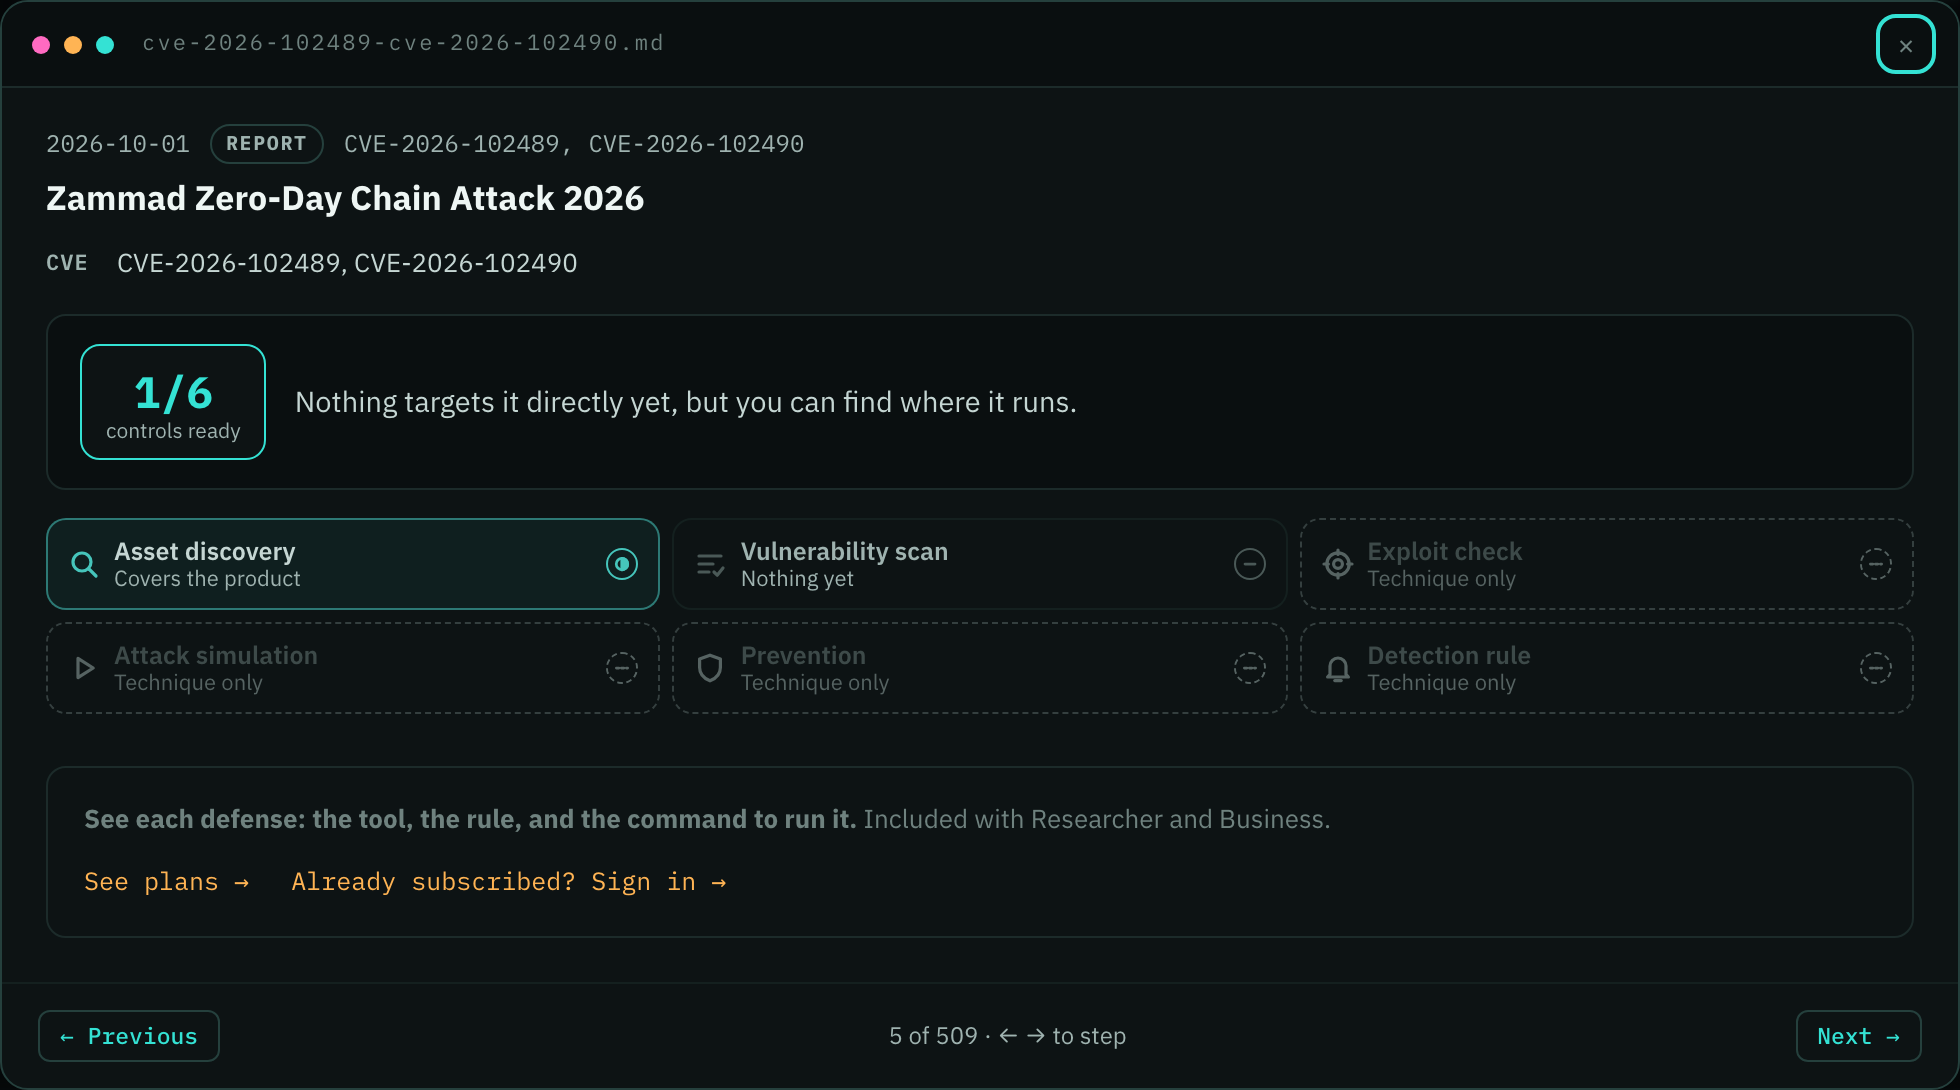
-
Every page on the site is now listed in a menu down the left side, grouped into Newsletters, Explore, Insights, Developers and About, so you can find any page without guessing where it lives. The bar along the top shows where you are and keeps search, a Support menu for feedback and help, the theme and your account in one corner.
-
Press ⌘K (Ctrl-K) to see every page on one screen, each with a line on what it is for, plus quick theme and site switches. Start typing and it searches cyber tools, issues and articles the way it did before.
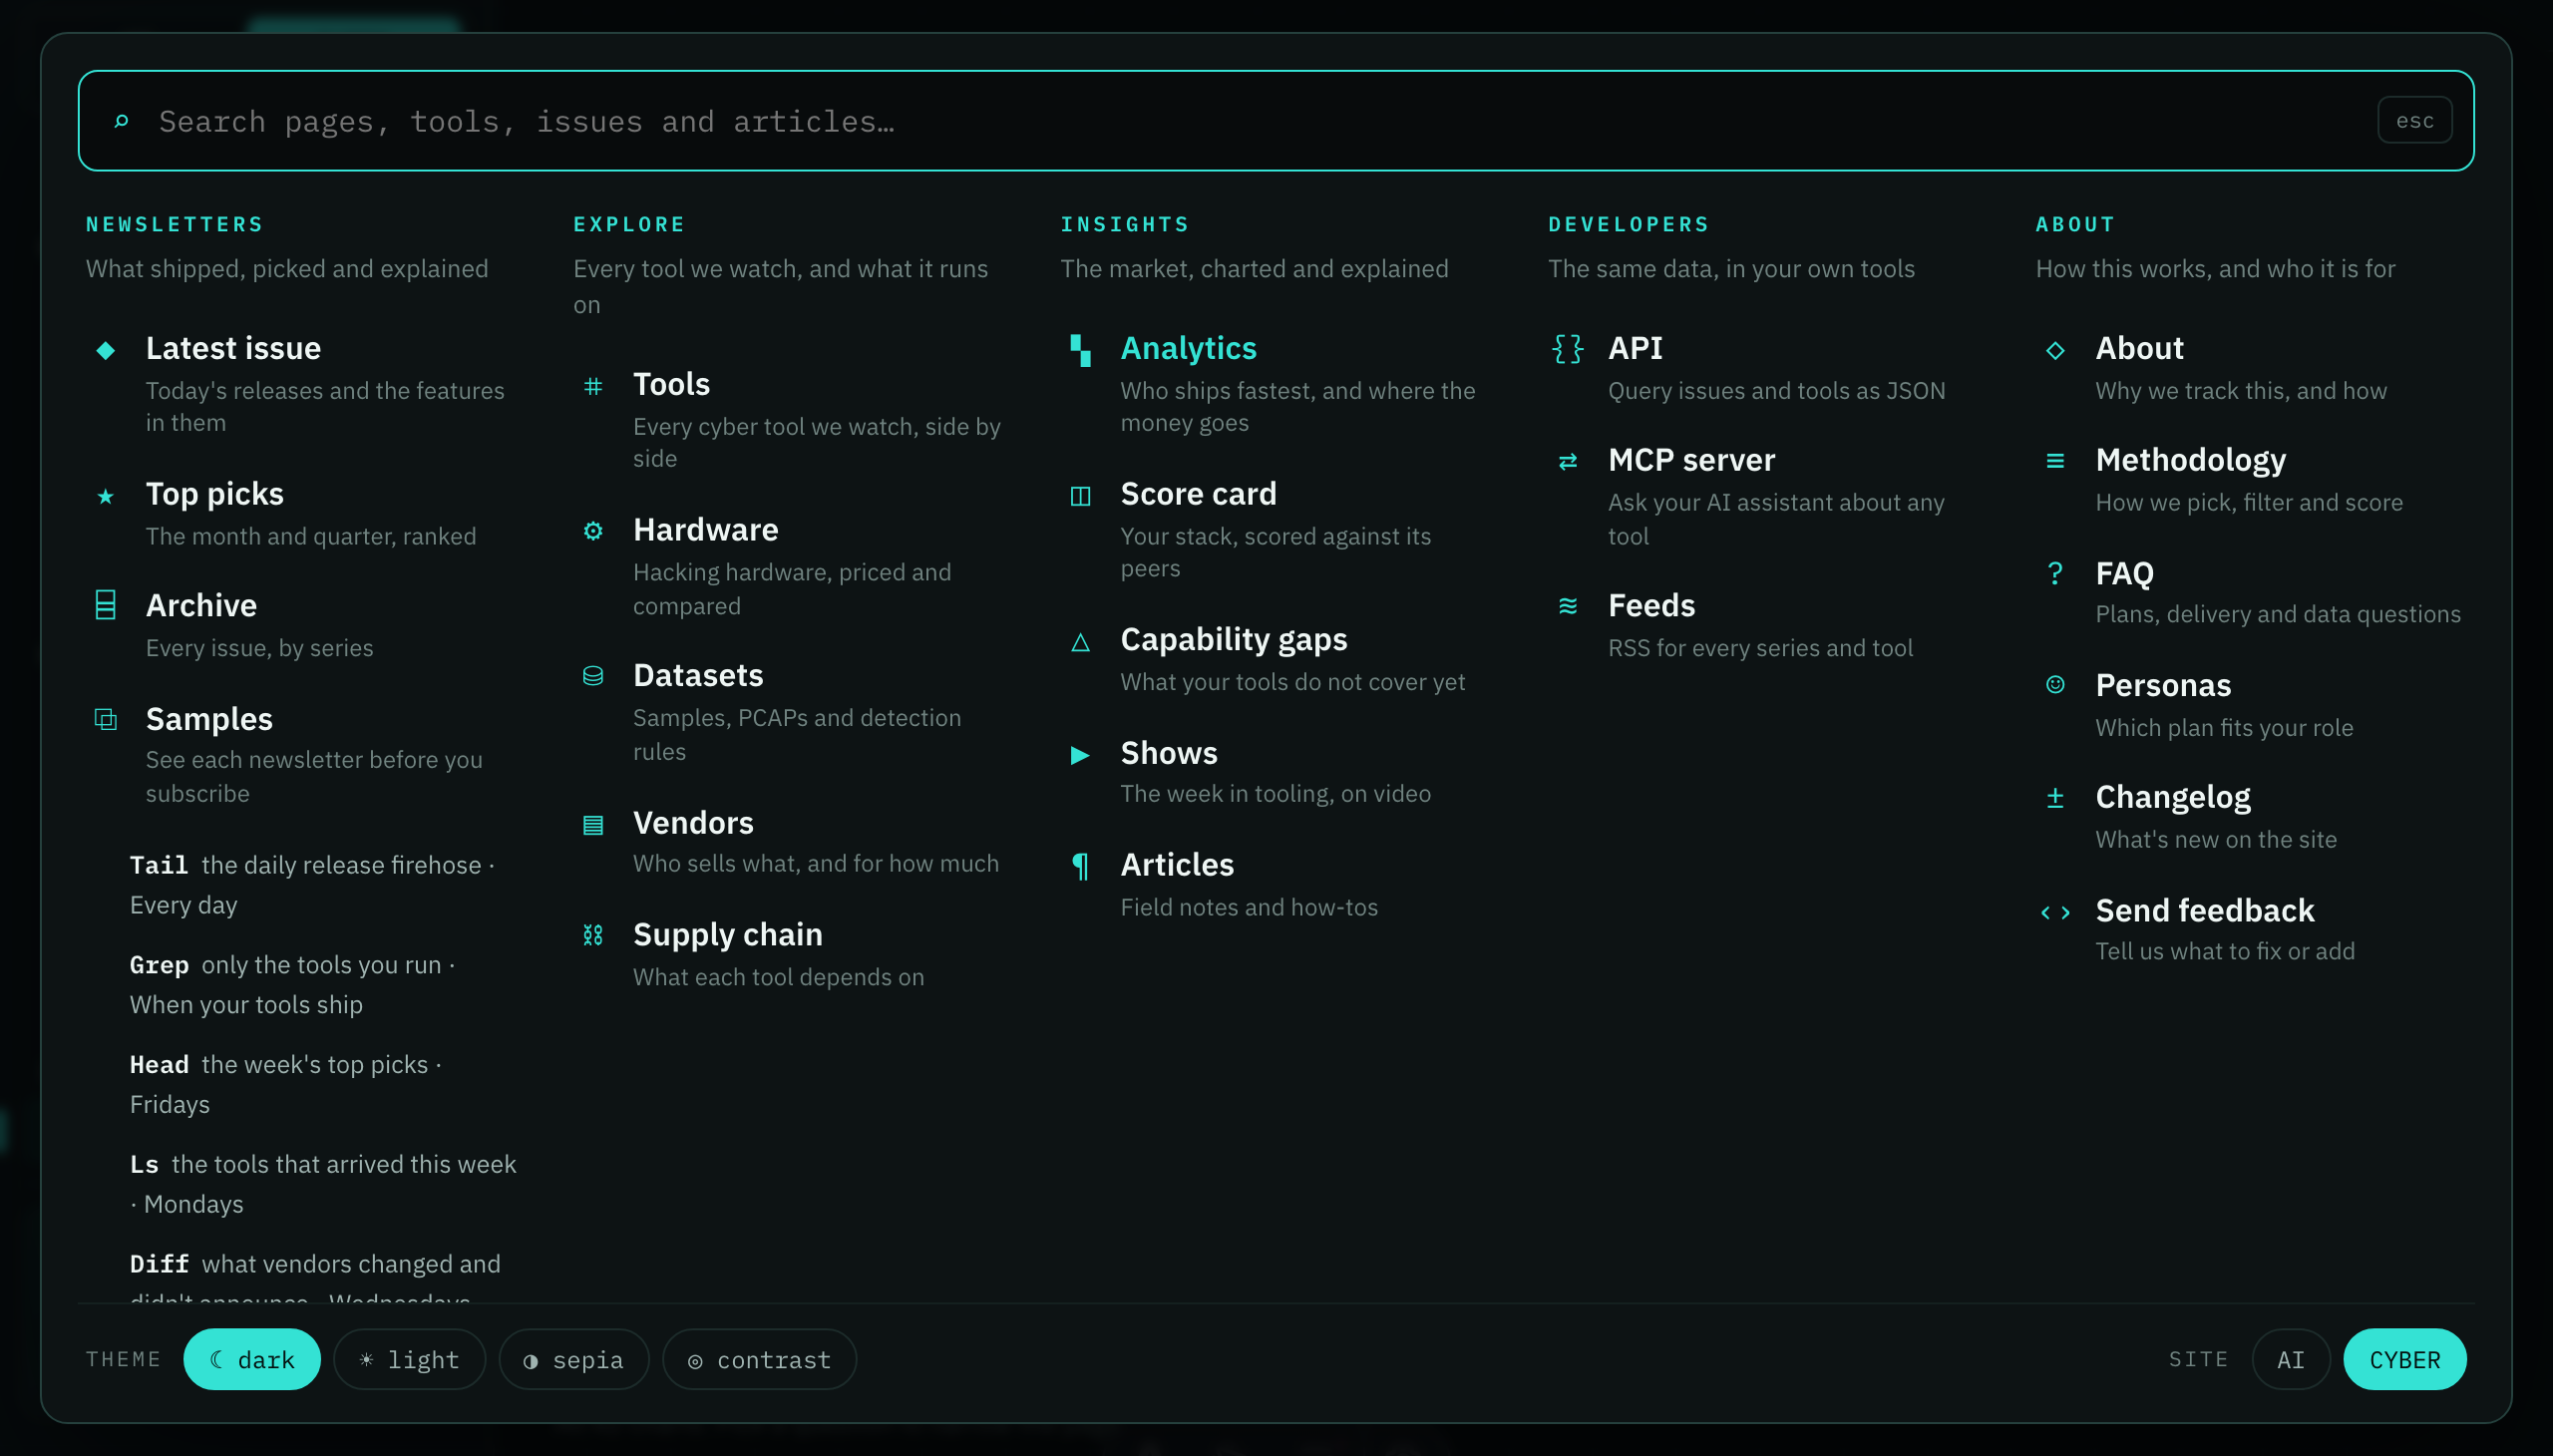
-
Looking for an older issue? The newsletter archive now opens with the newest issue of each newsletter, then lists every issue in one table. Search it by tool name, sort by issue, date or number of updates, and narrow it to Tail, Head, Diff or reconstructed issues with the labeled buttons above it. Click a month on the chart to see only that month's issues.
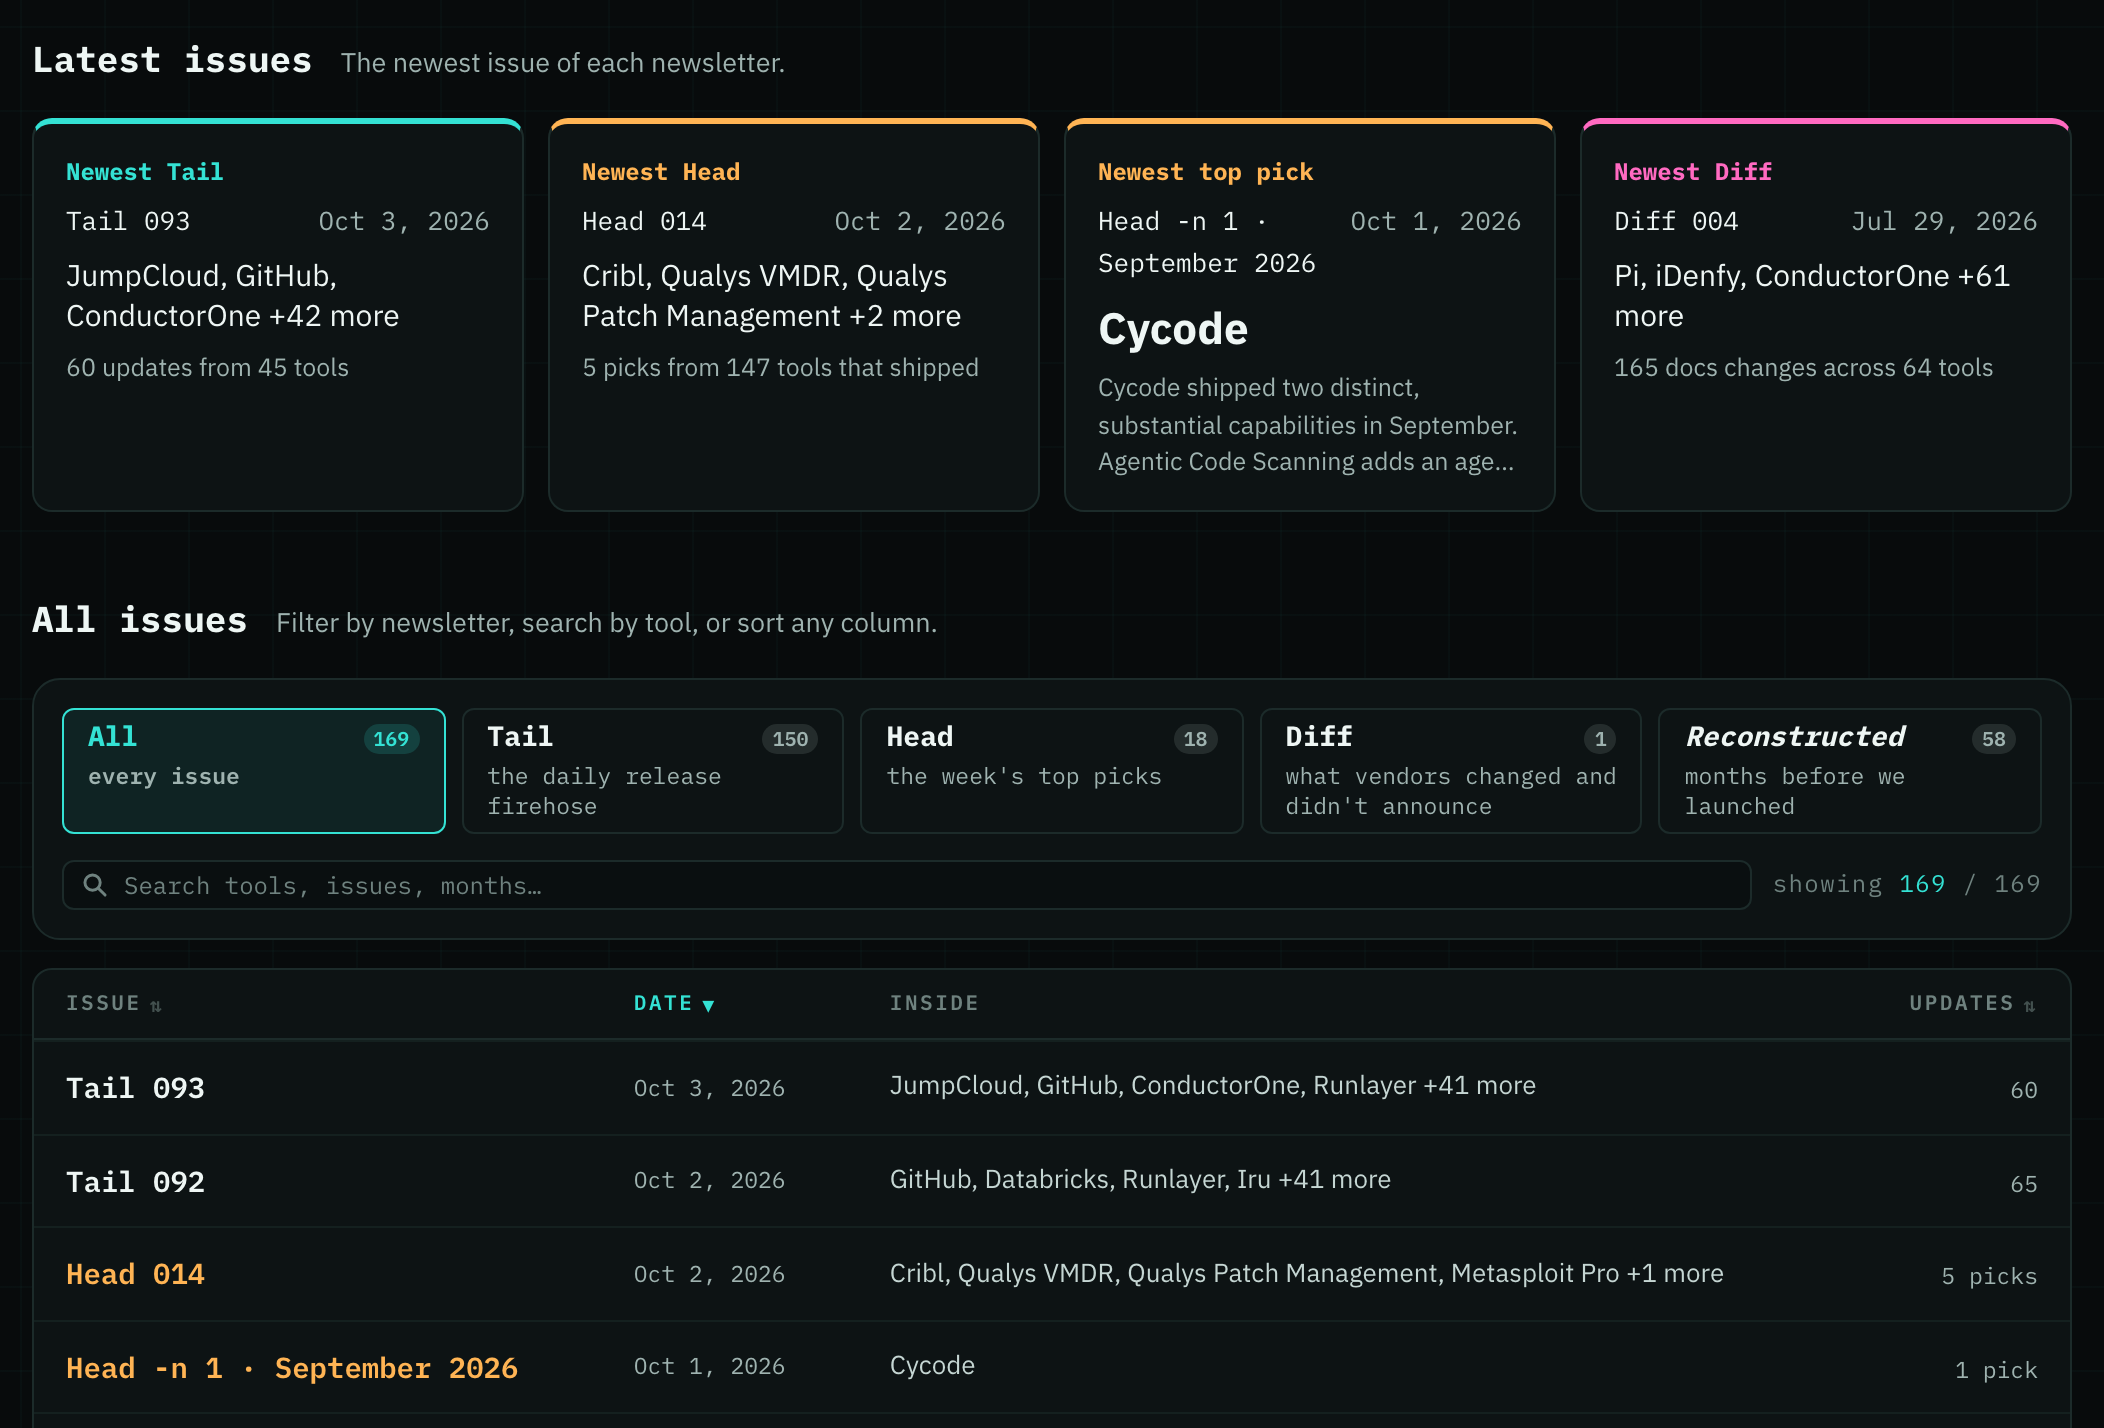
-
The tools in the homepage terminal are now links. Click one and you land on that tool in the newest issue, even if you read issues at Briefed depth, so a release that catches your eye is one click away. The terminal also lists only tools that issue actually covers, and the issue's Contents box now counts the tools it is showing.
- The menu now marks pages that are still early: Analytics, Supply chain, Score card and Capability Search carry an alpha tag, and Vendors carries a beta tag. Alpha means expect rough edges and changes; beta means it works but is still being refined.
- Compare score cards for up to six cyber tools side by side on the Score card page. Find tools by name, vendor or category, or start from your toolchain, and see which one leads on shipping, documentation, breaking changes, maintenance and innovation without opening each tool page. Every paid plan can compare scores. Researcher and Business also see where each tool ranks among its peers. Copy the page link to share the same comparison.
- You can now find the privacy policy, terms and refund policy from site search. Type "privacy", "terms", "refund" or just "policy" and they come up.
- The Tools page has a new Backup & Recovery category: follow restic, BorgBackup, Kopia, Velero, Veeam, Kasten, Commvault, Cohesity, Druva, Acronis and Rubrik to see whether the layer you recover from ransomware with is keeping up.
- When you are signed in, the top-right corner shows one account menu with your plan, account settings, billing, appearance and sign out, so you can tell at a glance that you are signed in.
- A tool that ships several releases in one issue now stays in one rolled-up section even when one of those releases adds coverage, such as new detections, checks or integrations. Before, a single coverage update split the tool back into one card per release, so you scrolled past near-identical cards to find what changed. The coverage release still shows below the section.
- The tool catalog and search now list only cyber tools. A few hundred AI developer tools had slipped in from our sister site and cluttered your results, so you can find the tool you came for faster. Those tools still have their pages on aitoolchain.io.
*
Oct 2, 2026
-
Pick an attack type and get a short list of cyber tools that cover it together, stage by stage, starting from the tools you already run. You see what each tool adds, what the stack still leaves open, and which tools work with each other, so you can plan coverage instead of guessing. Included with Researcher and Business.
-
Tool pages now show how many of the last year's threats a tool has content for, so you can judge its coverage before you adopt it. With Researcher and Business you also see the threats one by one and how similar tools compare: which threats only this tool covers and which ones its peers cover instead.
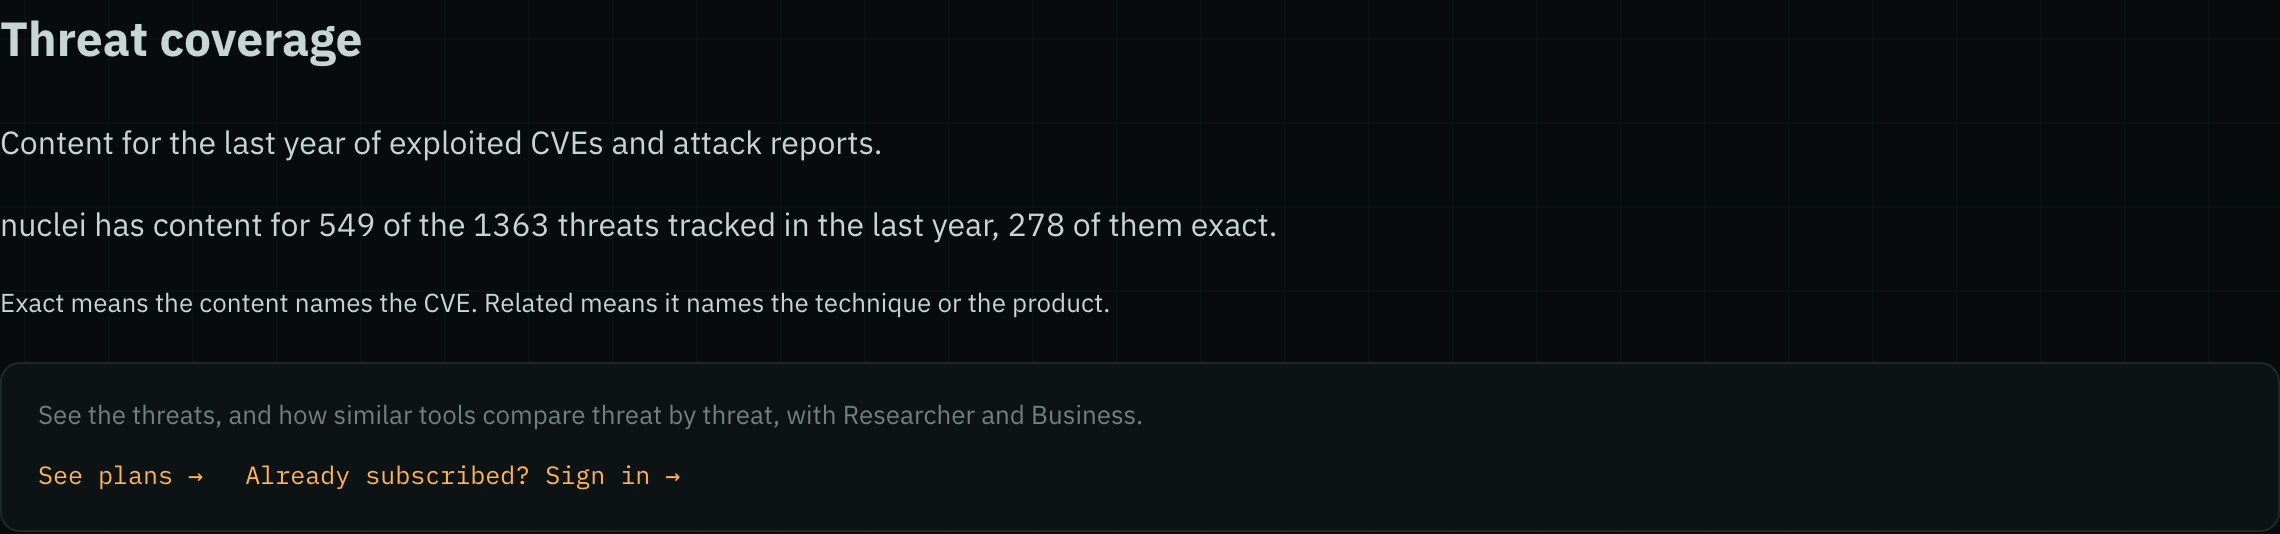
-
Shortlisting cyber tools? Capability gaps lets you enter up to five capabilities you need, pick a category, and see which tools document each one, with a link to the feature or the sentence on the tool's own README, docs or website that says so. You can check every match yourself and download the table. Included with Researcher and Business.
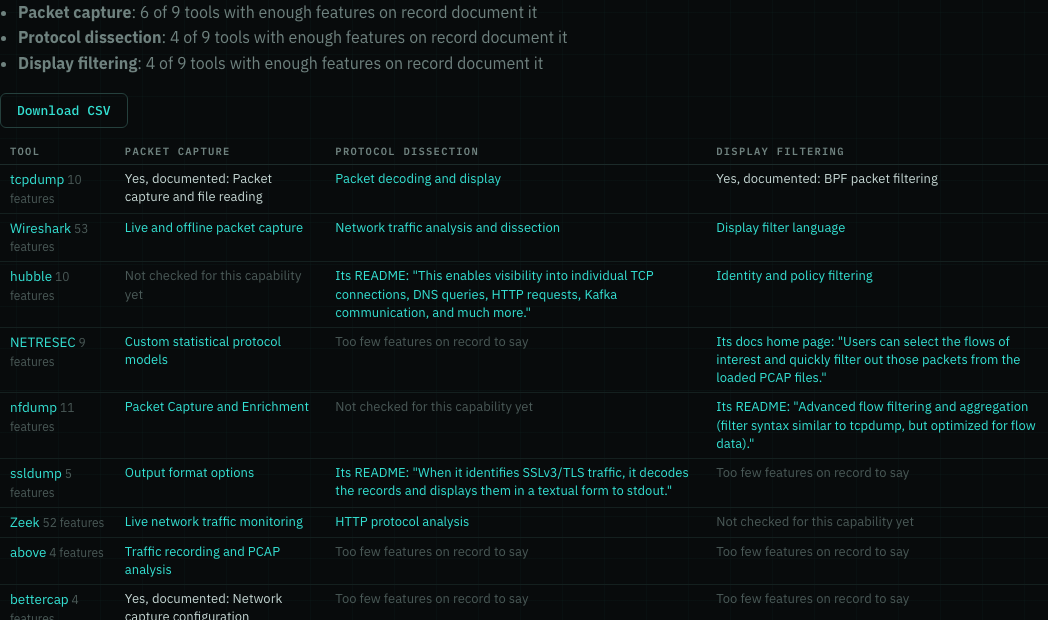
-
See which tools help with each new KEV entry and campaign, from checking exposure to testing a fix. Every threat on the new Threats page shows how many tools have a check, test or detection for it at each stage, so you can spot the exploited CVEs nobody covers yet. Researcher and Business plans see the tool, the check and the command to run.
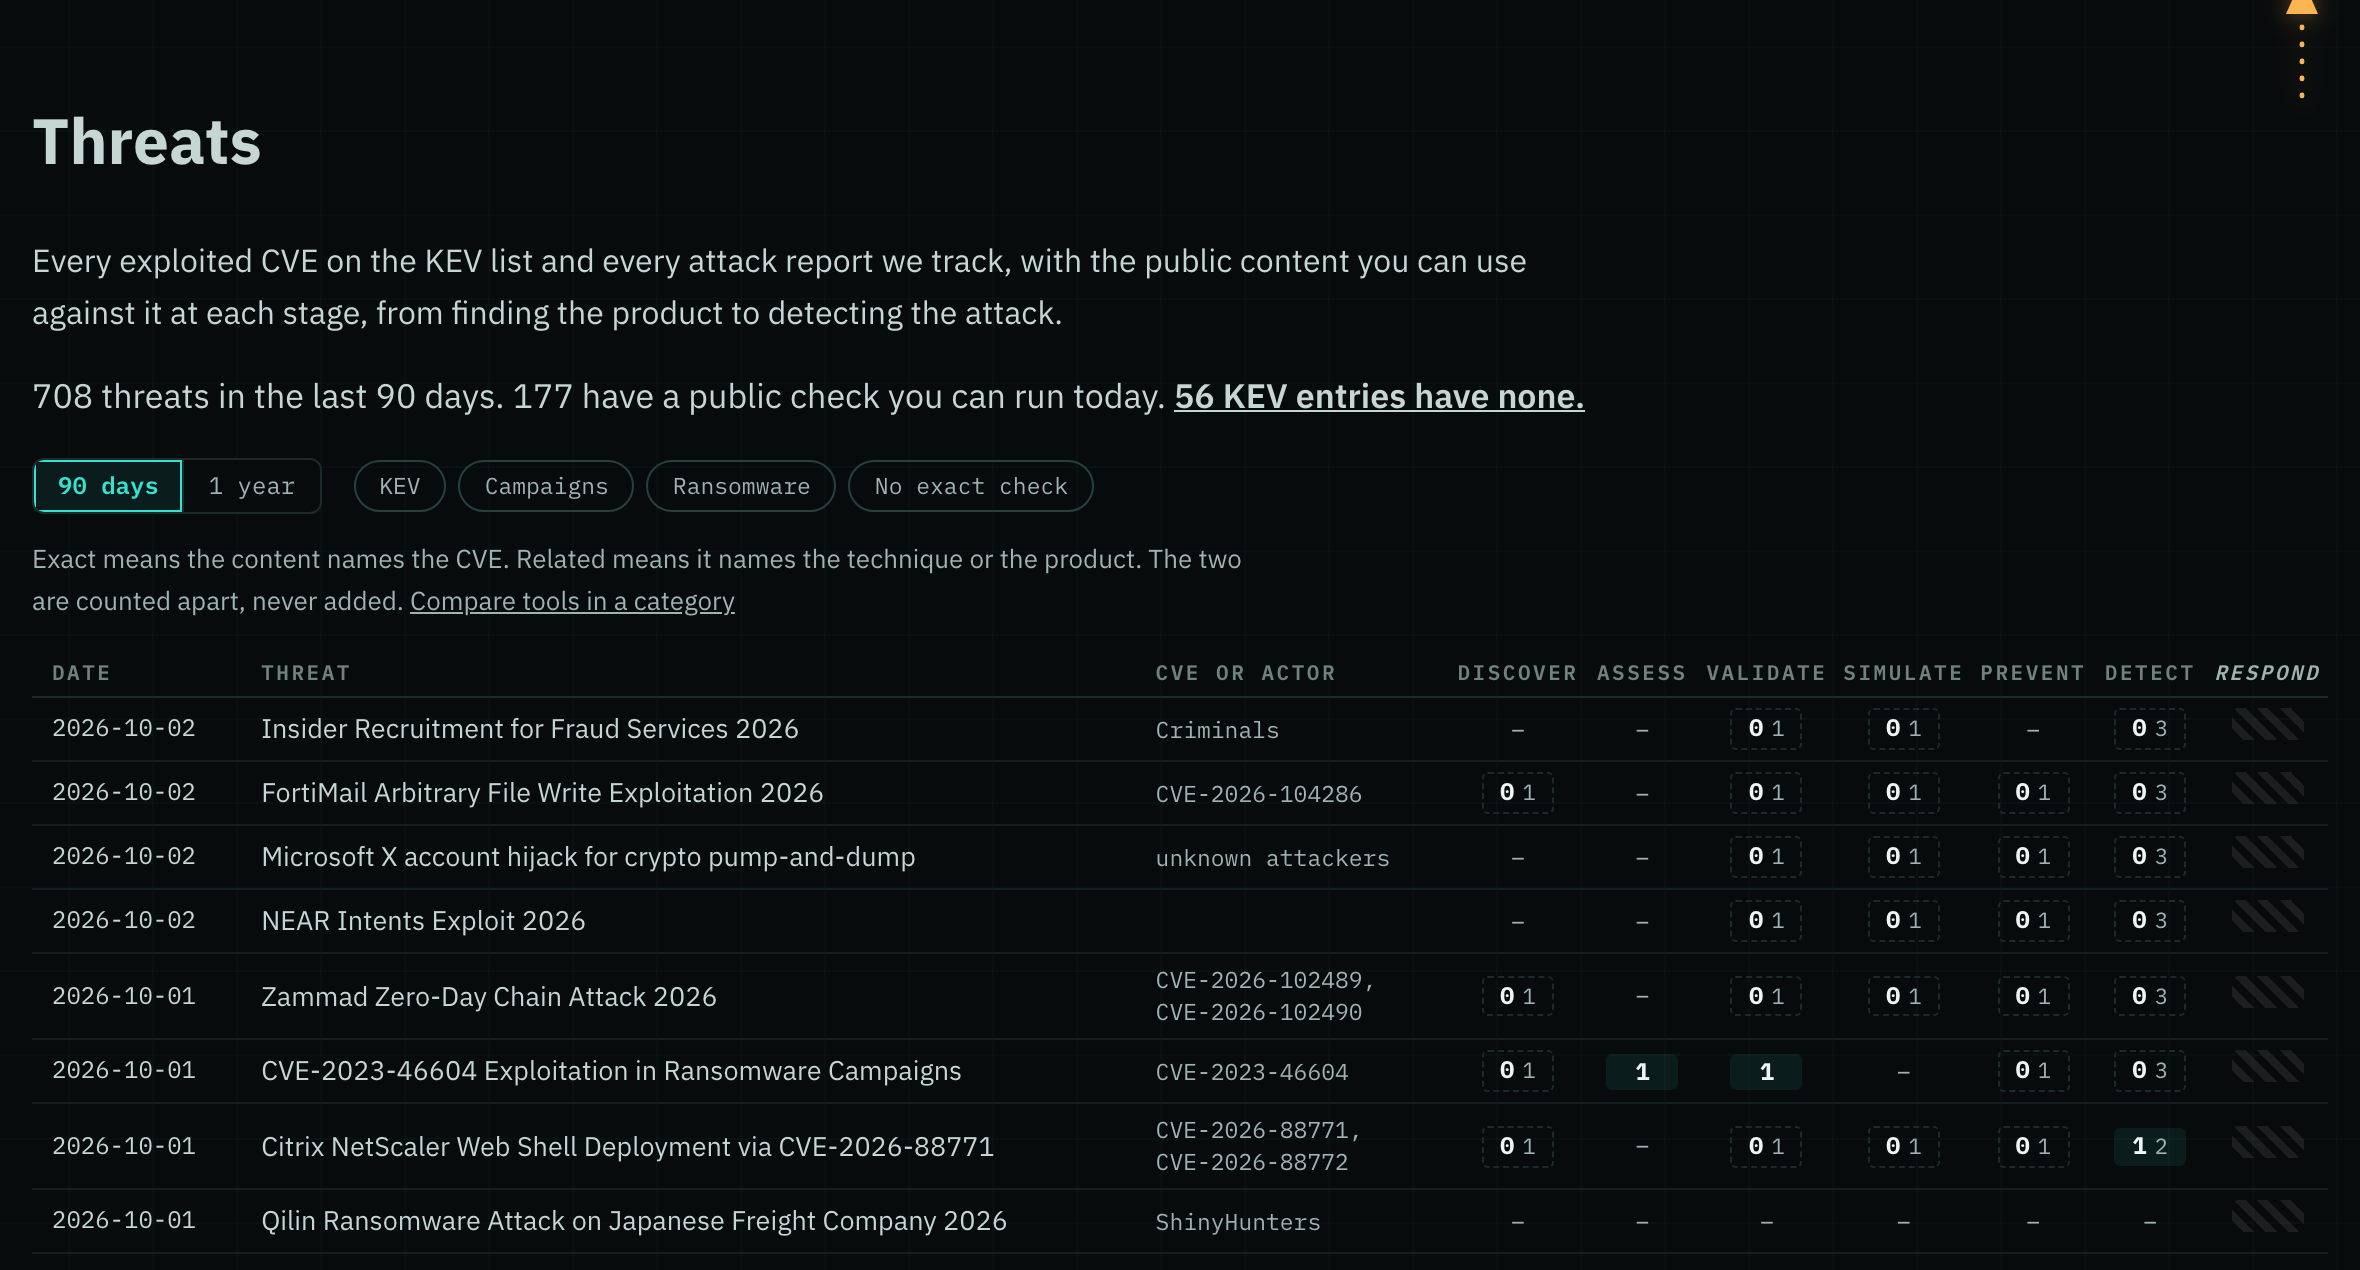
-
Vendor pricing histories now show a vendor's whole lineup, including offerings sold without a list price, like Rapid7's managed detection and response service. When an offering has its own page of plans, those plans now appear under the board, so you can compare a vendor's tiers without leaving the page.
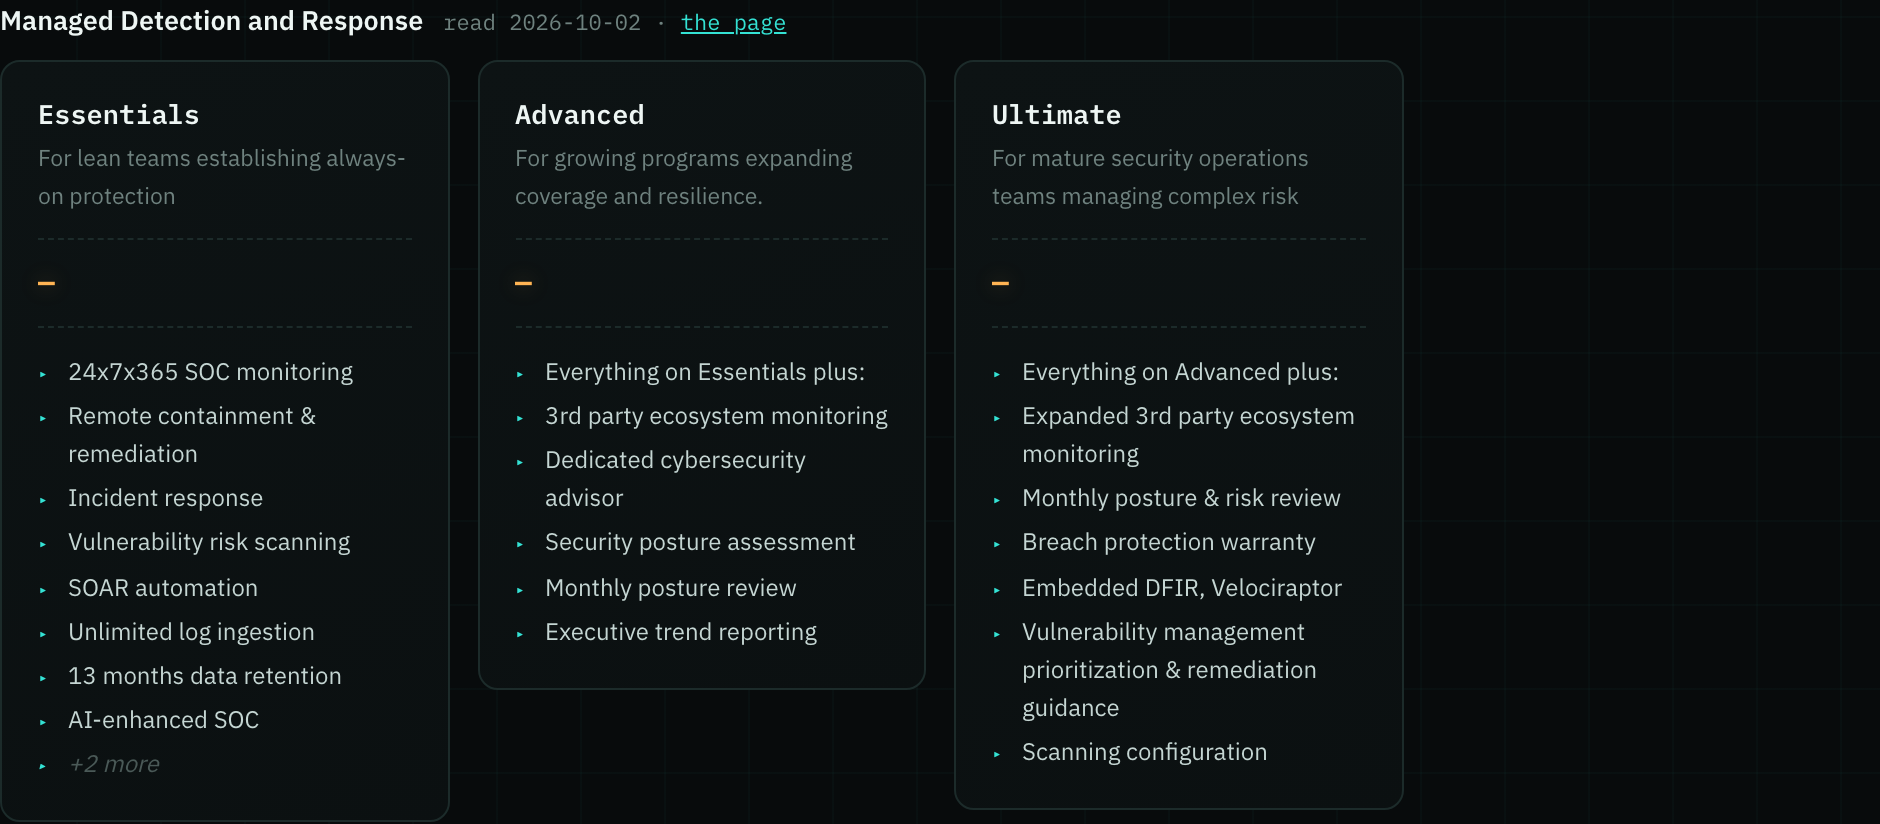
-
Signing in no longer turns your email back on. If you unsubscribed, your account page now says your email is off and gives you one button to start it again. Subscribing again or buying a plan also starts it.

-
Tool pages now have an Articles section: tutorials that teach the tool, attack reports that name it, incident write-ups, and research on attacks against the tool itself. Each row says why it is listed and links straight to the publisher, so you can learn a tool and see how attackers use it without leaving its page.
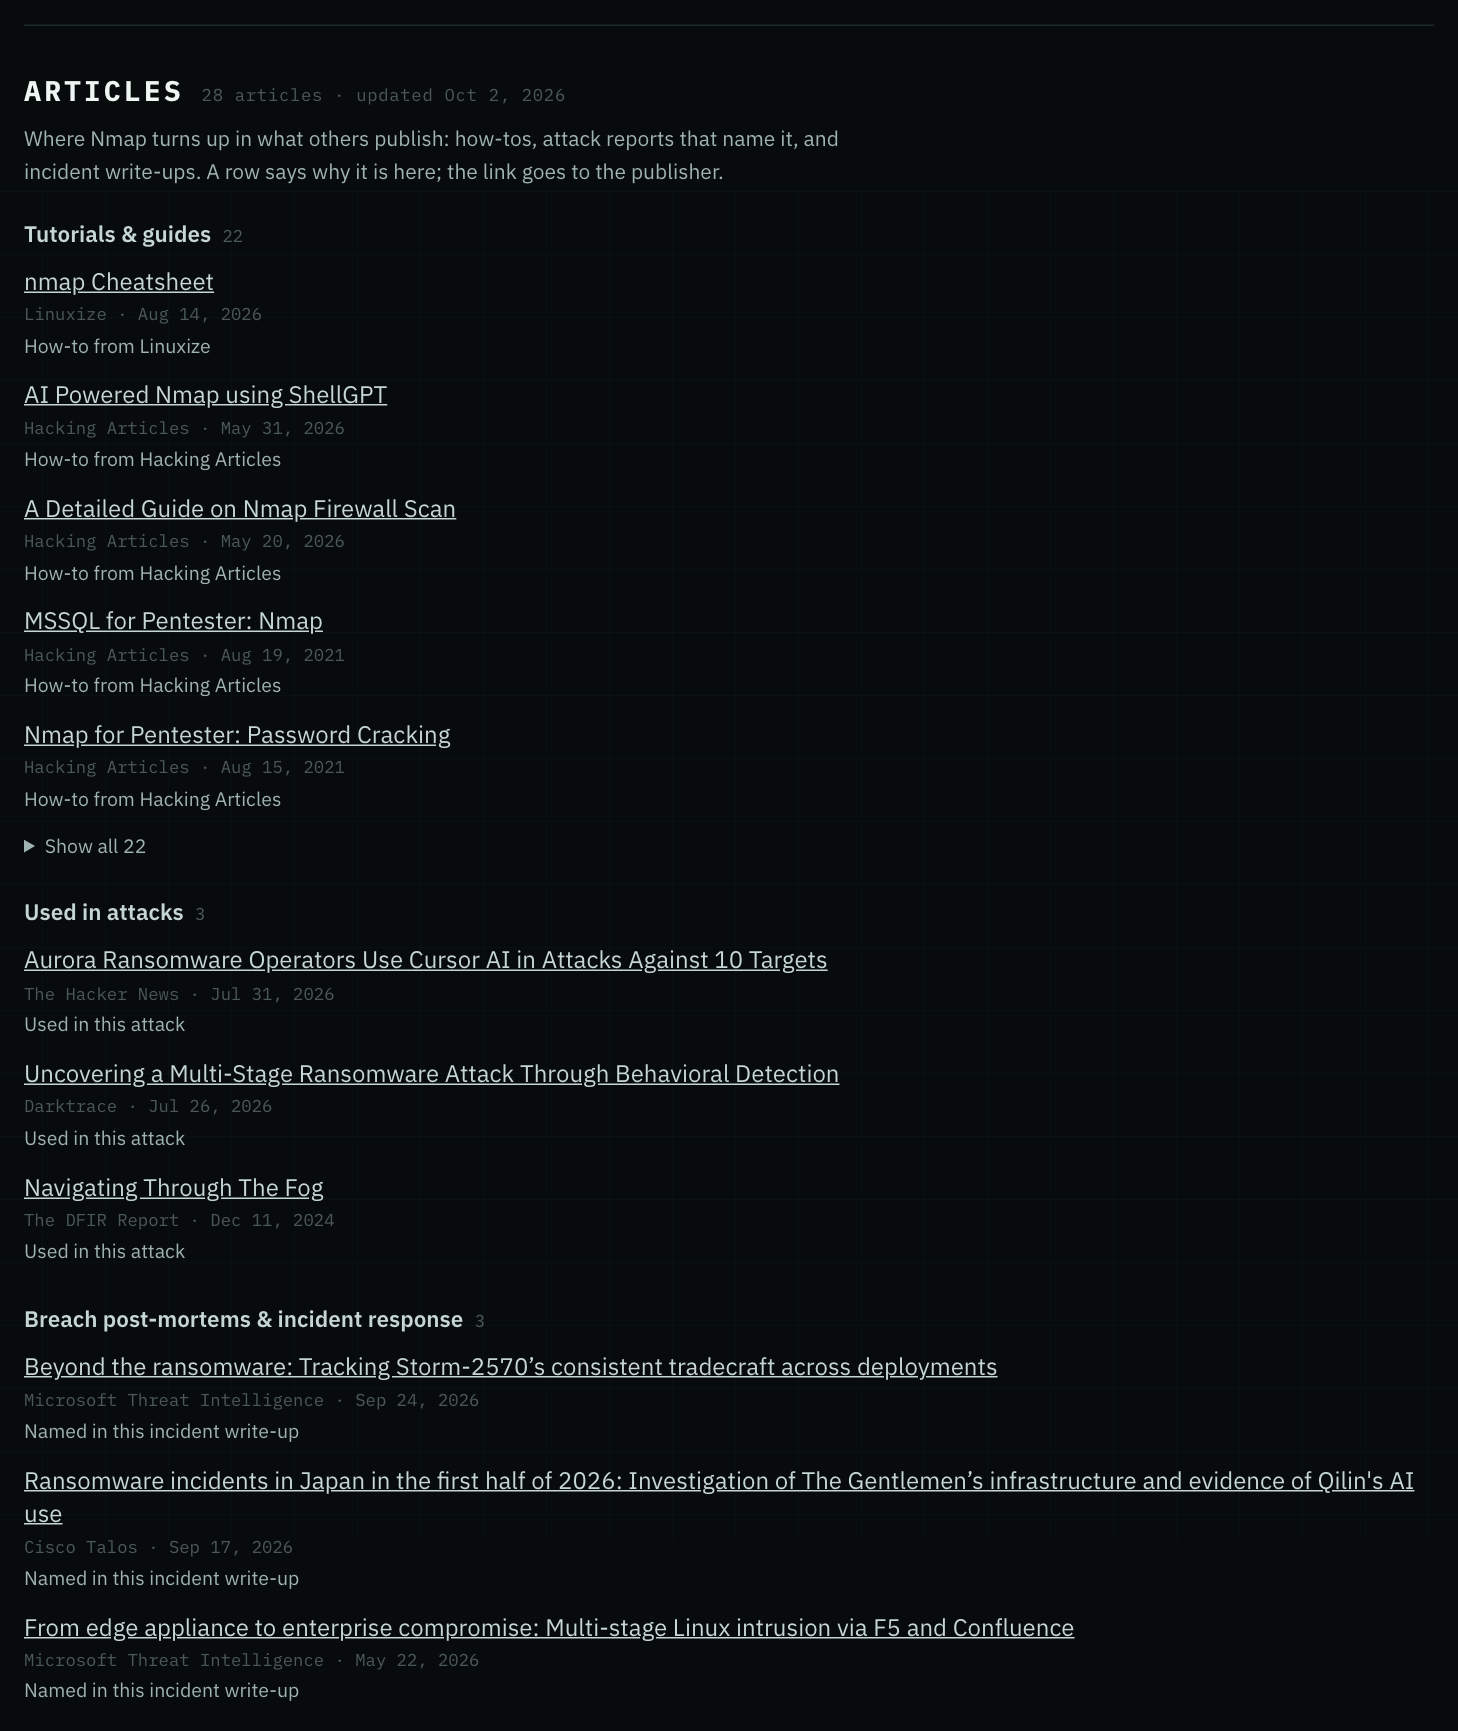
-
The Vendors page now opens with the numbers that matter at a glance: how many vendors you can follow, how many changed their plans, how many relaunched their lineup outright, and how many pricing-page readings sit behind it. You see the size of the market's pricing churn before you scroll, instead of digging the figures out of a paragraph.
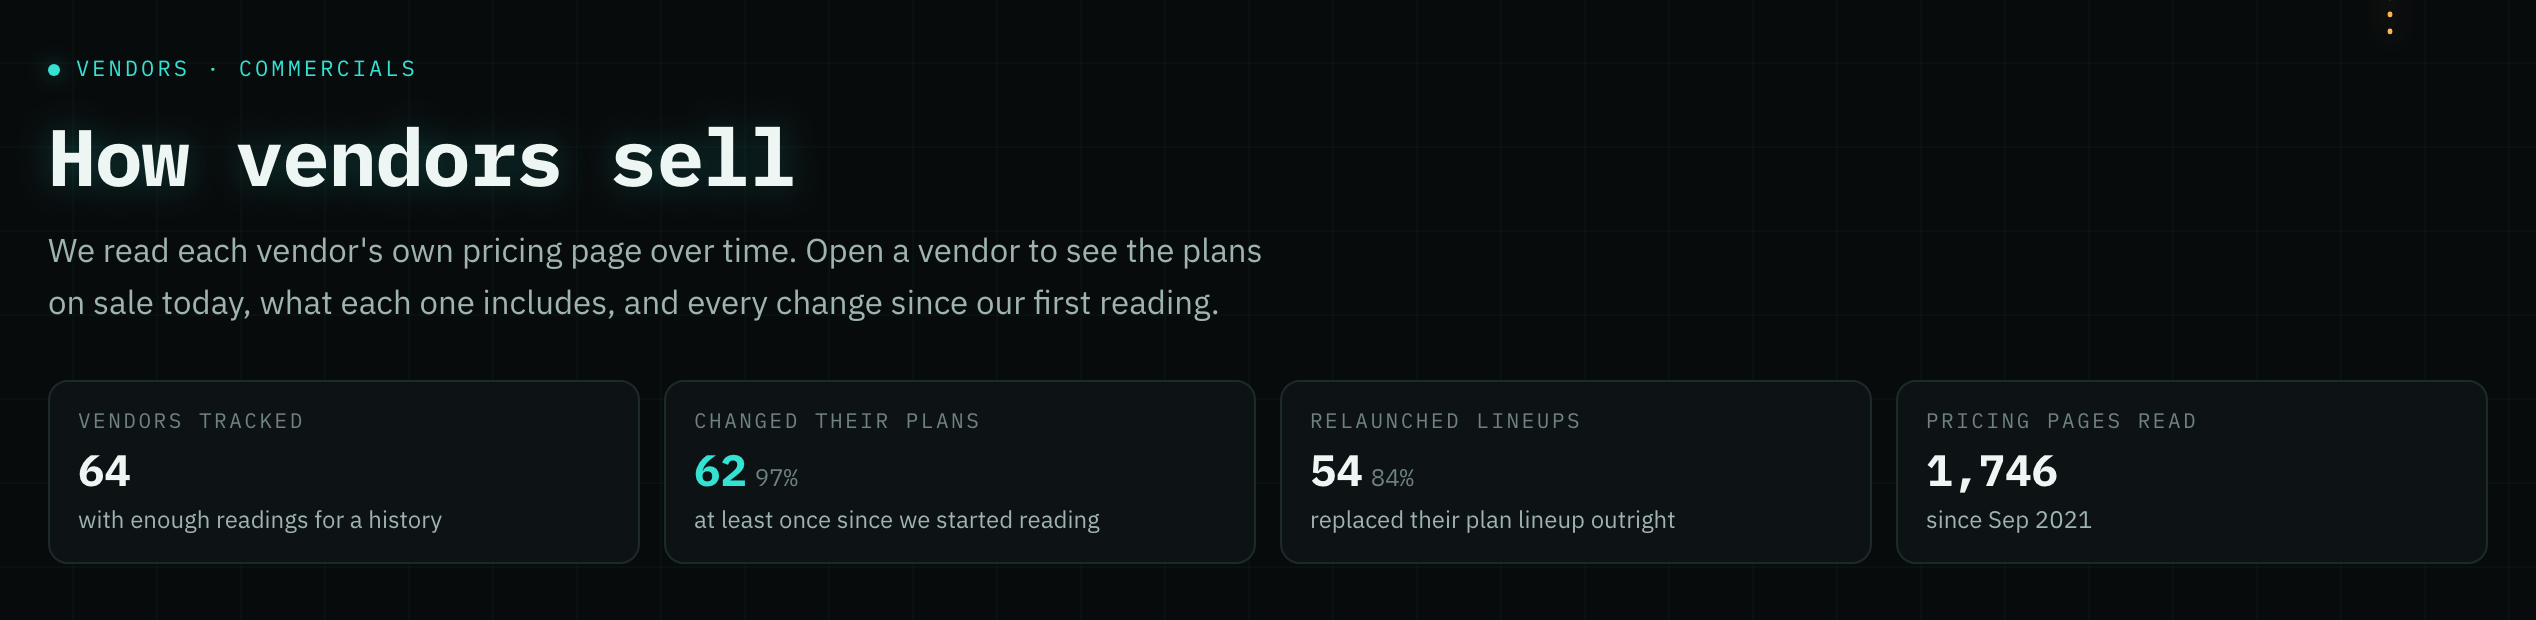
- Ask your AI assistant which cyber tools can do something, in your own words. Through our MCP server, "detect kerberoasting" also finds tools that document Kerberos ticket analysis. The answer lists the other names it searched, so you can see why each tool came back.
- Tool pages now list more how-to guides in their Articles section, from TecAdmin and Tecmint, so you can find a step-by-step walkthrough for tools like Fail2ban, Trivy, Kubescape and Terraform on the same page as their release history.
- A plan you buy while signed in now lands on the account you are signed in to, whatever email you type at the payment form, so your newsletters and charts unlock where you already are.
- If your plan has ended, your account page shows the plans again, so you can pick one up where you left off.
- Paid charts now unlock on the page you are on even when the first check of your plan does not go through, instead of waiting for the next page you open.
- A welcome or purchase email that did not go out the first time is sent again, with a sign-in link, so you still have a way in.
- Pressing Escape in a table's search box now steps out onto the first match and keeps your filter, so j/k or the arrow keys pick a row and Enter or Space opens it.
- When a sign-in email cannot be sent right away, the page now says so and asks you to try again in a moment, instead of telling you to check your inbox. The same goes for the Continue button on a sign-in link: a busy moment asks you to press again, instead of saying your link expired.
- Checkout now tells you when the payment form cannot load, which an ad blocker can cause, and gives you an address to write to.
- Buying a plan after saving your preferences as a free reader now turns on that plan's newsletters. Before, they stayed off until you found the switches yourself.
- If you pay yearly, moving up a plan or adding the second site now keeps you on yearly billing. A partial refund no longer ends your plan.
- If your sign-in runs out while your account page is open, pressing Save now gives you a button for a new sign-in link, instead of a message with nowhere to go. And if your browser blocks cookies and site data, the account page says what to allow instead of loading forever.
- The Plans page no longer says the methodology is open without an account. It comes with every paid plan, and the page now says so.
- The dotted arrow pointing at Subscribe on the home page now keeps moving the whole time you are on the page, instead of fading in and out.
- The site's wording was rewritten to read plainly, across the home page, About, FAQ, Plans, API, analytics, Methodology, Scorecard, Samples, Personas and the post-purchase page. Plans now state the real API and MCP limit, 50,000 requests per key in any 24 hours, instead of calling it unlimited, and the paid-only charts are described as charts that only paid plans can see.
-
Keyboard shortcuts now work the same on every list. Filter an API page, press Enter, and j/k step through the matching endpoints; Space or Enter opens one. The same goes for vendor pricing timelines, release history, the archive, FAQ, changelog and more, where j used to just scroll. The focus ring around buttons is no longer cut off.
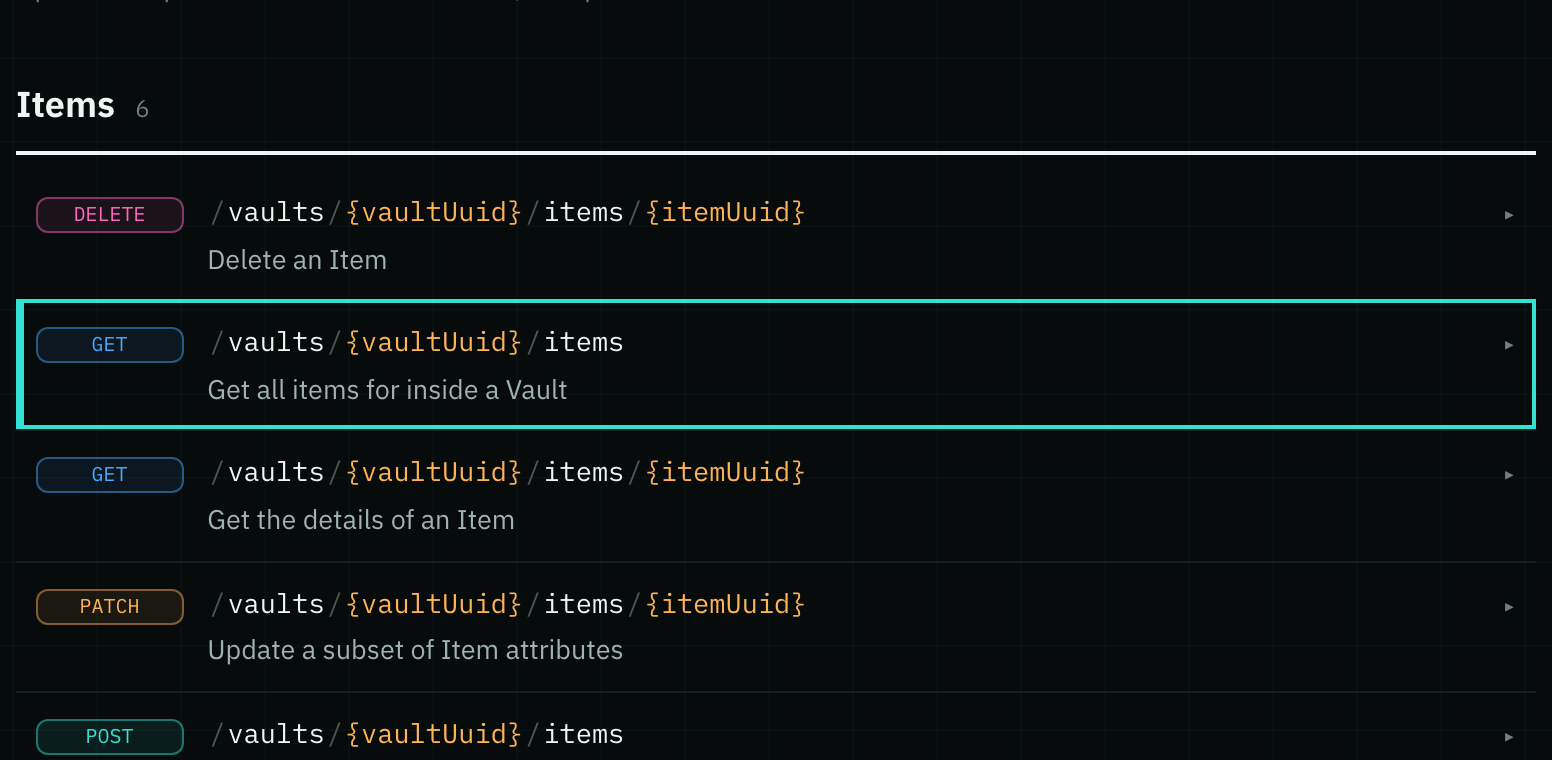
- Tool pages now reach much further back. For hundreds more tools, the release history goes back years instead of weeks, so you can see when a capability first appeared and how a tool got to where it is today. Before, many pages only showed what shipped since we started tracking them.
- Command-line tool pages that showed an empty command box now show the commands you would actually run. Before, a handful of tools told you they had a command-line interface but not how to use it; now you can copy the first command straight from the page.
- While typing in a table's search box, Ctrl+N and Ctrl+P (or Ctrl+J) now step down and up through the matching rows, alongside the arrow keys, so you can filter, pick a row and press Enter without leaving the keyboard.
*
Oct 1, 2026
-
Methodology now comes with every paid plan. Sign in and /methodology takes you to a plain-language guide to every chart and score. It tells you what each one counts, what it misses, and how far to trust it before you quote it.
-
The Vendors page is now a table you can work with, like the tools catalog. Sort by plan relaunches, other changes, readings or dates. Search by vendor or product name. Narrow it to vendors that relaunched their plans or have not changed yet. Click any row to open that vendor's pricing history. You can spot who repackages most often in a few seconds instead of reading down a fixed list.
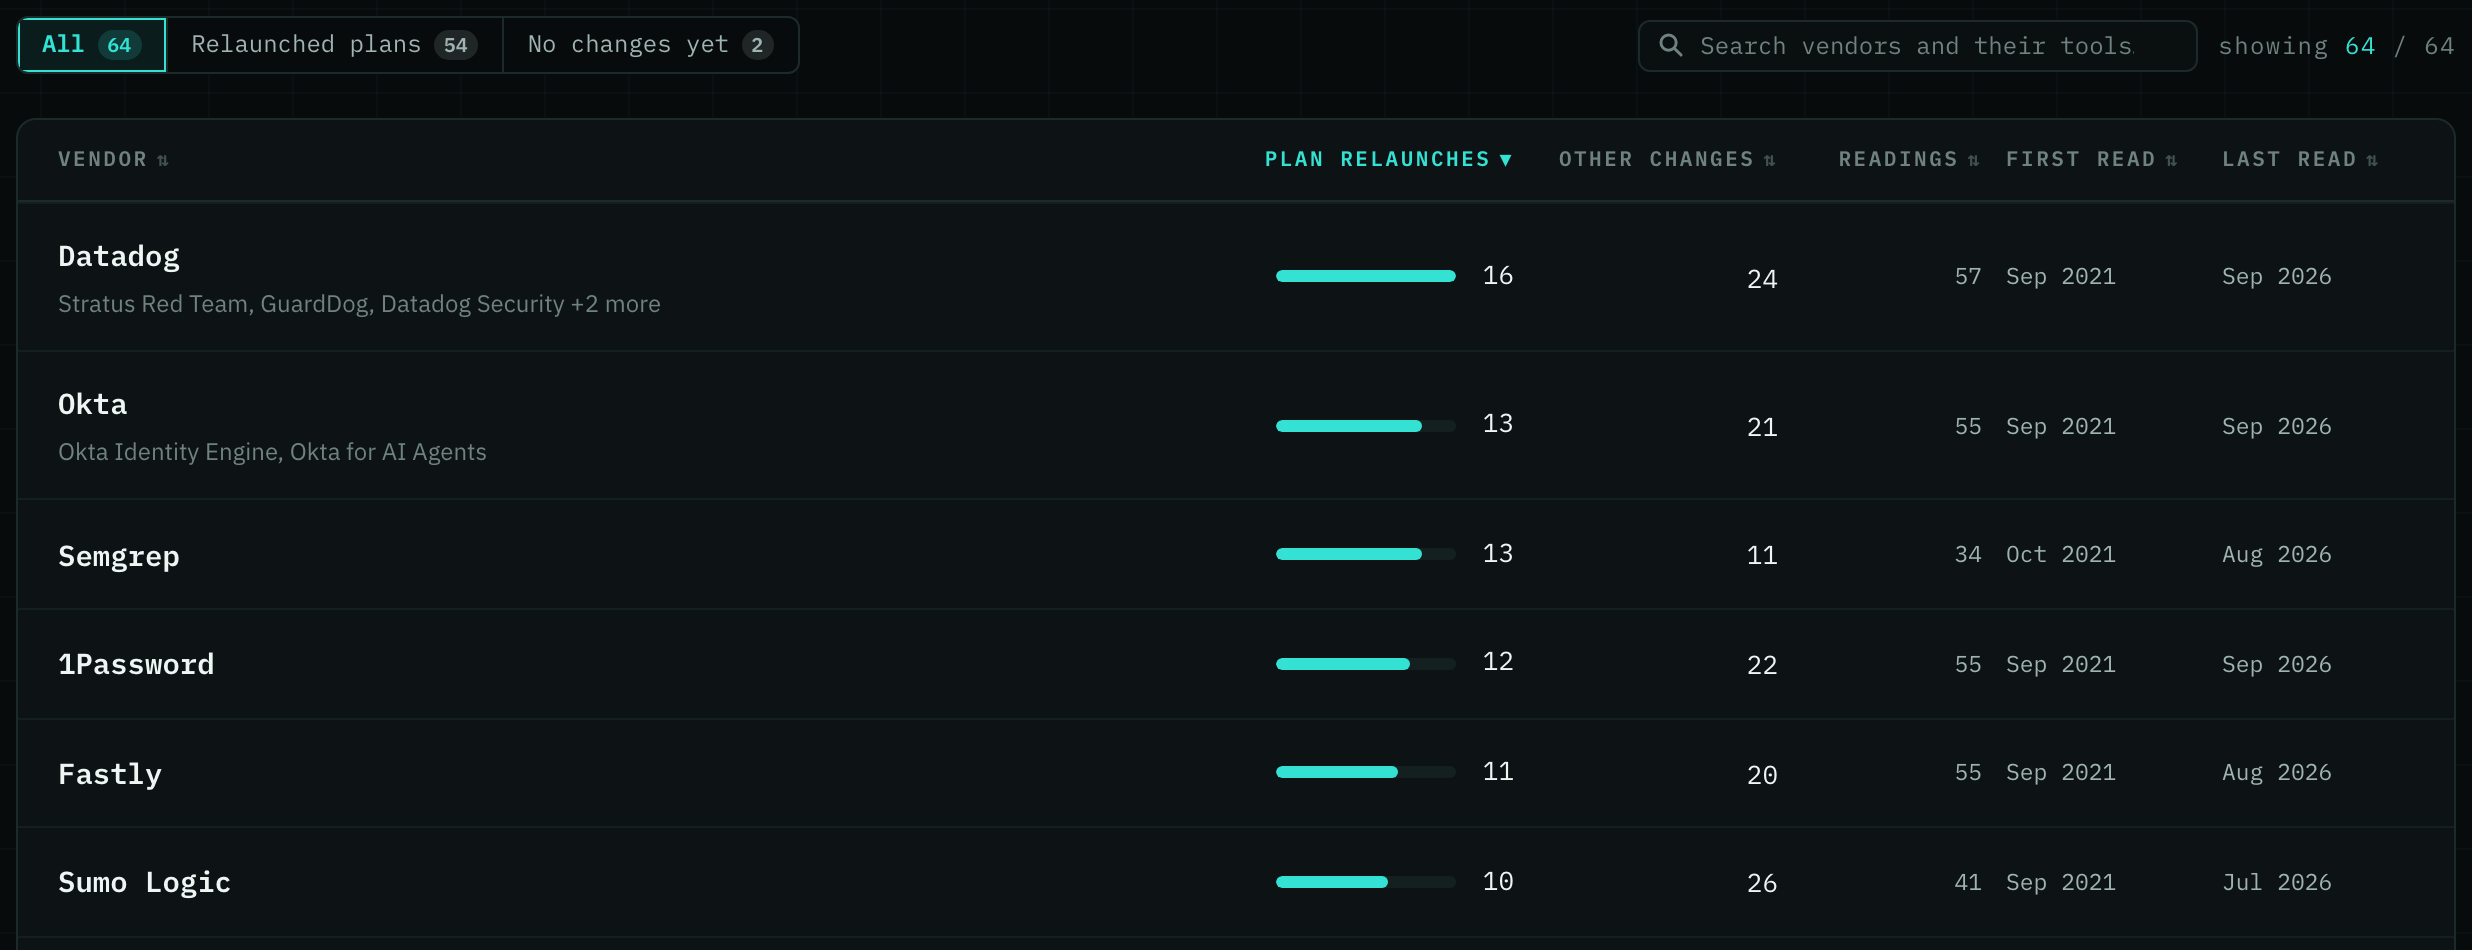
-
You can now choose which tools get a Grep Report. Under Monthly Reports and Quarterly Reports on your account page, Edit opens a list of the tools you named in your Greps: untick any you don't want and save. Each cadence has its own list and its own limit of 10 reports, busiest tools first, so leaving a quiet tool out makes room for another. Categories do not get reports, only named tools do.
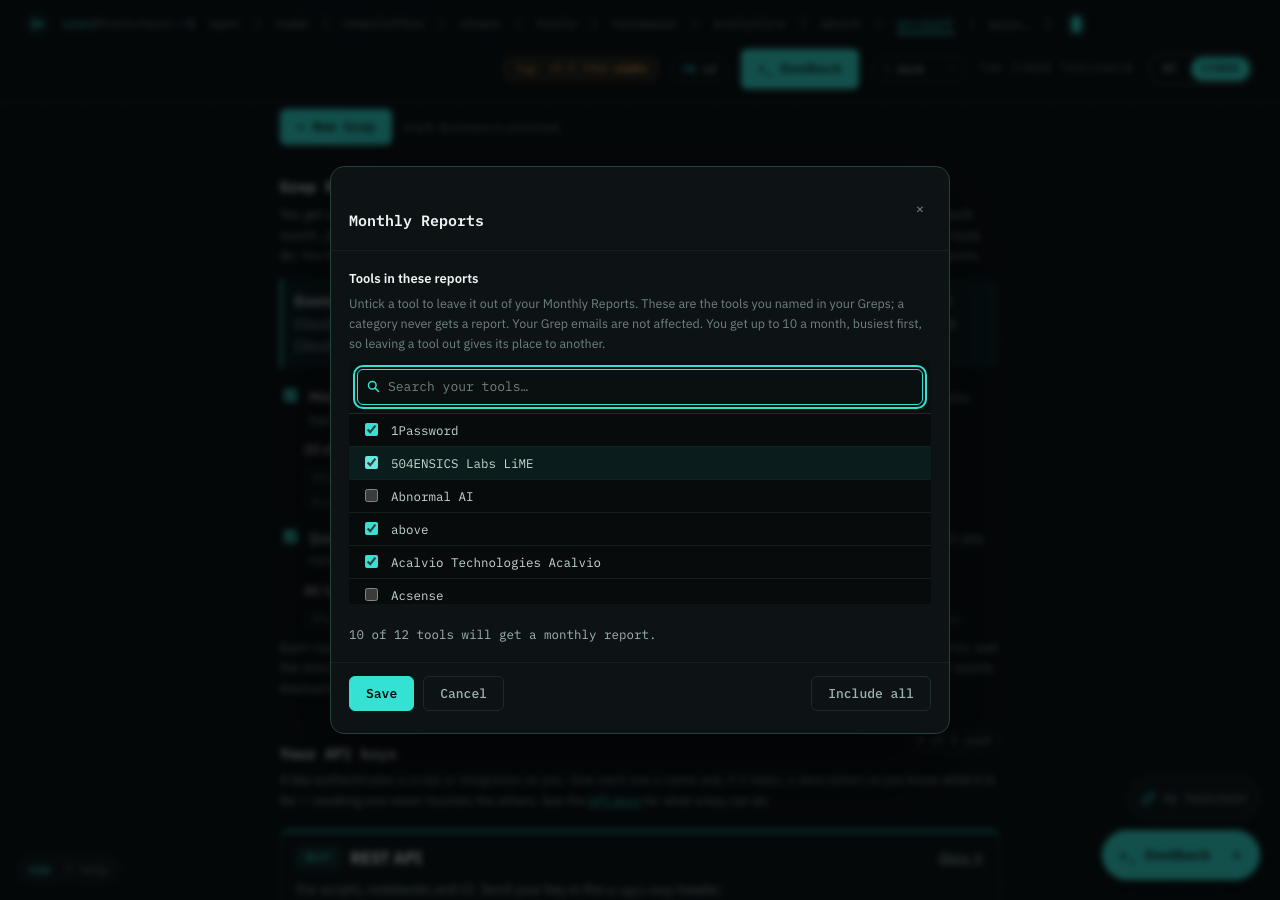
-
The API keys card on your account page is easier to use. The REST API and the MCP server each get their own panel, with what it's for, a link to the docs and a button that copies the full address. Each key now shows its name, the last characters of the key, its description and when it was last used, with a clear Revoke button.
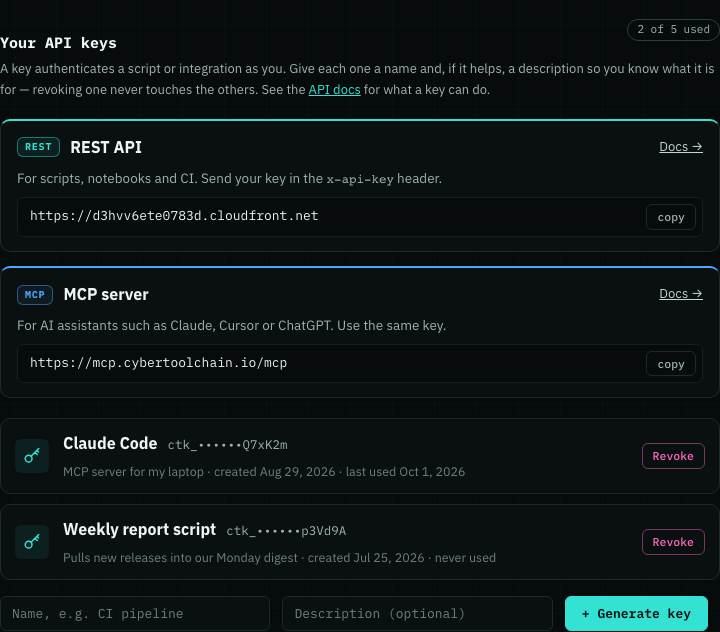
-
The plans page now says plainly what each plan sends you and when. Tail arrives every day, Grep, Diff, Uniq and Perf each say what you receive and on which day, and the persona editions and extra reports have their own rows, so you can pick a plan without guessing what is in it. The FAQ and your account page use the same wording.
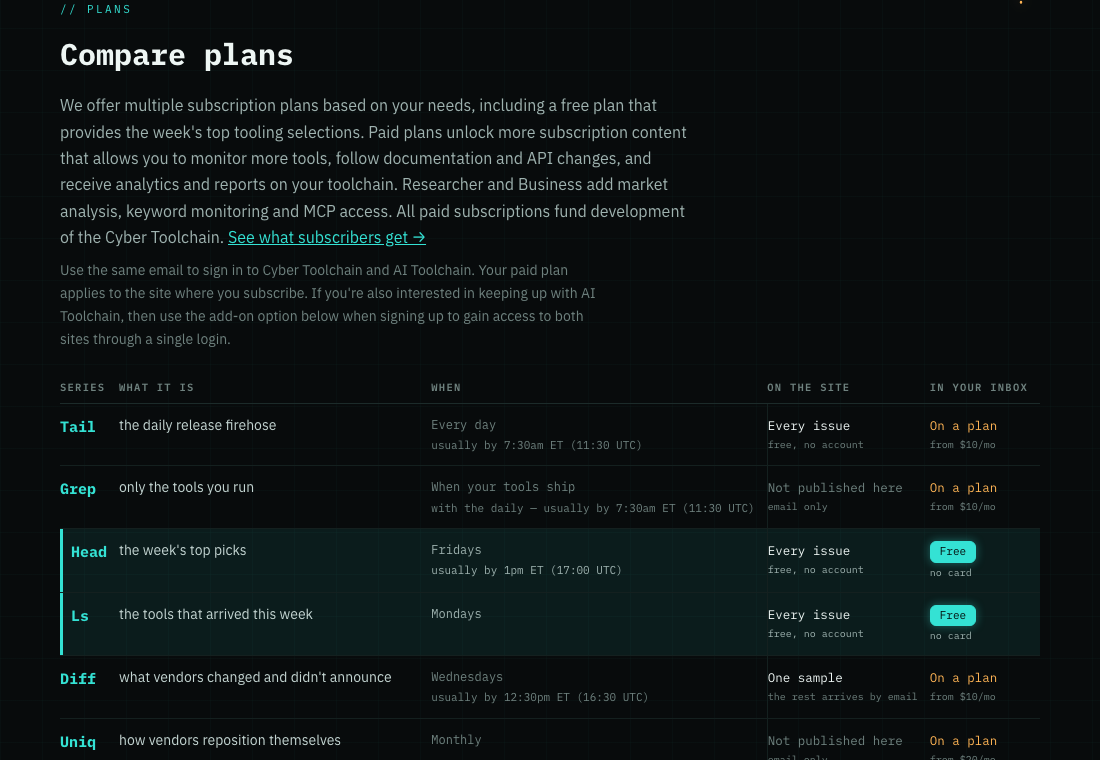
-
Vim keys now work the way your fingers expect: h and l move left and right between buttons, and h j k l turn the issue view dial and browse the issue picker, which opens your pick on Enter. The keyboard help window also matches your color theme instead of flashing a dark terminal over a light page.
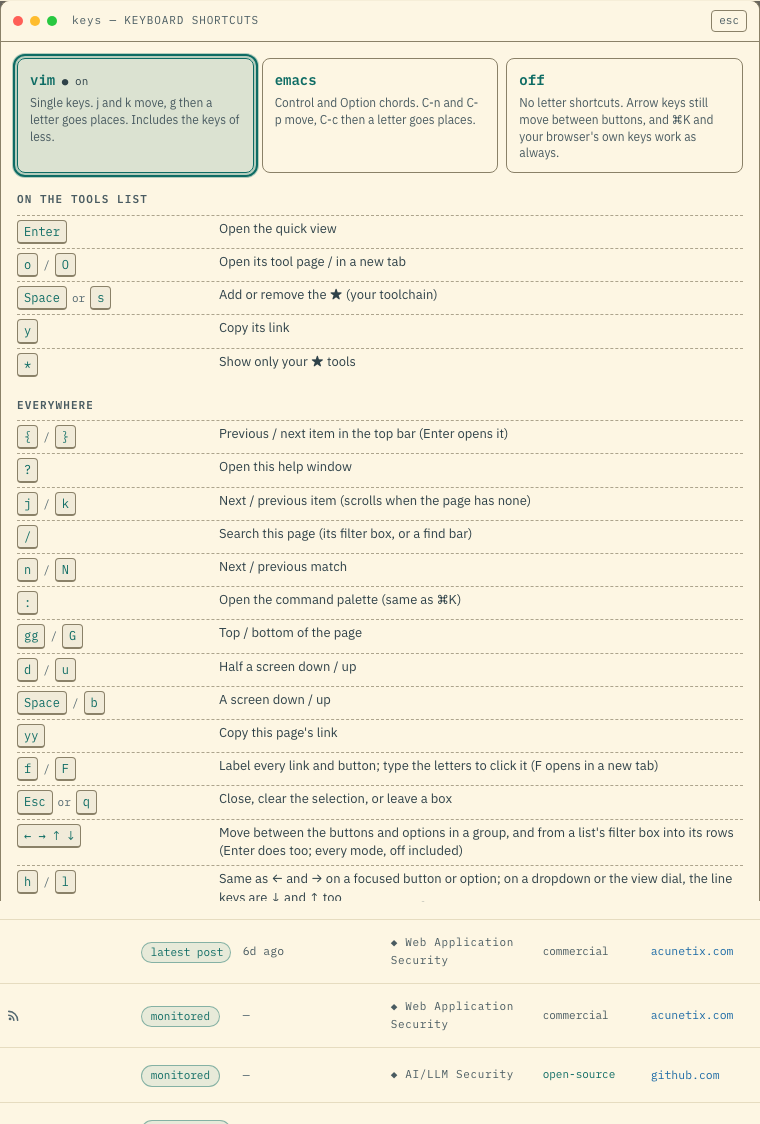
-
Cards and panels now share one shape, edge and corner across the site, and every card you can click shows a clear outline when you reach it with the keyboard. The article topic filter works again, and the home and articles pages no longer scroll sideways on a small phone.
-
Each monthly and quarterly top pick now opens on a card you can share, next to why we picked it. Below it, How it won lays out every Head week the pick was chosen from and traces the product through them, so you can see what it beat and how often it made the list. Each release now lists its new features one line at a time, and you open only the ones you want to read.
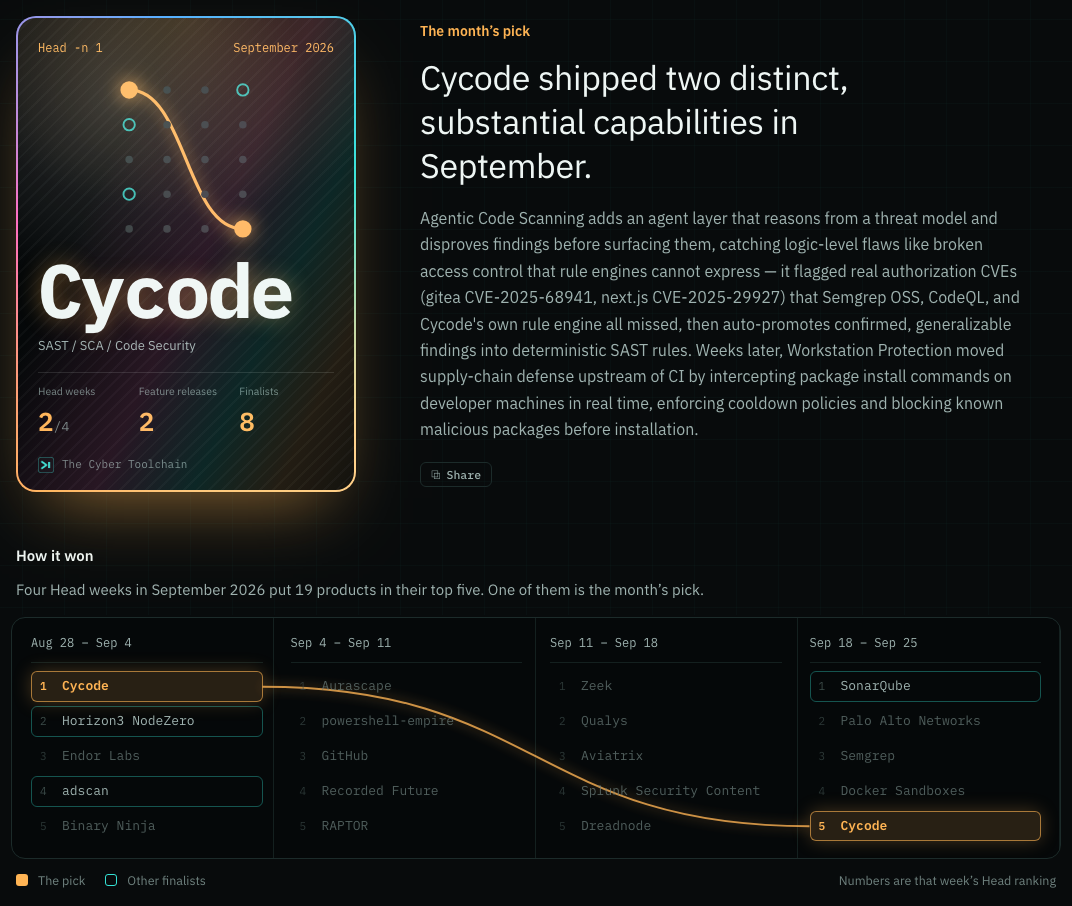
-
On the plans page, See what each persona keeps now opens a side-by-side preview instead of a page of text. Pick a persona to see a real entry as written next to how that persona's edition reads it, plus what it keeps and what it leaves out, so you can tell which edition fits you before you choose a plan.
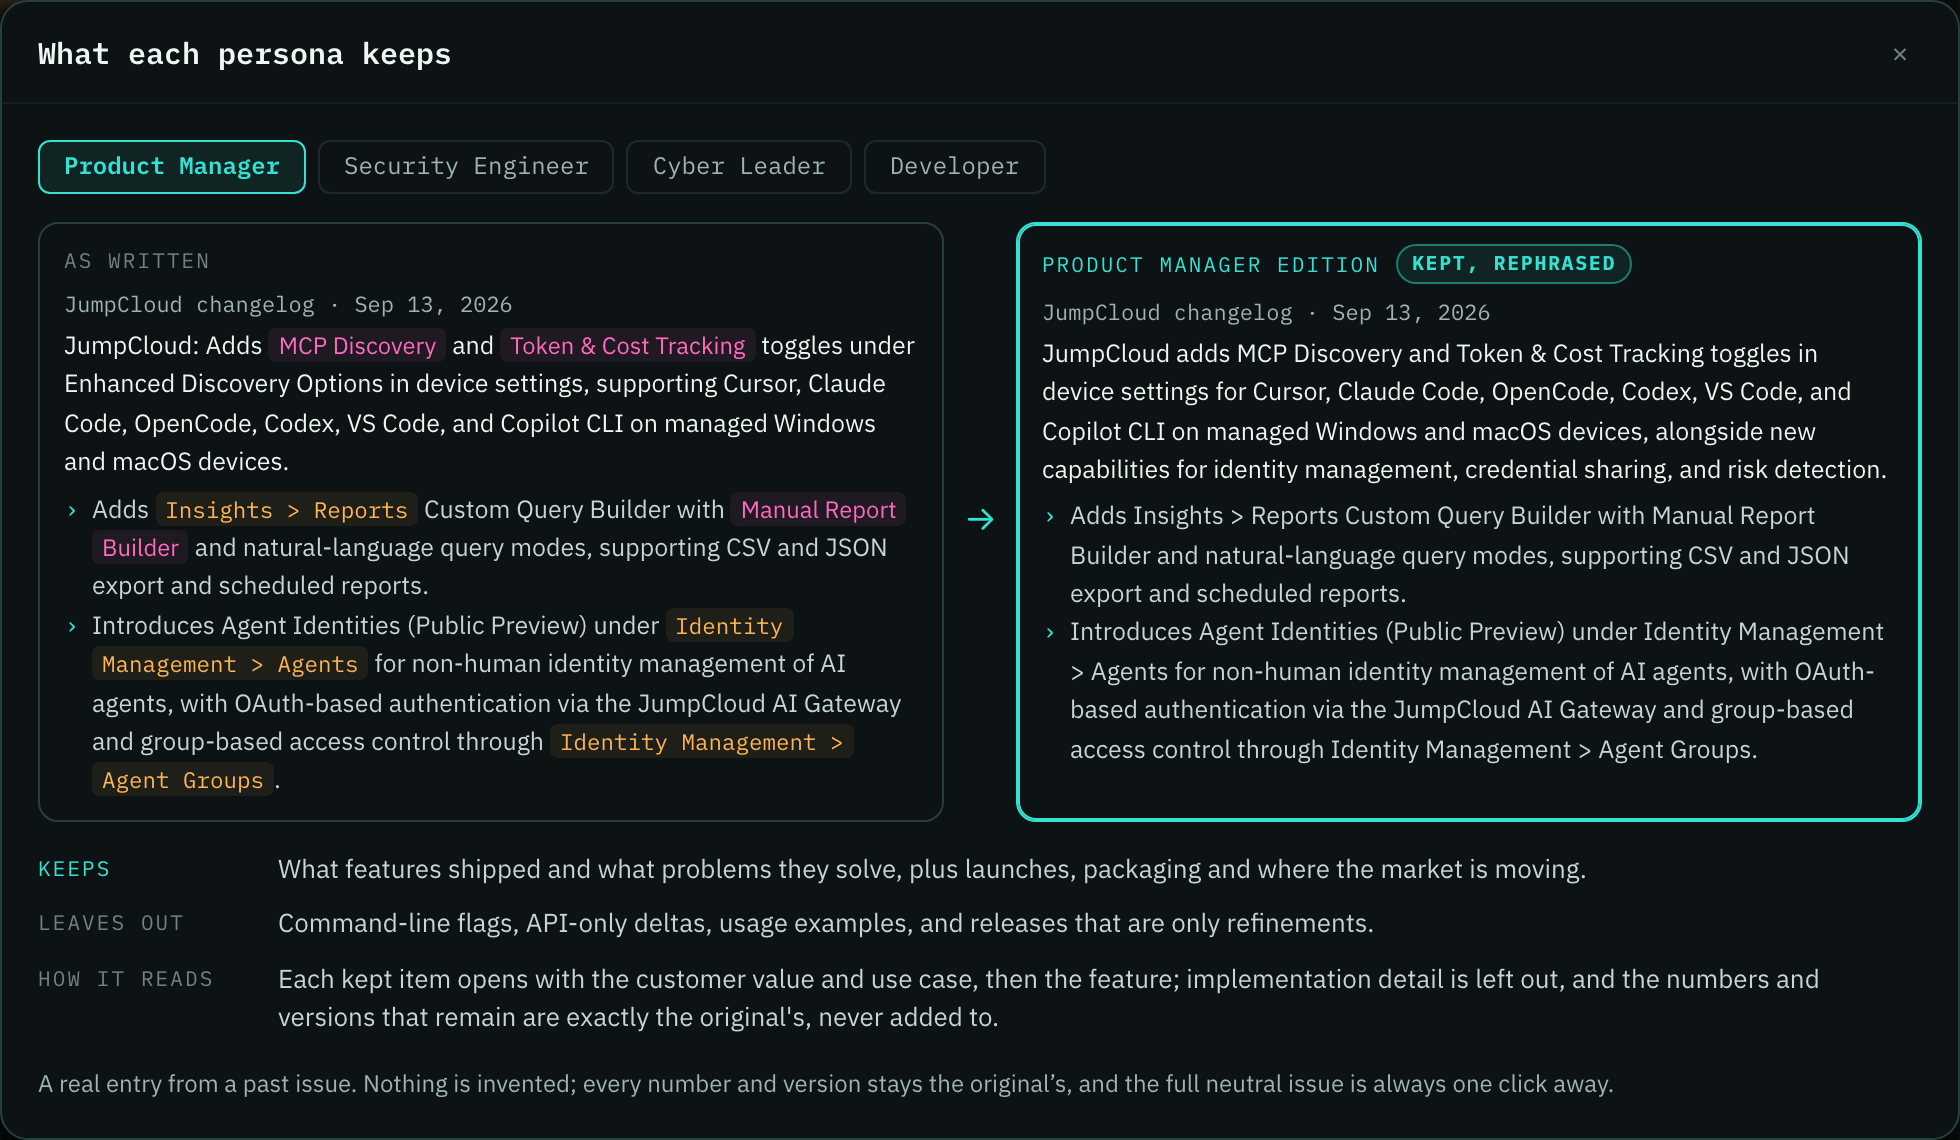
-
Tables, search boxes, dropdowns, tabs, tags and pop-up windows now look and work the same on every page, so once you know one you know them all. Everything works from the keyboard: Escape closes any menu or window and puts you back where you were, search boxes clear with Escape and tell you how many results match, and sortable tables say which way they are sorted. A chart or list that fails to load now says so and offers Try again, instead of showing Loading forever.
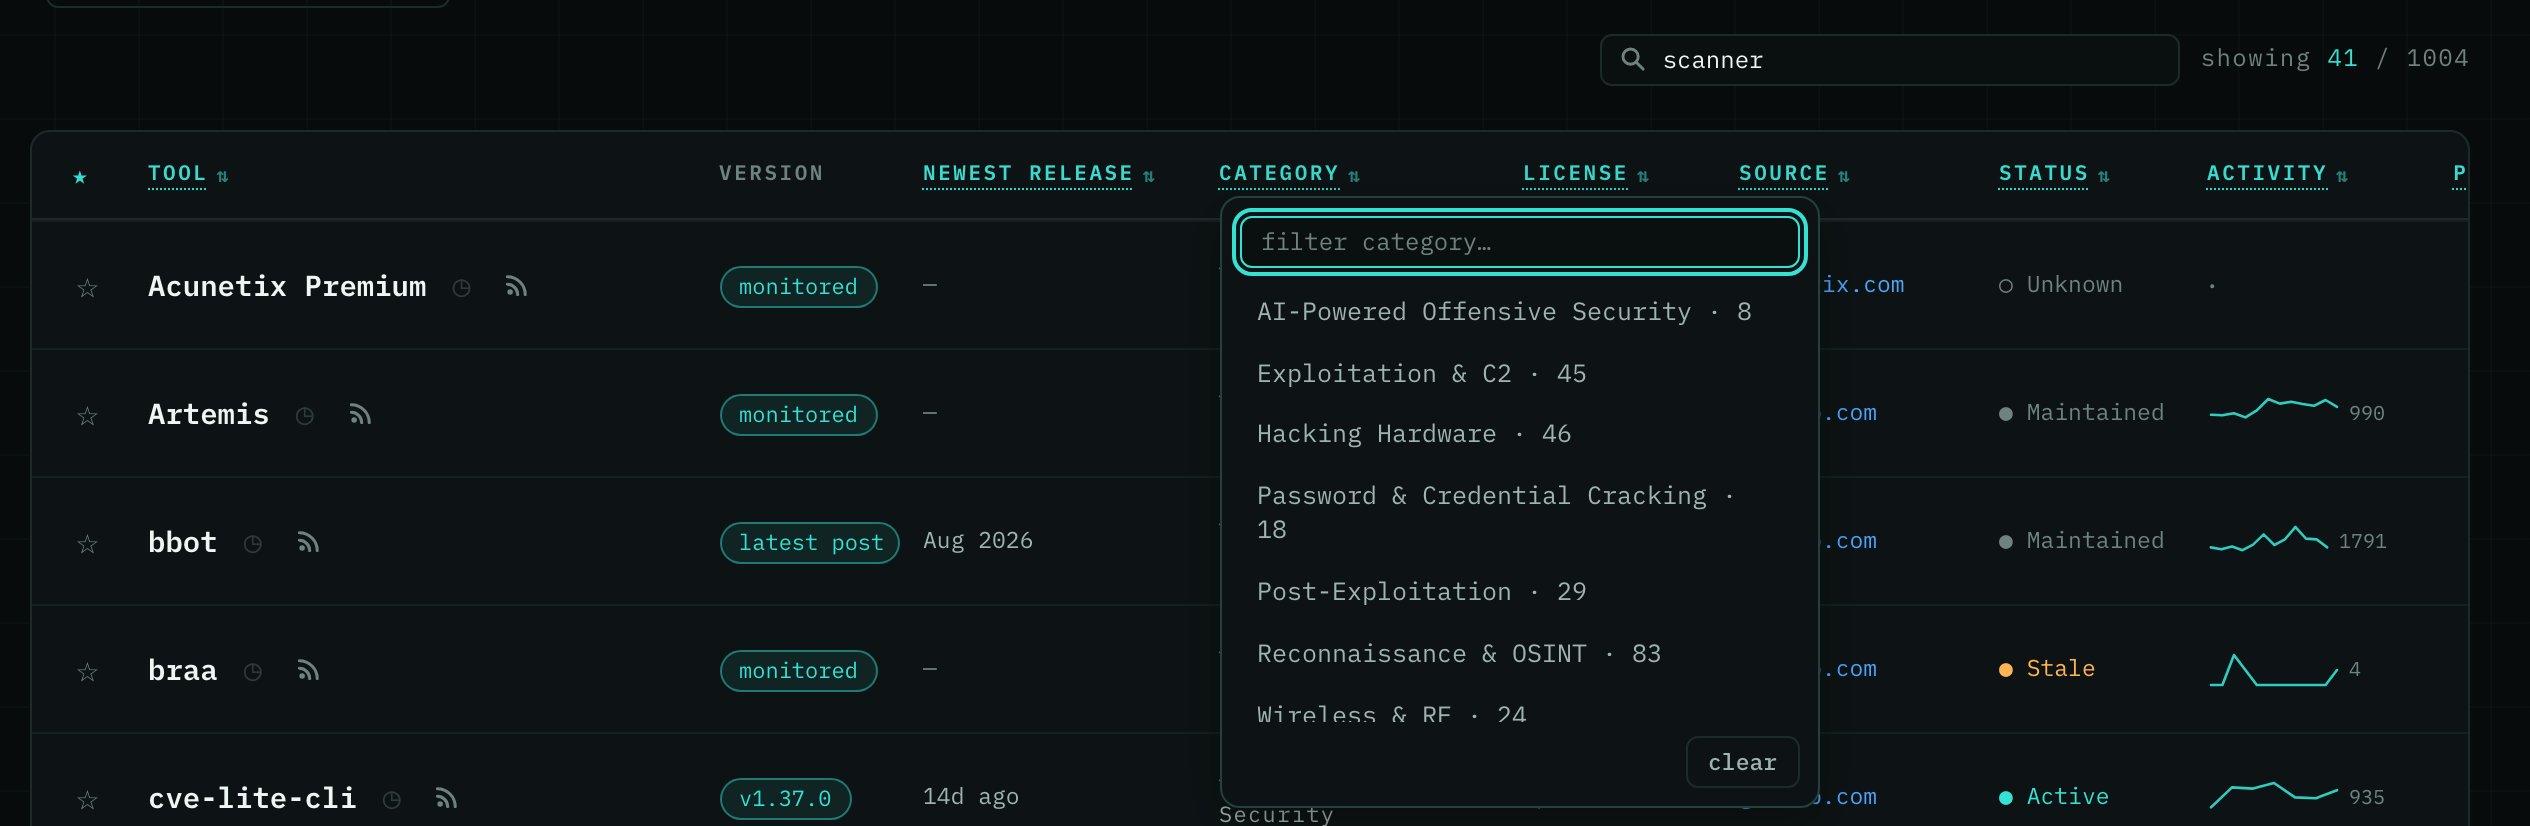
-
The home page's monthly top pick now tells you why it won. You see what the product shipped and why it mattered, instead of a one-line verdict.
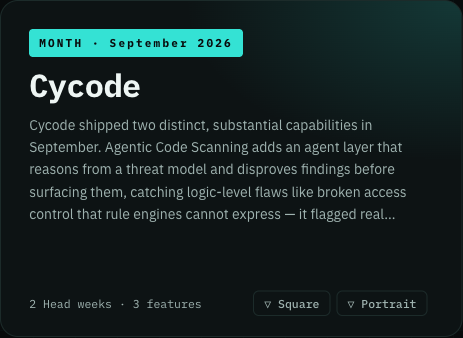
-
Small print is easier to read across the site. The top bar, the delivery table on the plans page and the captions on the weekly top picks were a shade too faint, and the light and sepia themes get slightly deeper greys and accents, so every page now meets the standard readability bar in all four themes.
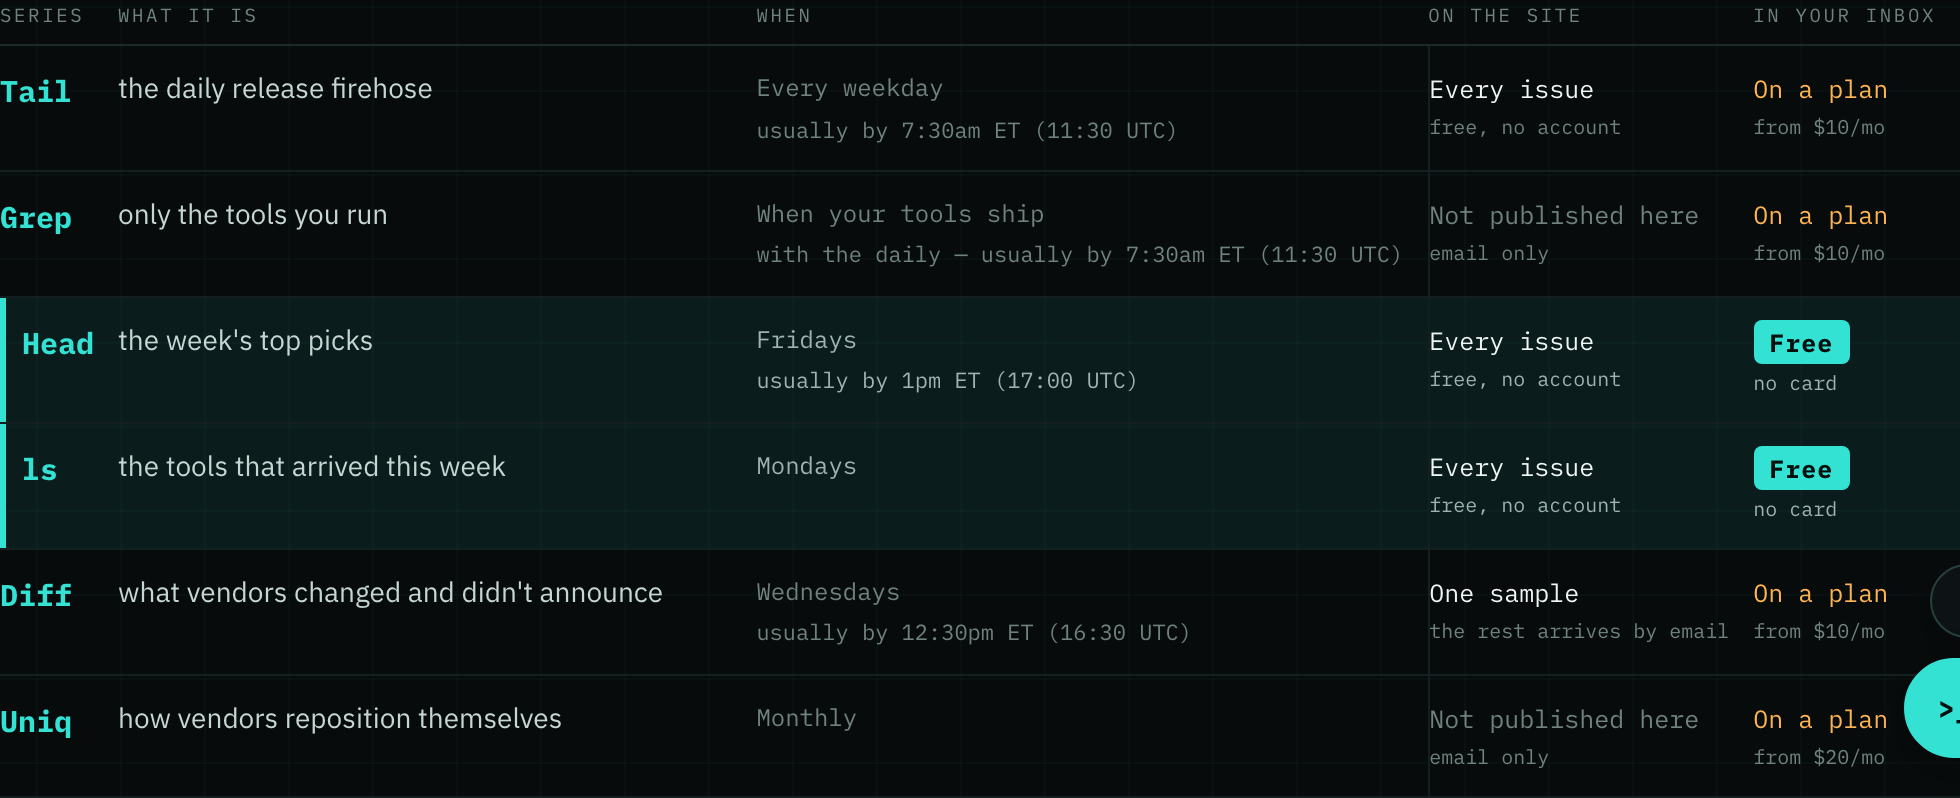
-
You can now use the site without a mouse. Press ? on any page to see the keys that work there: in vim mode, j and k move down a list, Space stars a tool, and g then t opens Tools. Pick emacs for Control keys on a Mac, or off to leave letter keys to your browser and screen reader. The arrow keys move between buttons in every mode. Signed in, your choice follows you to every device, and you can change it under Customization on your account page.
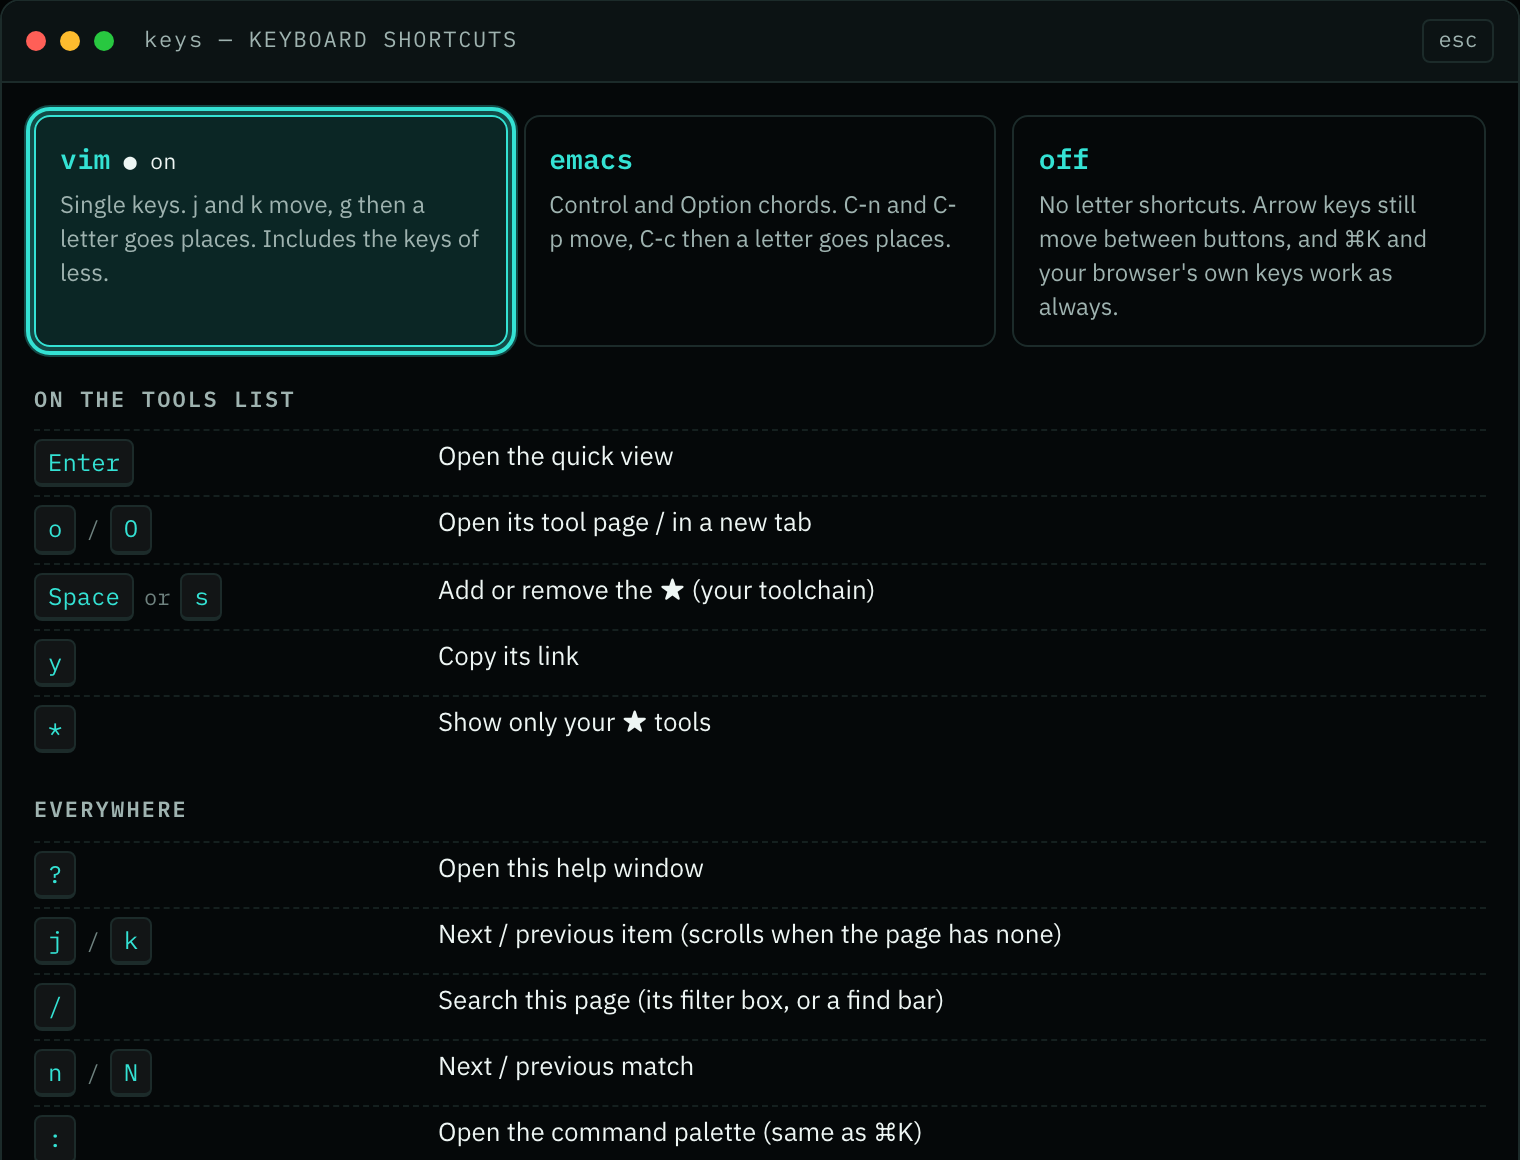
-
Your monthly Uniq email now shows what changed in the cyber tools you watch, backed by each vendor's own dated release notes, with what to check before you upgrade. You can see which of your tools moved without reading every changelog yourself. Included with Practitioner, Researcher and Business.
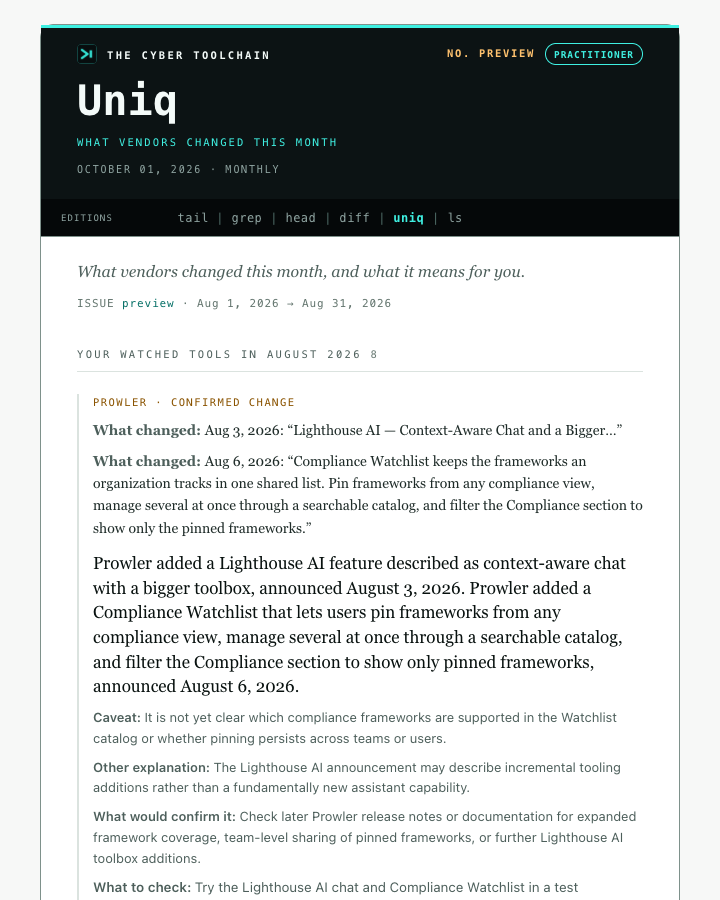
-
You can now track the hardware you hack with. The new Hardware tab lists 30 devices, including Flipper Zero, HackRF One, the WiFi Pineapple and the rest of Hak5's kit, Proxmark and Chameleon RFID tools, and the boards you use to probe other hardware. Each one shows its price and stock on the vendor's store, checked daily, its spec, where it stands in availability, and the firmware releases that run on it. So you can see what a device costs and whether it is in stock before you go looking, and catch a sell-out or a price move in your daily issue.
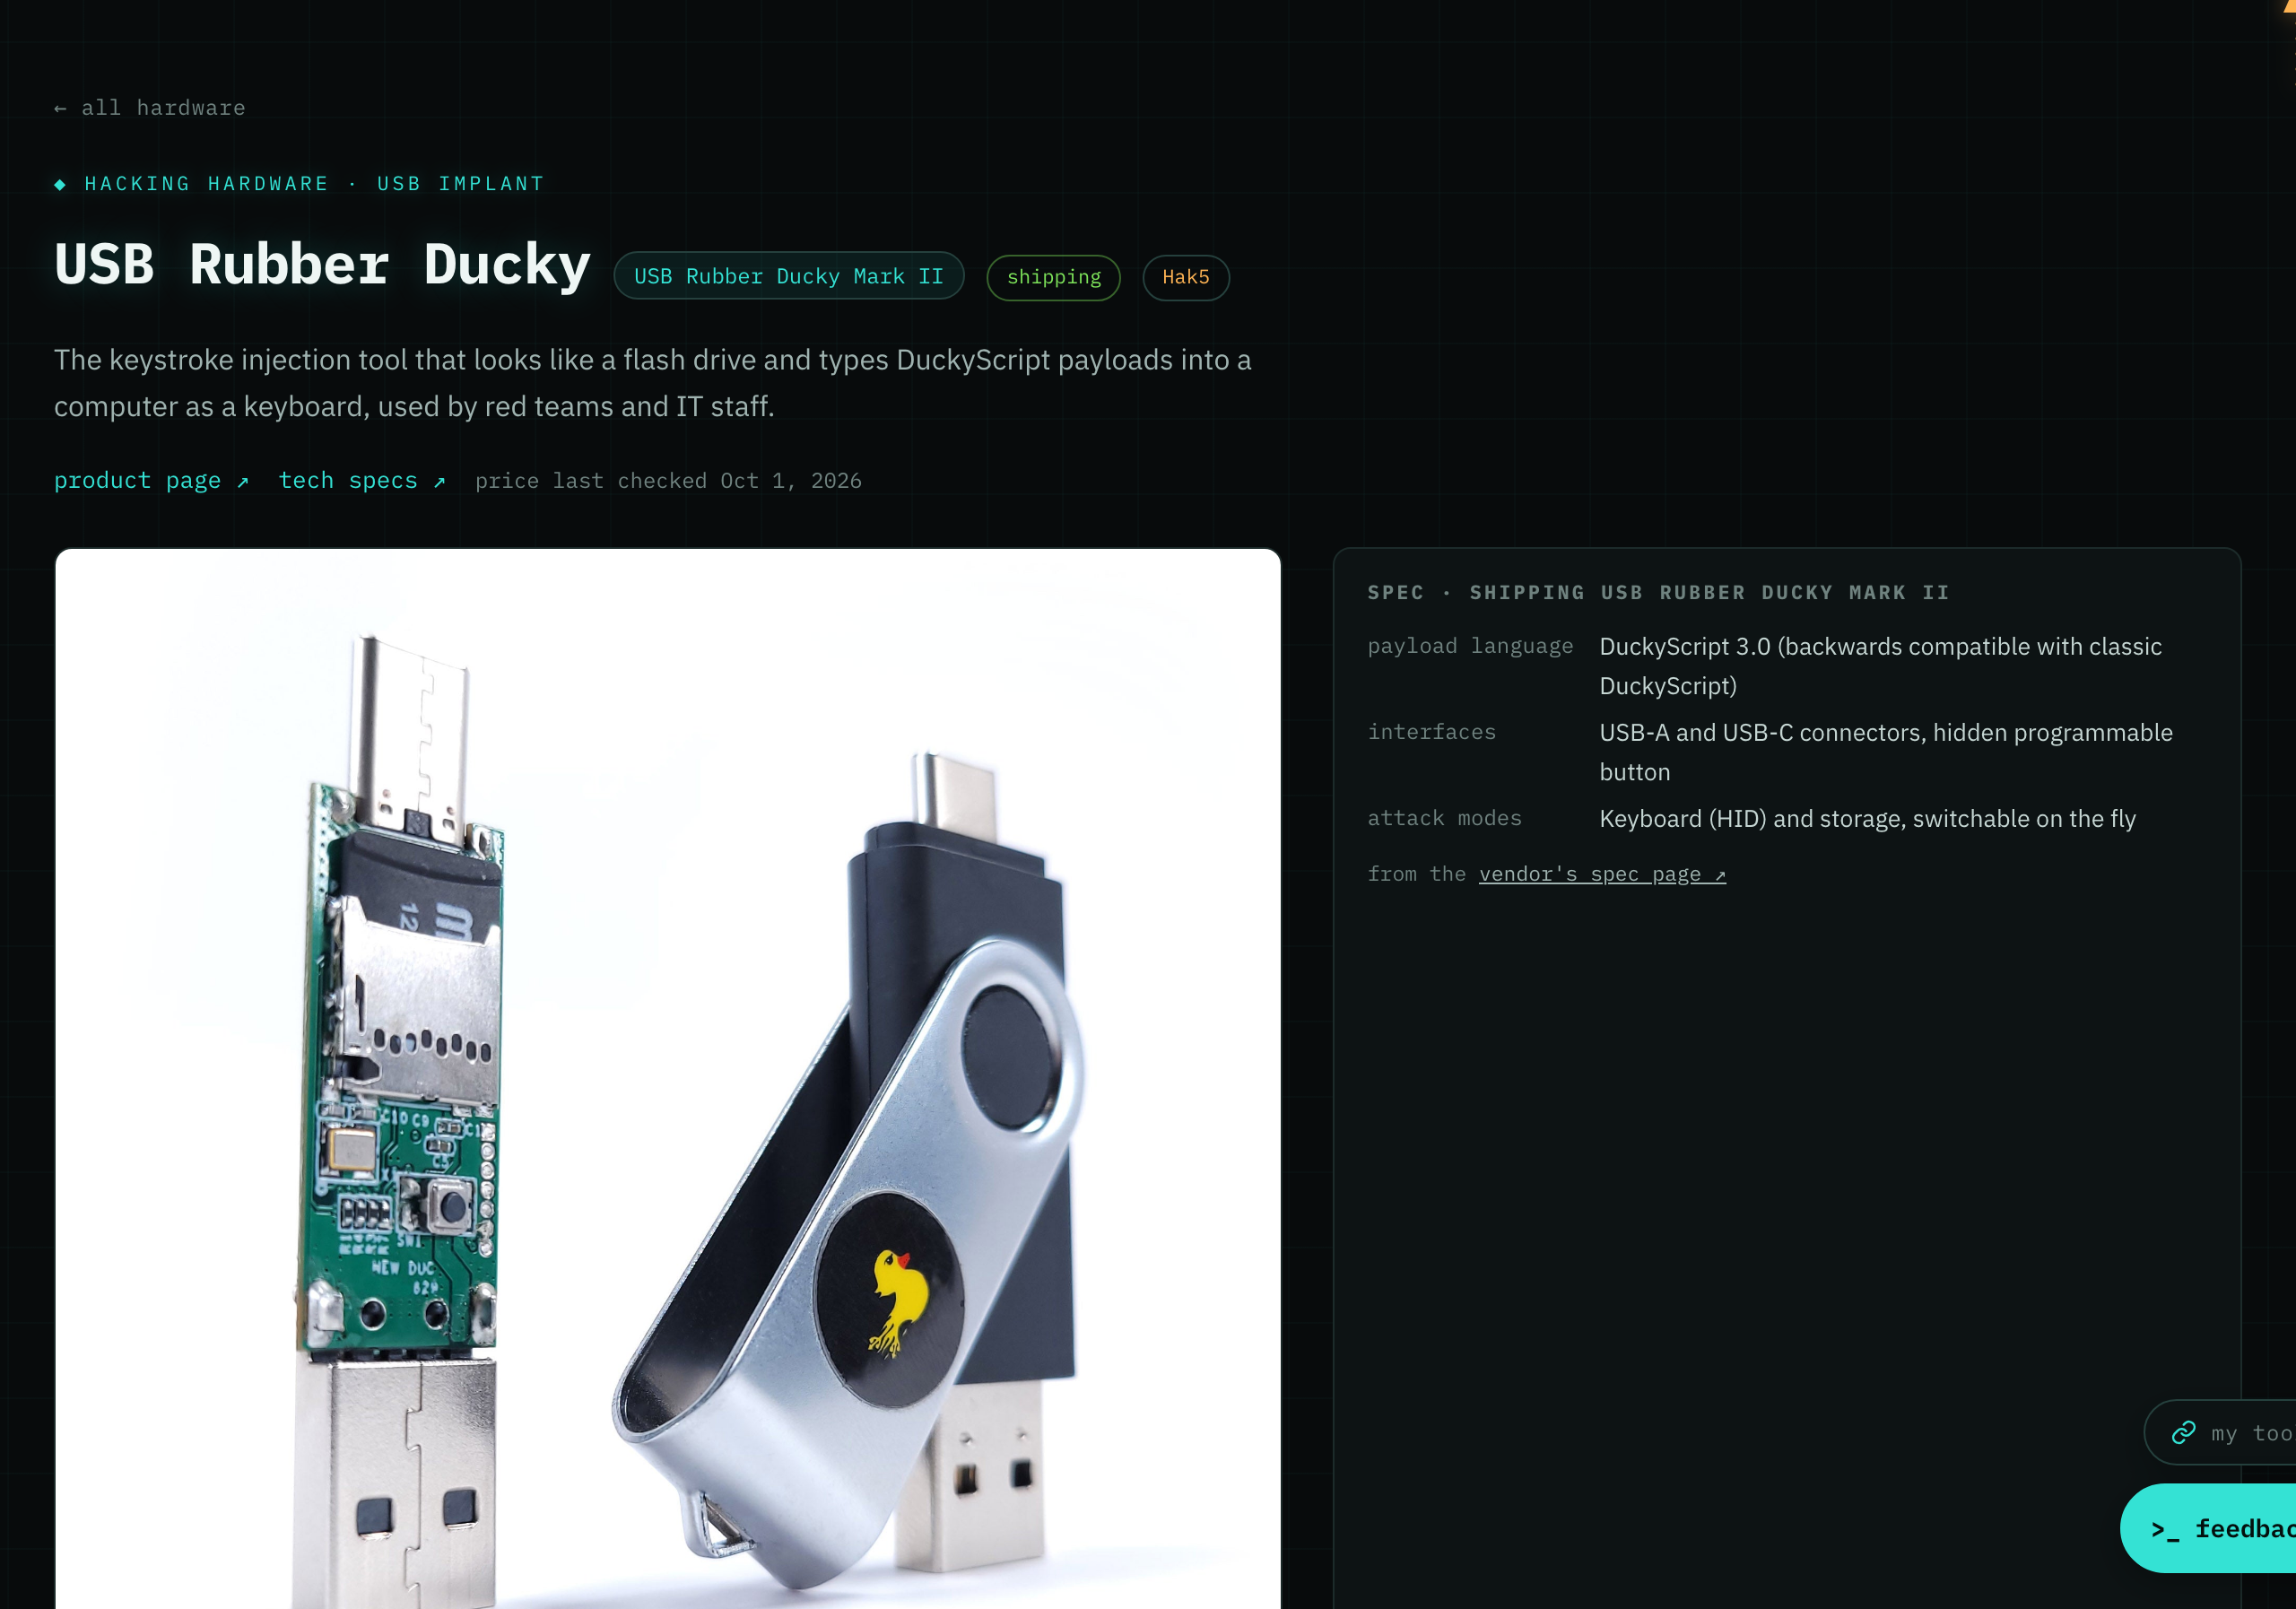
-
Every row in the tools list is easier to read. The faded "rss" label is now a small feed icon that still copies the feed, and tools without maintenance data show a readable "○ Unknown" instead of near-invisible grey. The yearly price on the plans page is clearer too.

-
Code samples in articles now sit in the same terminal window as the rest of the site, with a copy button, so you can paste a command straight into your shell.

-
Buttons now look and work the same on every page. The main action is always the filled button, and quieter actions like copy or export share one outline style, so you can tell at a glance what each button does. A few buttons that showed in the wrong font now match the rest of the site.
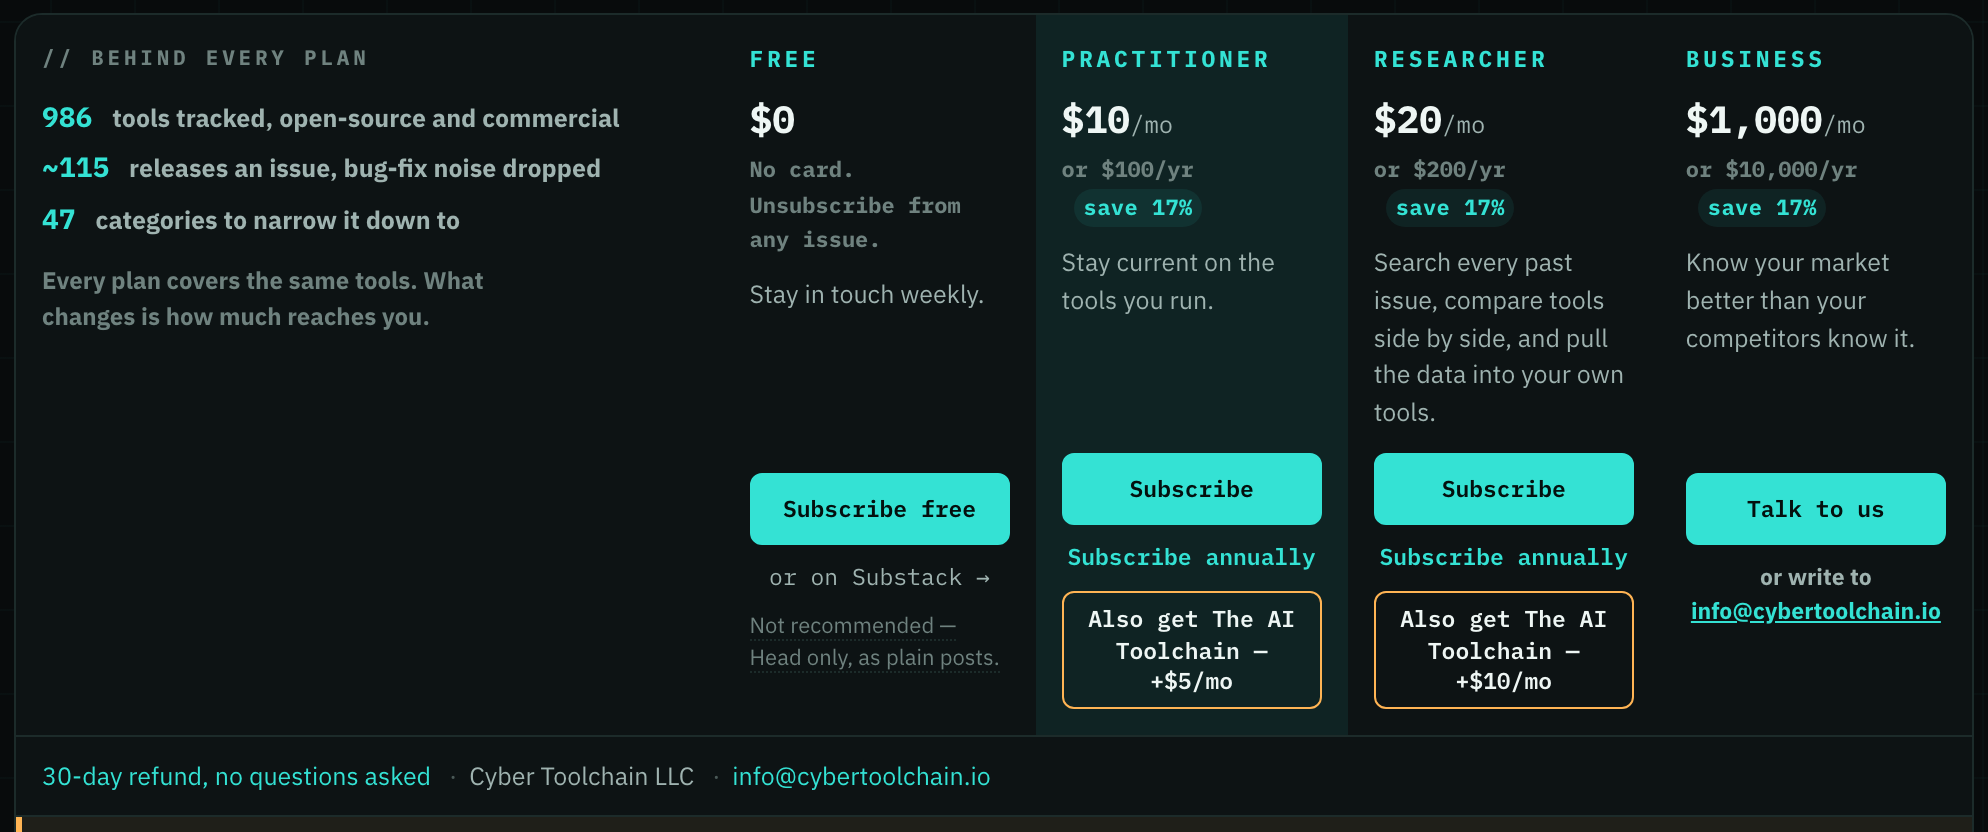
-
Tool pages now sort a tool's features into named capabilities, so you can see what a tool can actually do instead of a short list of loose areas. Wireshark went from 3 features to 53 across 20 years, grouped under headings like Protocol dissection, Display filtering and Packet capture, each with its release history.
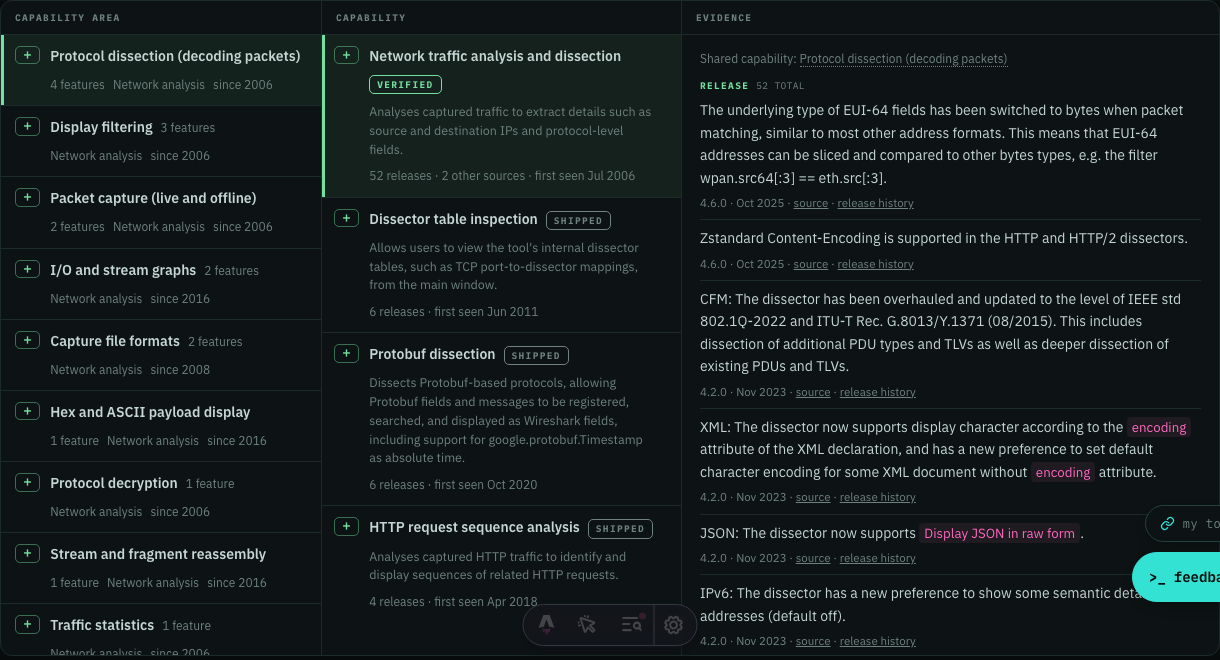
-
See which cyber tools are shipping AI. A new chart on Analytics shows, quarter by quarter, how many of the open-source cyber tools we track shipped an AI or agent feature, or MCP support, in their own release notes. In 2026-Q3 it was 12.4%, up from 7.7% a year earlier and 2% in early 2023, so you can watch AI reach the rest of the market.
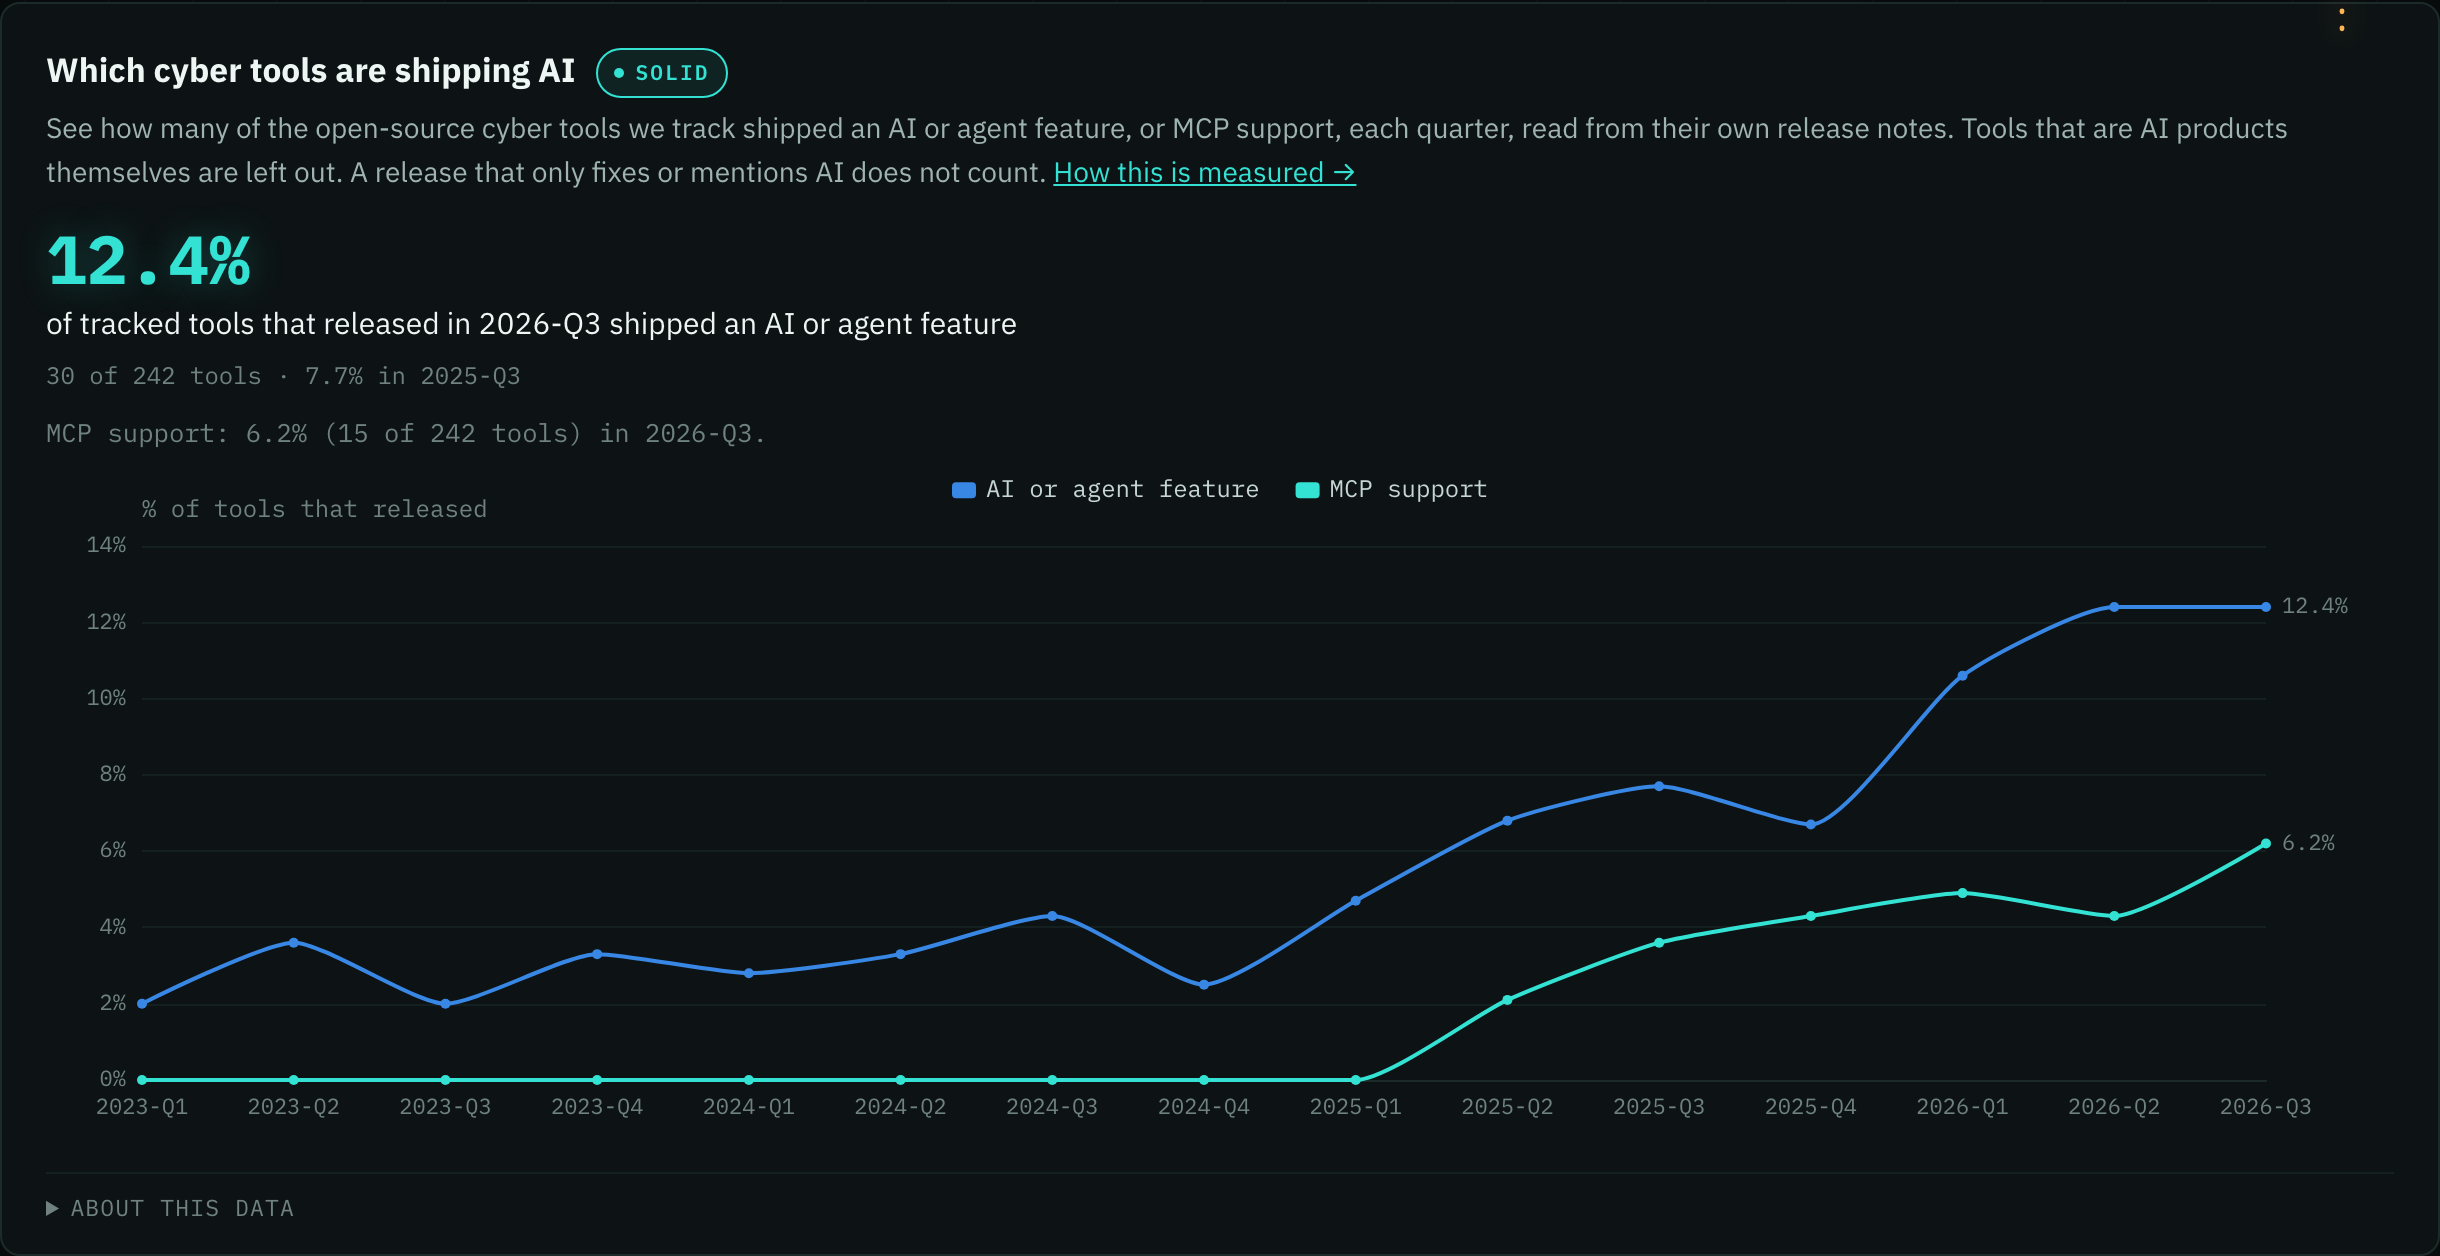
- Top pick pages are easier to read. The headline above each write-up is now one short line in the same type as the rest of the site, instead of a thin font that could run to eight lines. The dates beside each release now match the site's type too.
- Ask your AI assistant which tools can do something specific, like detect SSH key reuse or flag employees using AI services, and get every vendor that says so, with a link to the blog post or doc where they said it. Many of these capabilities appear in no release note.
- The plans page, the FAQ and the site summary no longer say every analytics chart is free. The tools directory and many charts are open to read with no account, and Researcher and Business add the charts and signals published nowhere else, so you know what a plan adds before you subscribe.
- The About page is shorter and easier to scan. It now opens with what we are, the technical intelligence source for cyber tooling made for practitioners first, instead of a long rundown of every newsletter. The Host section also covers Jon's product and engineering background, so you can see who is behind the picks.
- Every table on the site now works from the keyboard, not just the tool list. Press j and k to move through datasets, hardware, vendors and the rest, and Enter to open a row. Filter a table, press Enter, and you step through only the matches.
- Press ⌘K and type hardware, models, vendors, api or mcp to jump straight to that page. Before, the search found tools with those words but not the pages themselves.
- Researcher and Business readers also get the month's wider market findings in the same email, each with its sources and caveats, so you can check the evidence before you act on it.
- When none of the tools you watch changed in a way worth reporting, you get a short note that says so. When we could not check a tool, the email tells you that instead of calling the month quiet.
- Tool pages now list features for 656 tools, up from 384. A feature is no longer shown as retired when only one flag or endpoint behind it was removed, so a capability that still works no longer looks discontinued.
- Uniq now opens with every acquisition and partnership the vendors we track announced that month. Each comes with a short summary written from the company's own announcement and how it compares with the year's other deals, so you can see who is buying into which category without reading a stack of press releases. The market section is also easier to read.
- Your Grep reports list now shows when each tool's next report is due, instead of 'pending'. Hover a date to see what it takes: the tool has to ship something that month, and rank among your 10 busiest. A tool that had a quiet month no longer looks like a stuck send.
- Ask your AI assistant which tools can do something, and each answer now says how the tool does it: where it watches (network, endpoint, identity), what data it reads (DNS logs, processes, sign-in logs) and how it collects that data. You can also ask for only the tools that work a certain way. That lets you tell a DNS-log detector from an endpoint agent before you compare them.
*
Sep 30, 2026
-
Samples now includes a full Head entry, the week's top pick, so you can see what the free weekly email carries. Each sample also says how many other entries were in its issue.
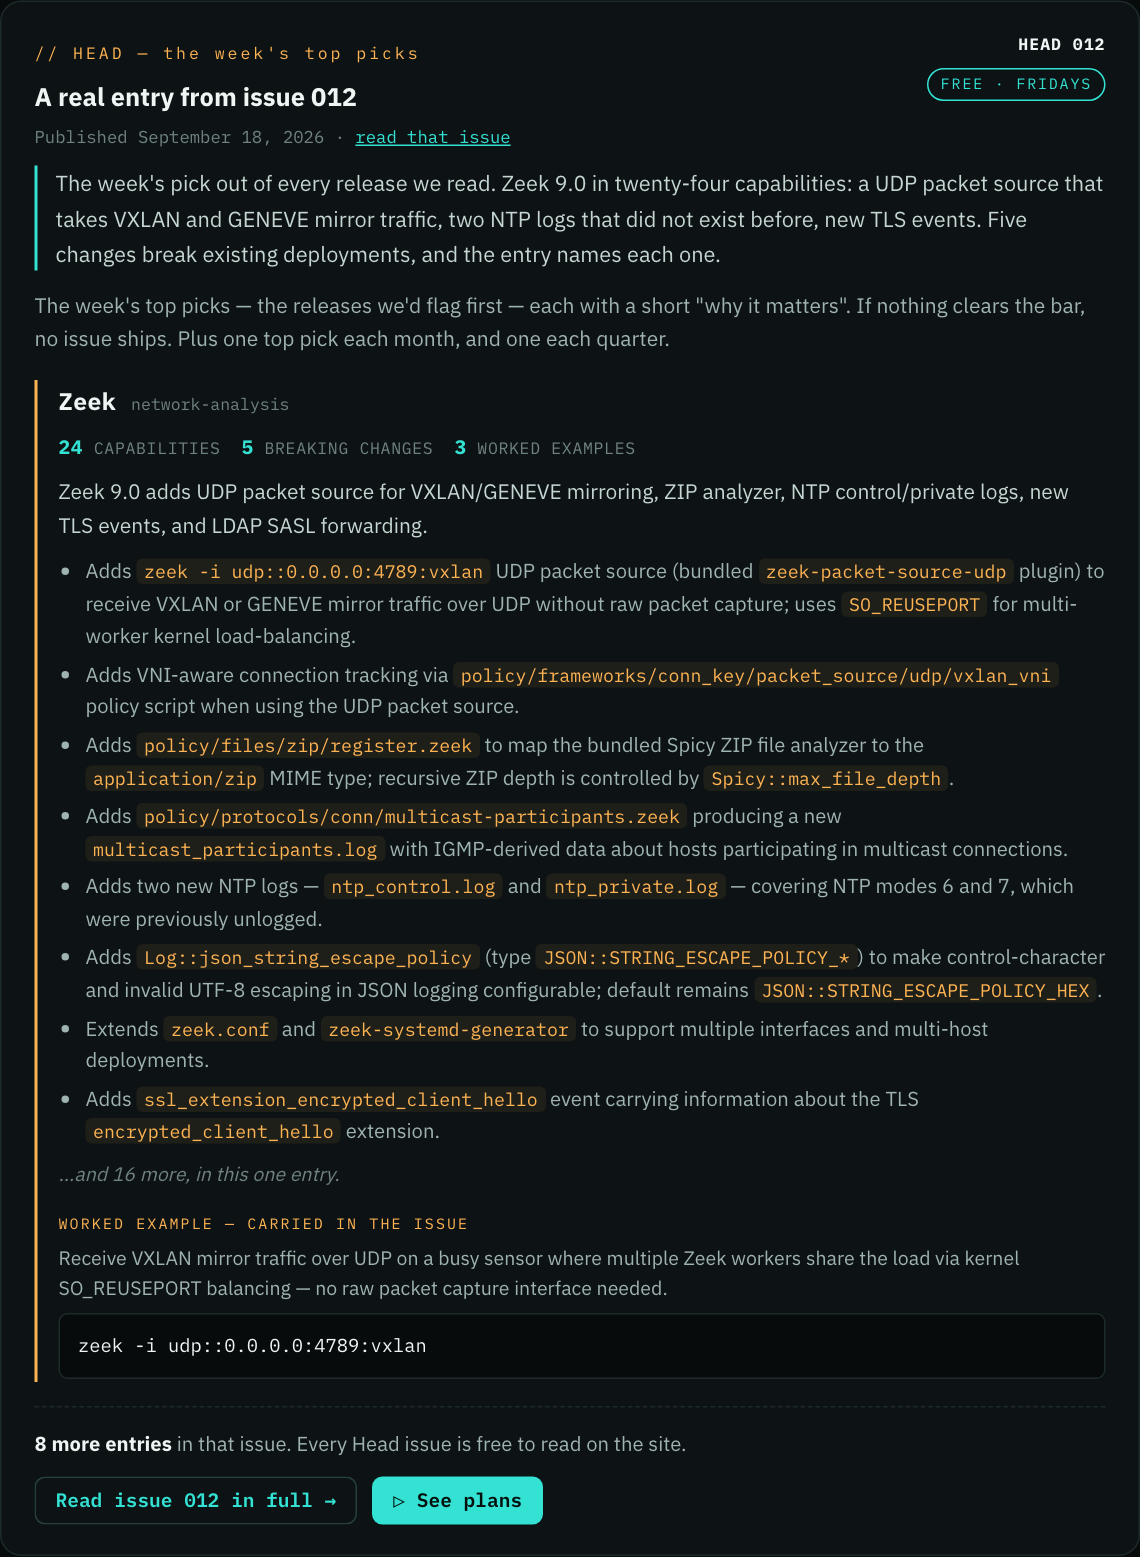
-
Conversation threads on tool pages now come with a short box that tells you what you can rely on: whether a change shipped, was merged, or is only proposed, which versions it applies to, and what to do next. Open 'From the thread' to see the exact lines behind it, so you can act on the advice without reading the whole thread.
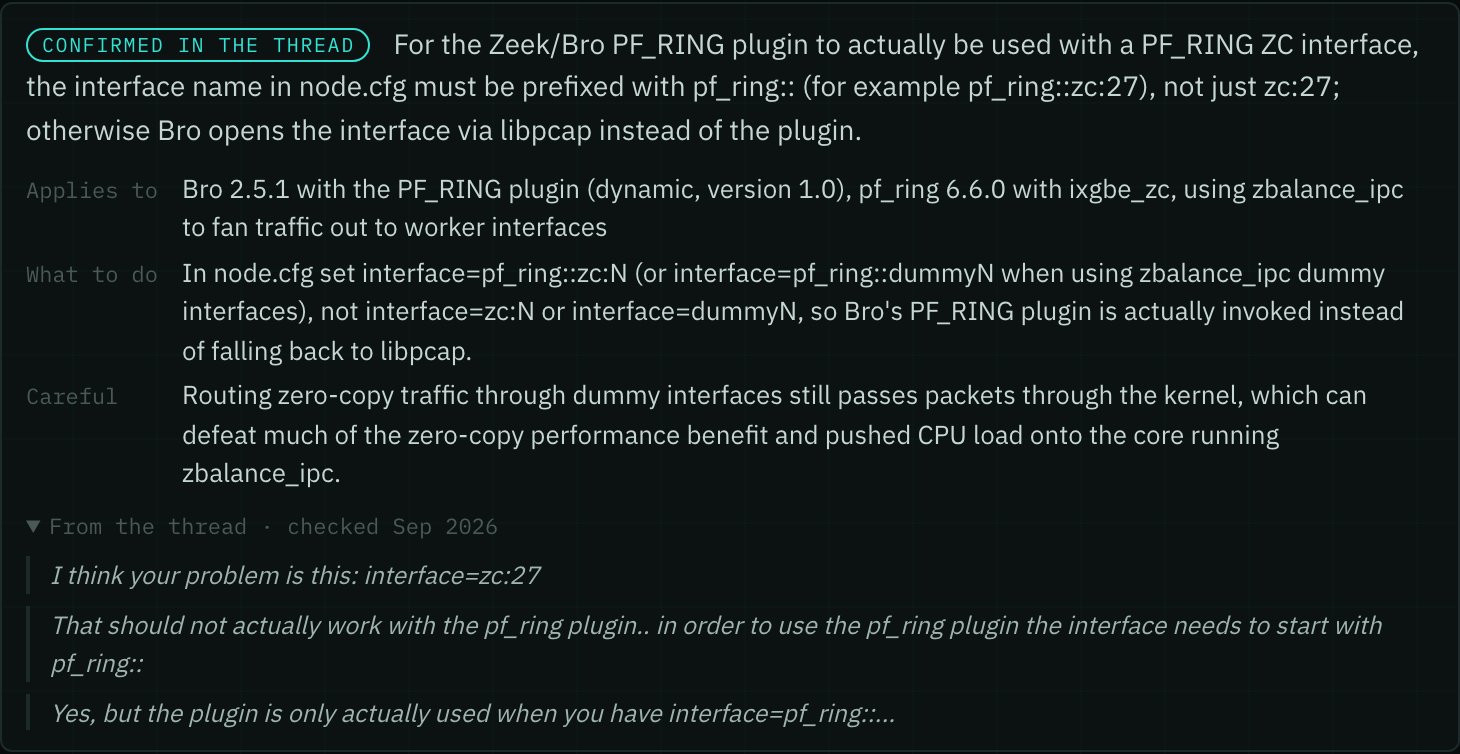
-
Head now grades each pick on novelty as well as depth and impact, weighted equally. We check every new capability against the history of all the tools we track, so features most tools already have stop crowding out the one that is actually new, and the first tool to do something gets the credit. Starting with this Friday's issue, each pick shows all three grades.
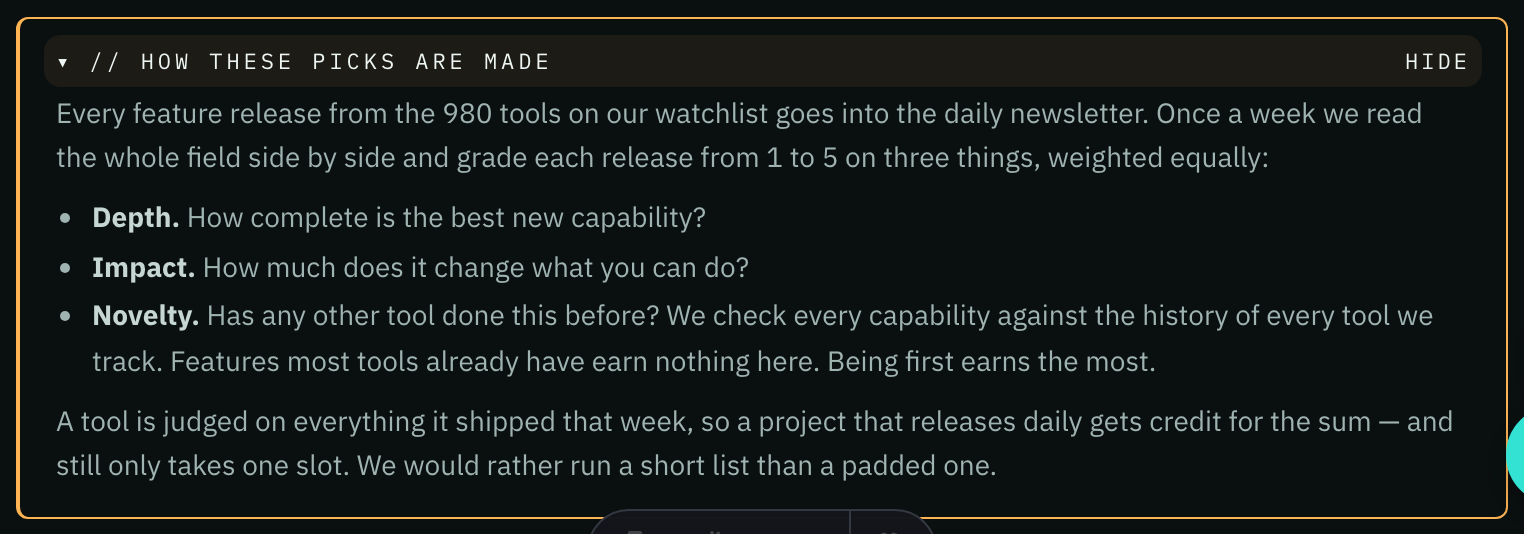
-
My Requests is now its own tab on your account page. Ask for a new feature, a new source, an improvement or a bug fix from one form, and follow every reply in one place, instead of hunting for a source-request card. Free accounts can now file feature, improvement, bug and other requests too; new-source requests stay with paid plans.
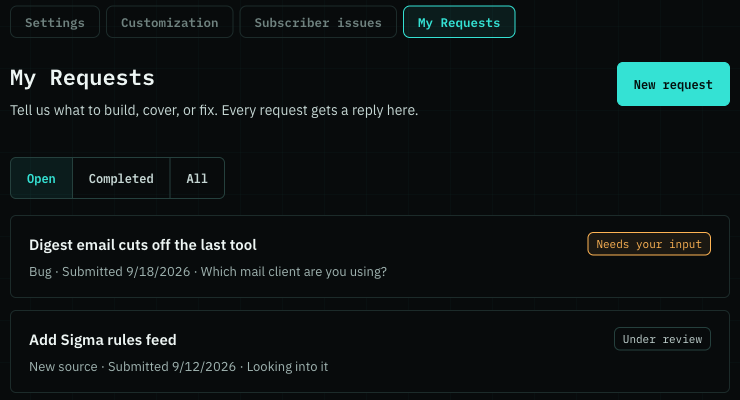
-
Compare now shows which plan opens each part, so you know what you're looking at before you read it. A key under the section buttons marks what's free, what every paid plan includes, and what needs Researcher or Business, and each section carries the same label. An empty section now says it has no data for those tools yet, so you won't mistake missing data for something locked.
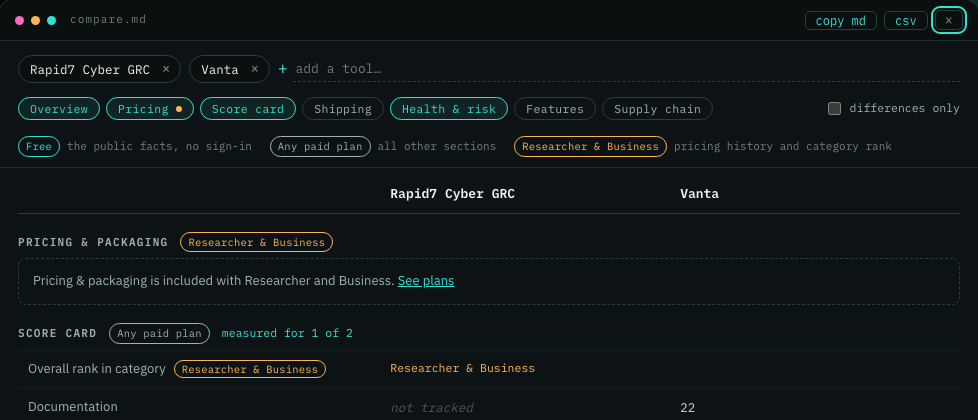
- Signing in is faster: type your email and press Enter to get your sign-in link, no mouse needed. And if a link has expired, the reminder in the email now takes you straight to the sign-in page instead of the subscribe form.
-
You can now see when a tool's examples ran from its Kali package rather than a build from source. The tool page names the package version and release tag above the examples, so if your own build prints something different, you know why. sslscan, axel and tcpflow are the first tools shown this way.
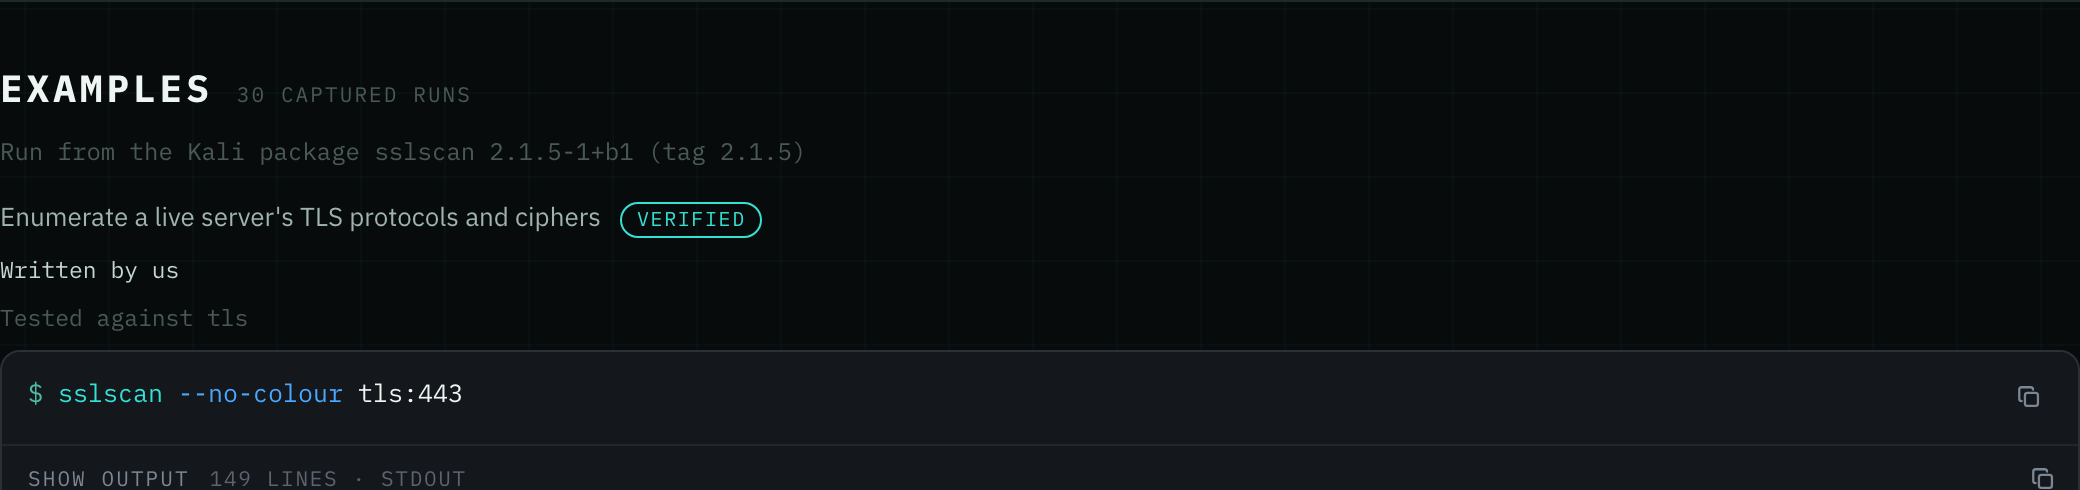
-
The top pick of the month and of the quarter now arrive on the 1st as their own email, with a page of their own. Both say which month or quarter the pick is for and start each release with its version or date, so you can tell a top pick from Friday's Head at a glance.
-
Setting and feature names in release summaries are now highlighted, like LDAP Anonymous Bind Enabled, so you can see what to look for in the product at a glance. Every issue already published shows them too.

- The AI-adoption, coding-agent, language and dependency charts and the Supply chain page now cover all 574 open-source tools we analyse. They had stopped updating on August 23 and still counted tools we no longer track.
*
Sep 29, 2026
-
You can now subscribe free from the Samples page, under the samples.
-
On a phone, Plans now shows one card per plan with its price, what it includes and its button. Before, every price and button sat off the right edge of a table you had to scroll sideways. The FAQ also has a new Account and billing section, and Talk to us now shows the address to write to.
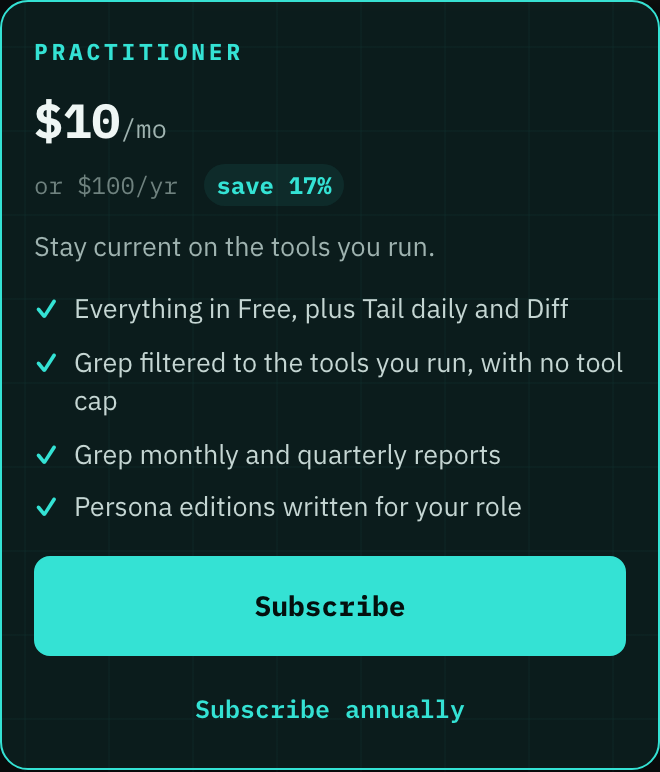
-
Your sign-in and confirmation links now keep working when your company's email filter opens them before you do. The link opens a short page, and you press Continue to sign in.
-
Open the detail panel for a tool listed under its vendor's name, like OWASP Amass, and you now get its activity chart and signals. Before, the panel came up without them.
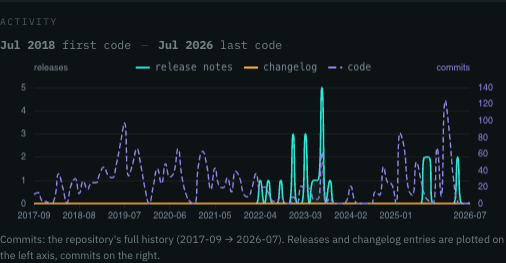
-
The home page and About page now say the show is coming soon, and the Watch the show button says so at all times, on a phone too. You can tell what you can use today from what is on the way.

-
Unsubscribe links now ask before they act. You see exactly what will stop and confirm with one button. Before, opening the link was enough, so a mail scanner could unsubscribe you.
- You can again see when each tool's code started and when it last changed, above the activity chart in its detail panel. Those dates went missing on 26 September.
- The FAQ and Plans page now describe each paid plan as it is today, with features still on the way marked coming soon.
- The notes under each chart now take their numbers from the chart's own data, so what you read there matches what the chart shows.
- Your account page now says how many Grep reports you get: one for each tool you named that shipped something, up to 10 a month and 10 a quarter, busiest tools first.
- When you sign up, your first email now asks you to confirm your subscription and tells you what arrives and when: Head on Fridays and New on the Toolchain on Mondays. Once you confirm, a short welcome shows you where to choose your newsletters and how to reach us.
- You can now reply to any email we send, and a person reads your reply. Messages you send from the feedback form while signed in now reach us straight away, as well as being saved in My Requests.
- When a signup or sign-in request can't go through, you now see why and when to try again. Before, the page said to check your inbox even when nothing had been sent.
- Your Grep arrives even on a morning when Tail has a problem. Until now, one failed Tail delivery could hold back every reader's Grep that day.
- If the mail provider asks us to slow down on a busy morning, your newsletter is retried instead of dropped.
- Every page now downloads about a fifth less. The controls all pages share come from one file your browser keeps, instead of a copy inside every page, so moving from page to page is quicker.
- Each tool's RSS feed now carries its newest 50 releases, so subscribing to one no longer drops years of history into your reader at once. The tool's page still has the full history.
- You can now read in the privacy policy exactly what we keep and for how long: your sign-in history (kept for 400 days), delivery records, and what unsubscribing does and does not delete. It also names Cloudflare among the companies that handle your data, and it says how to delete your account: email us. That way you know what happens to your data before you ask us to delete it.
*
Sep 28, 2026
-
You can now put up to four tools side by side before you buy. Star the tools on your shortlist and click compare, or open My Toolchain and click compare. You see each tool's pricing and plan changes, score card, release pace, project health, features and dependencies, with the leader in each row marked. That shows you where one tool is ahead without reading four tool pages. Copy the result as a table or CSV for your buying notes. Included with every paid plan. Pricing history and category ranks are included with Researcher and Business.
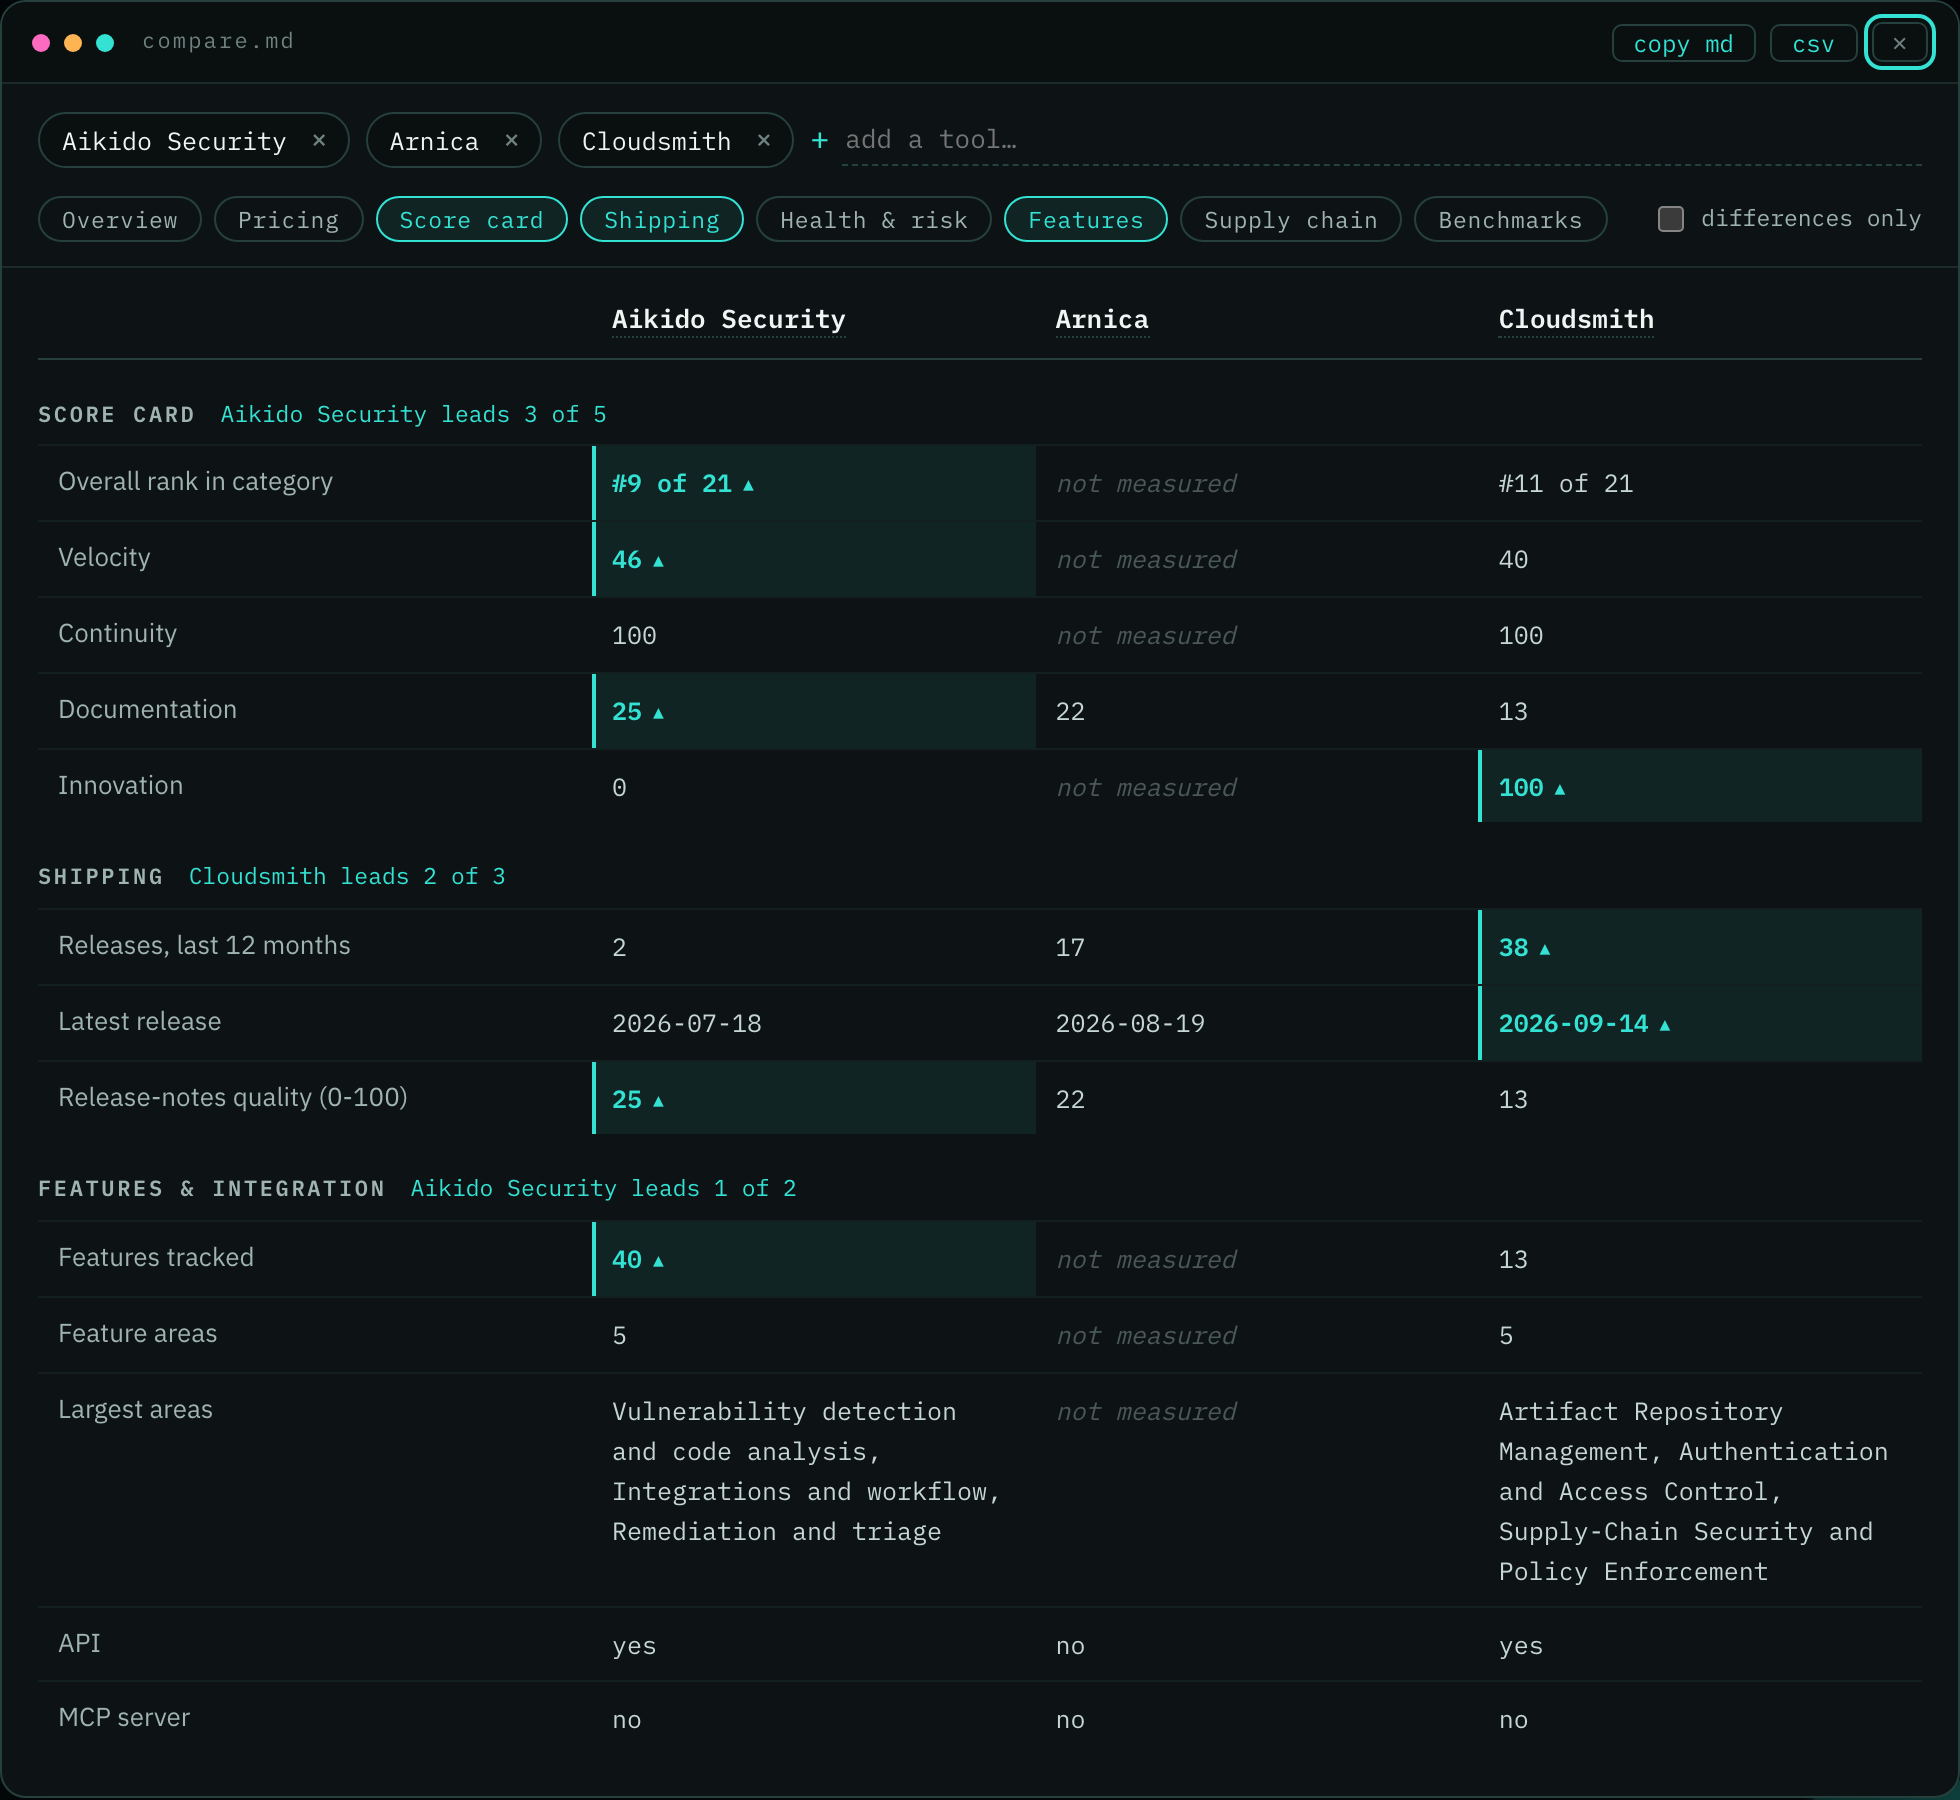
-
Searched the Tools page for something we don't track yet? The empty result now offers a Request a tool link that opens a note with the name already filled in, so asking us to cover it takes one click instead of a hunt for the feedback form.

-
Analytics now tracks the security market's lifecycle. You can see which categories are gaining new companies and tools, which are losing them to closures, sunsets and acquisitions, and where vendors partner or buy instead of building. Every count links to a dated primary source, so you can check a trend yourself instead of taking a headline's word for it. Coverage starts as a small reviewed pilot, and each chart is labeled that way.
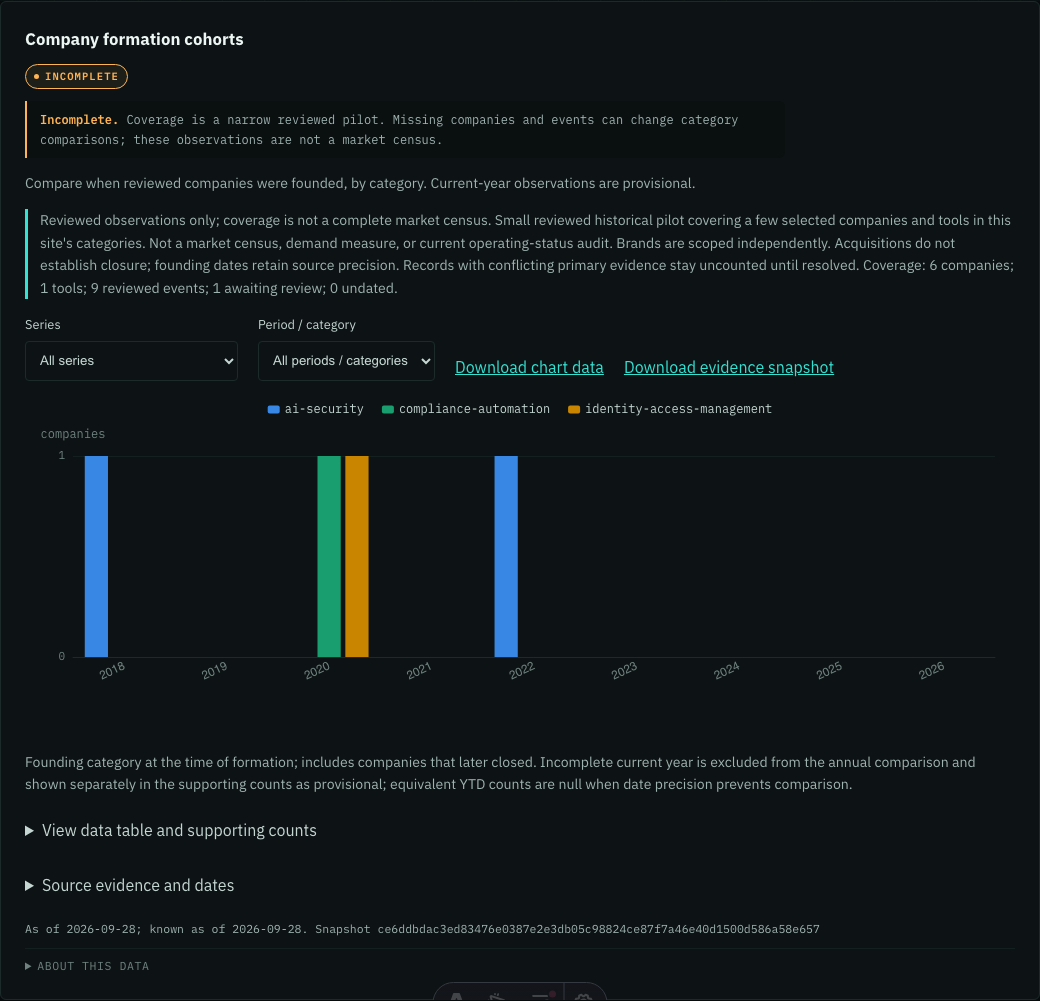
-
You can now choose whether your emails include Coverage: new and updated checks, detections, integrations, platform support and compliance policies. Keep it on to see how the tools you follow are growing, or turn it off in your account for shorter Tail, Head, Diff and Grep emails.

-
The home page now marks the show as coming soon, so you can tell what you can use today from what is on the way.
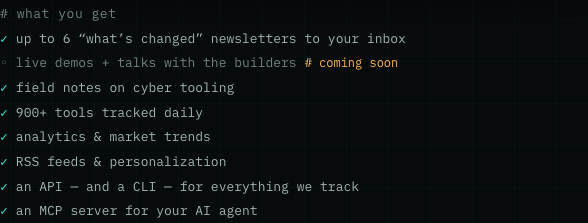
-
The Plans page now explains what you can read without an account, what a free Grep includes, and which benefits require a paid plan. It also clarifies how to use your paid benefits across both sites.
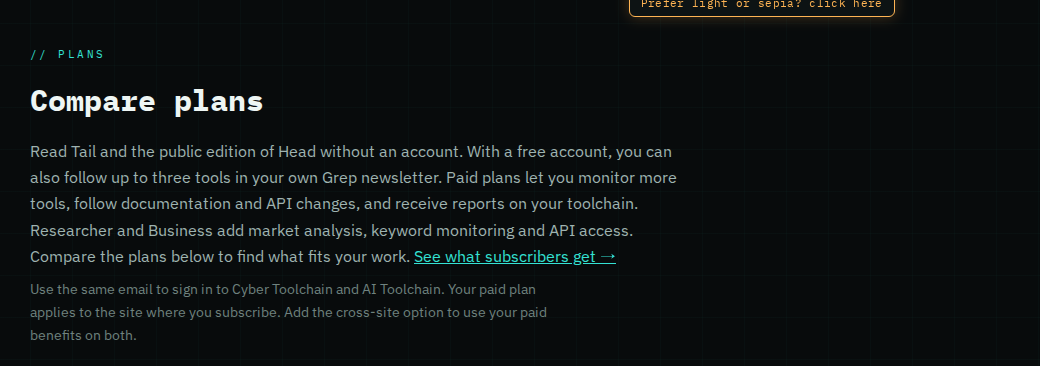
-
New on the Toolchain now appears as ls in edition strips, plan comparisons and account preferences, making the newsletter list easier to scan alongside tail, grep, head, diff and uniq.

-
Tool pages now have a Conversation section: the threads from a tool's mailing lists and community forums that are worth your time, summarised with a link to the original, so you can learn what the community has worked out about a behaviour, a scan or a change before you hit it yourself. Commands posted by maintainers and known contributors, or confirmed in the thread, appear with the year they were written and who vouched for them. Nmap and Zeek are first; more tools follow as their archives are collected.
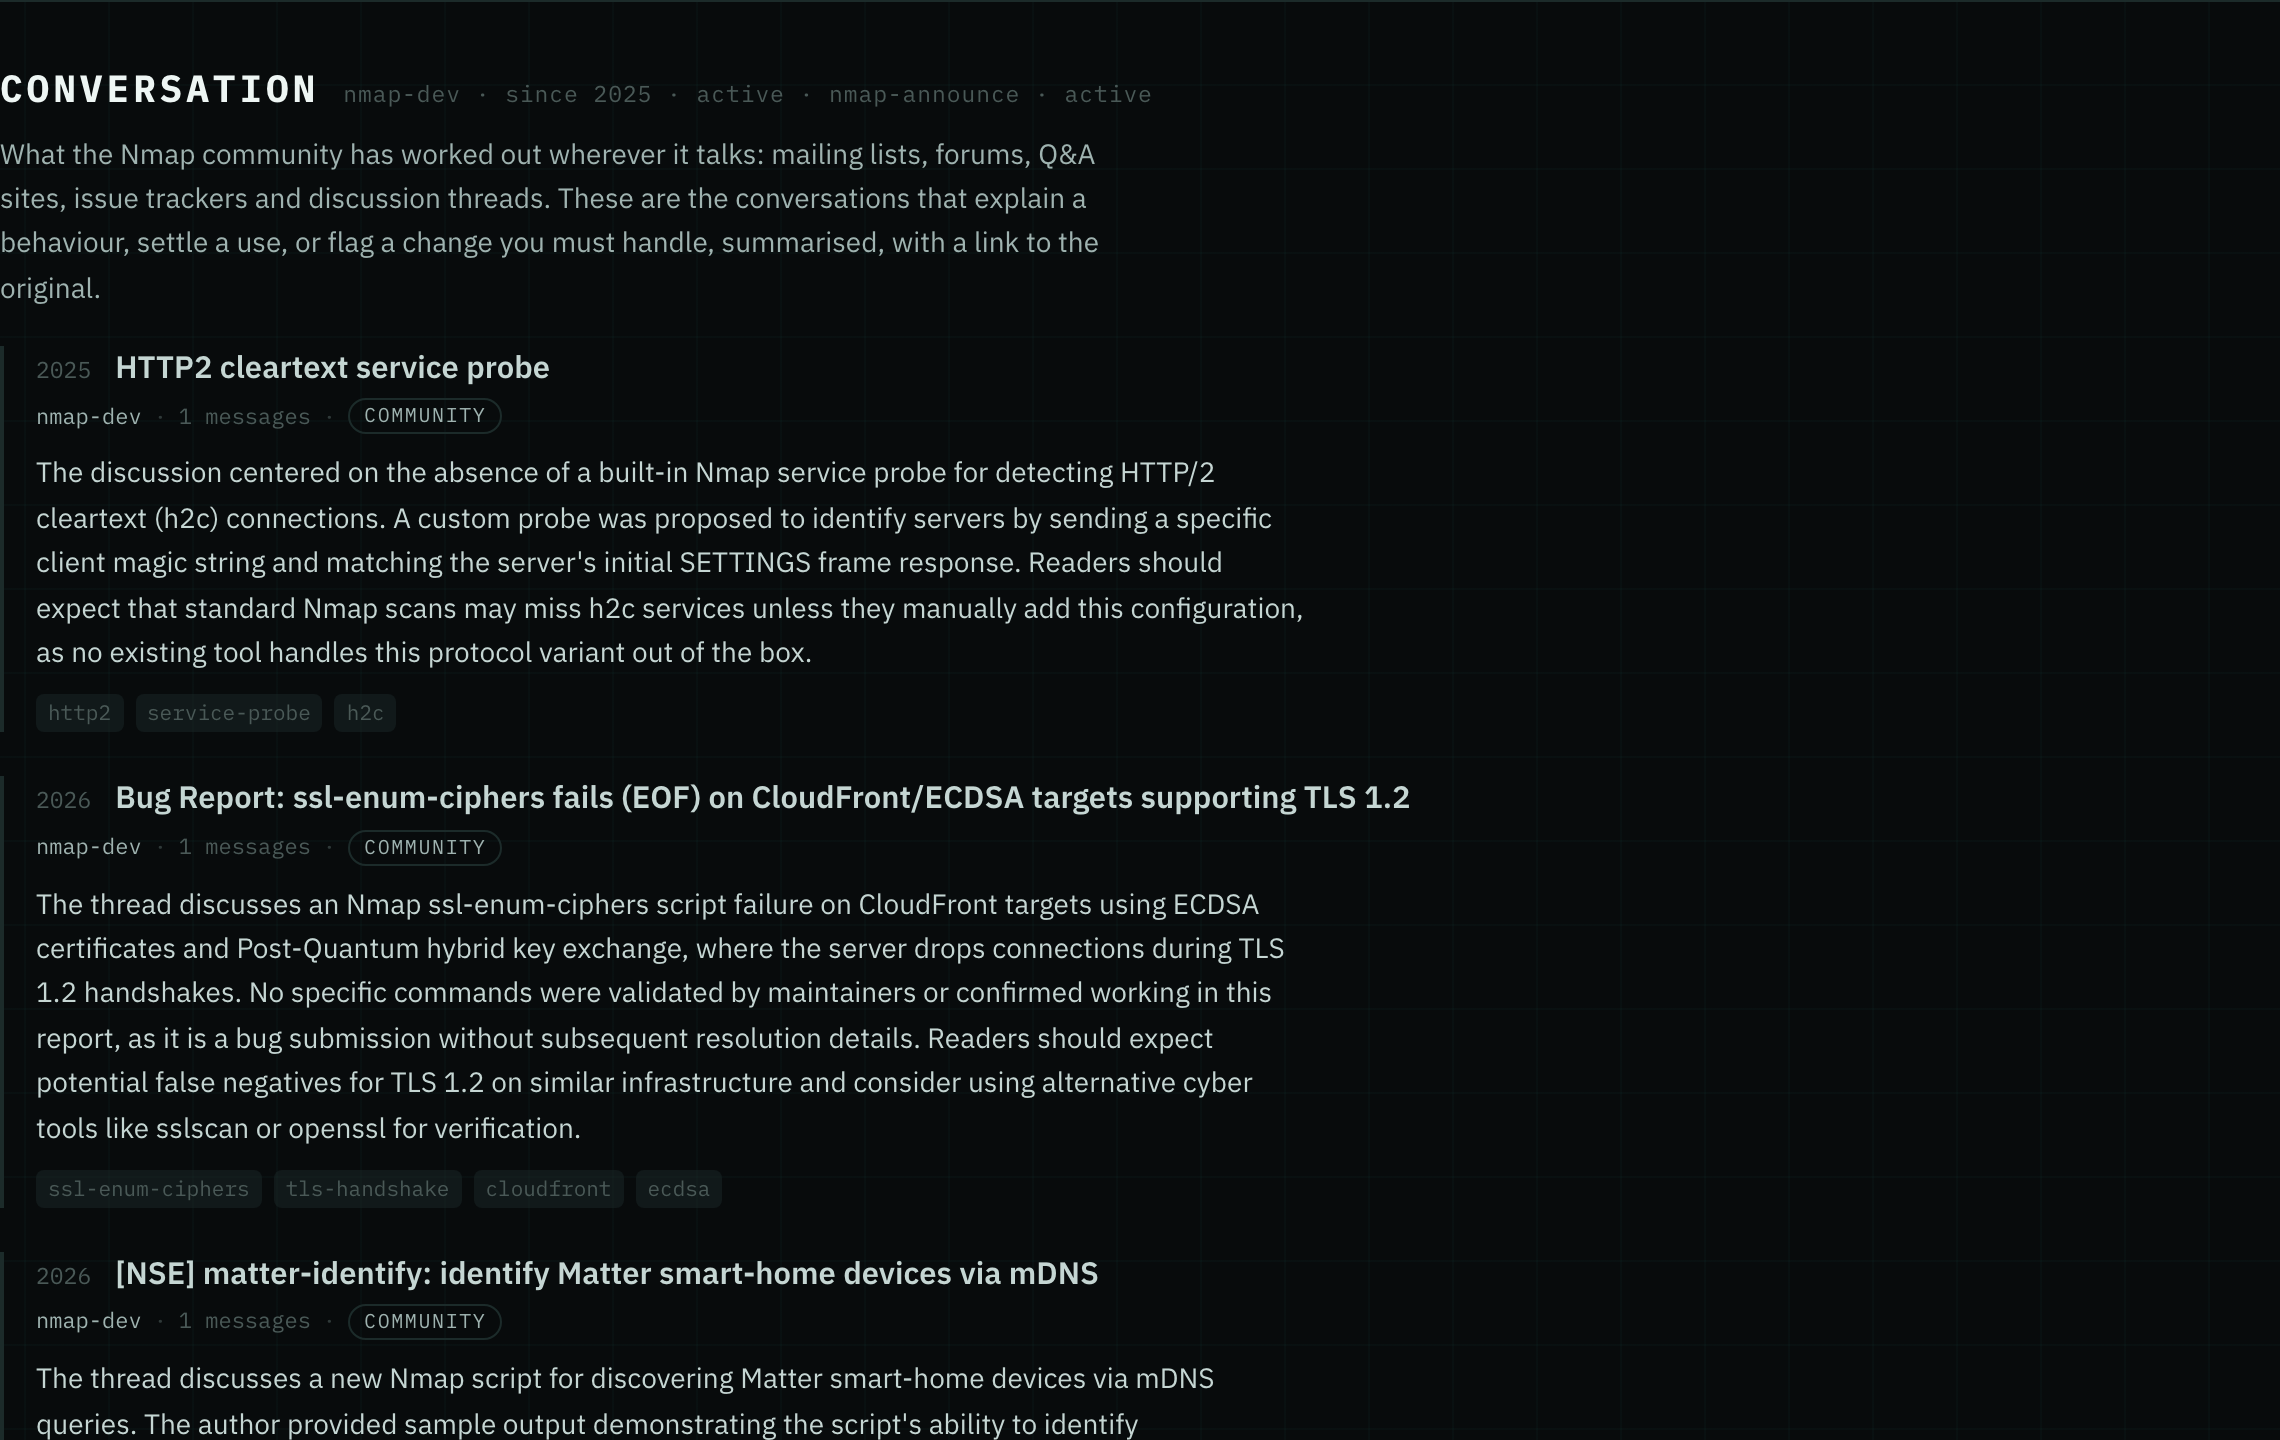
-
The terms and privacy pages now name the company you are dealing with: Cyber Toolchain LLC, a Florida limited liability company. You know who is behind your subscription before you pay.

- Tool pages now show a Coverage history as a tool's releases add, update or retire checks, detections and integrations. Each change links to the vendor's own release note, so you can check the source yourself. Issues on the site list every change, and emails keep it to a short summary.
- The highlights card you download to share now says 900+ tools watched, which matches the number on the home page. It said 600+.
- The plans page now tells you how many questions the MCP server is tested to answer, 16 today, with a link to the full list. You can check it covers what you want to ask before you subscribe.
- The FAQ now gives Researcher's price as $20 a month, lists Uniq as a newsletter you can receive today, and points you to the plans page to subscribe.
- A tool's repository link now follows the project when it moves to a new owner, so SOPS, impacket and Prowler take you to where the work happens today.
- Business is arranged by email wherever the site offers a plan, including the home page and your account page, so every Business button starts the same conversation.
*
Sep 26, 2026
-
Business is now arranged directly with us: the Business button on Plans opens an email to info@cybertoolchain.io, so we can shape the plan around the vendors and categories you track before you pay.

*
Sep 25, 2026
-
New on the Toolchain arrives every Monday: every cyber tool we started watching that week, the three we would try first, how long each has been alive, and a Watch button that adds any of them to Your Tools. You hear about a new tool the week we start watching it, not the day its first release lands. It's free on every plan and already on; switch it off anytime on your account page.
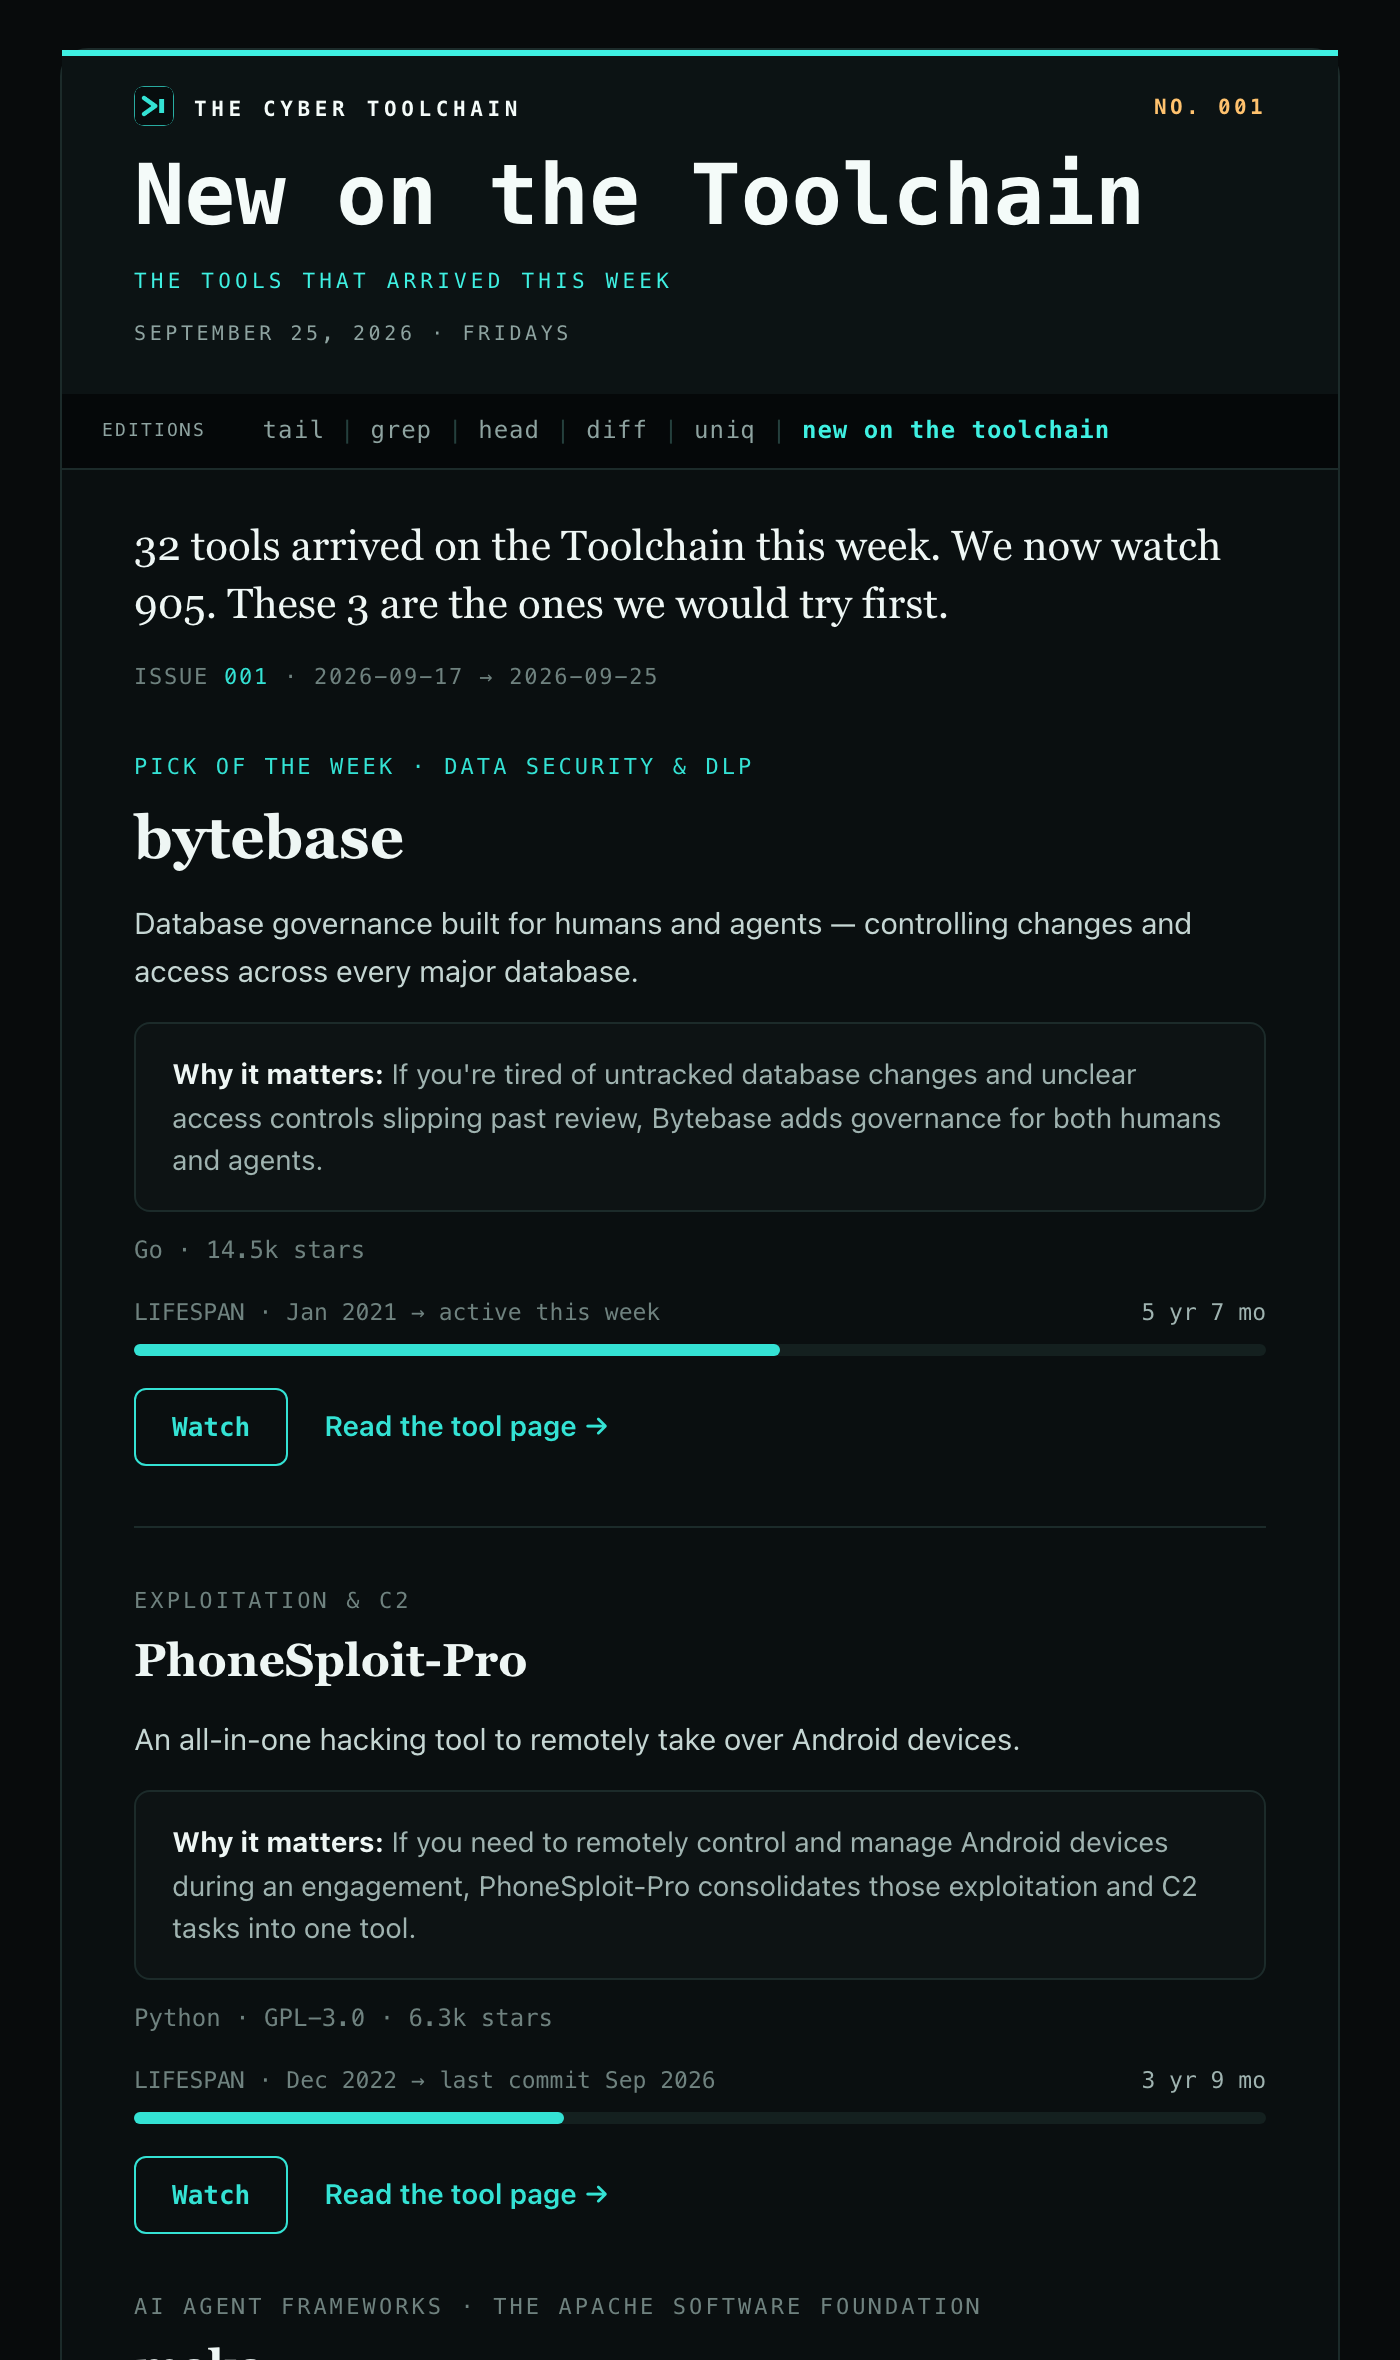
-
The site now opens in dark mode by default for first-time visitors, instead of the light sepia theme. Prefer something else? Pick light, sepia, or high-contrast from the theme menu in the header — your choice is remembered after that.
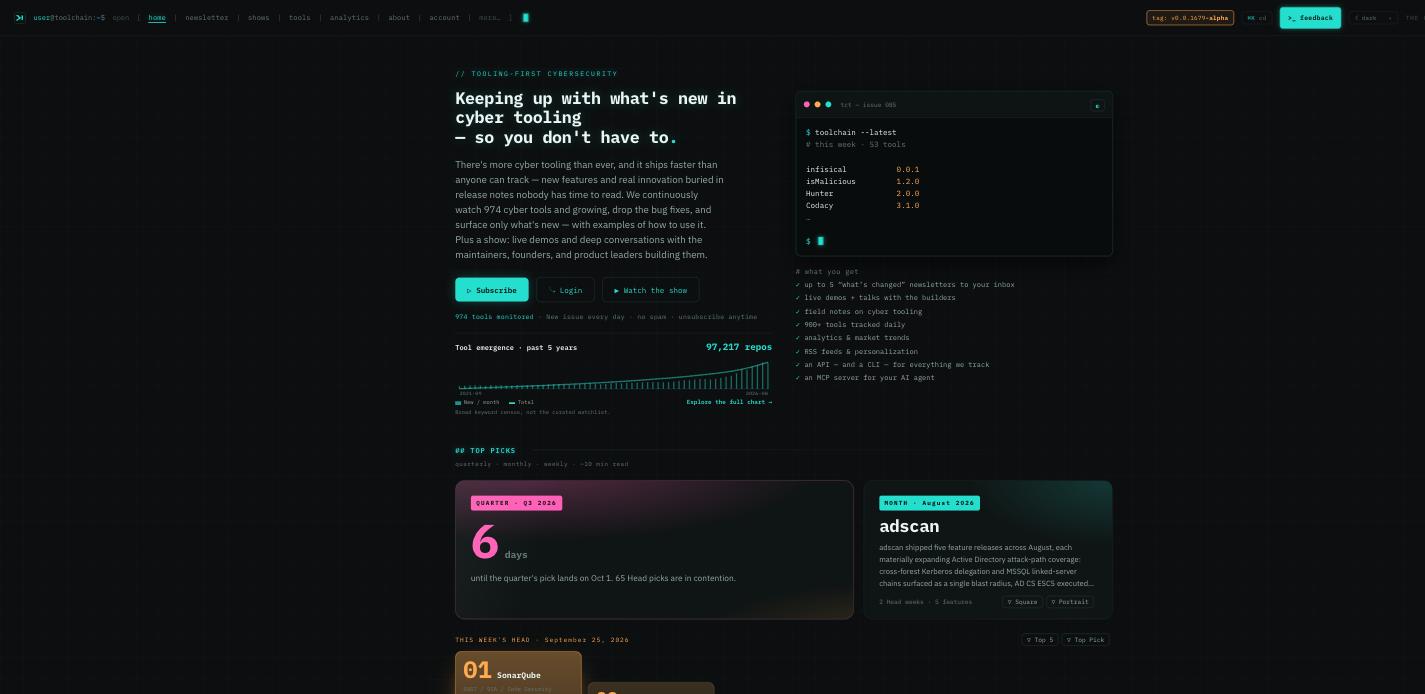
-
A vendor's pricing history is easier to scan: each plan card now flags when its price changed and what it used to cost, a "most recent change" summary sits above the full timeline, and every step reads as a diff — the exact lines added, dropped or reworded, not a prose summary.
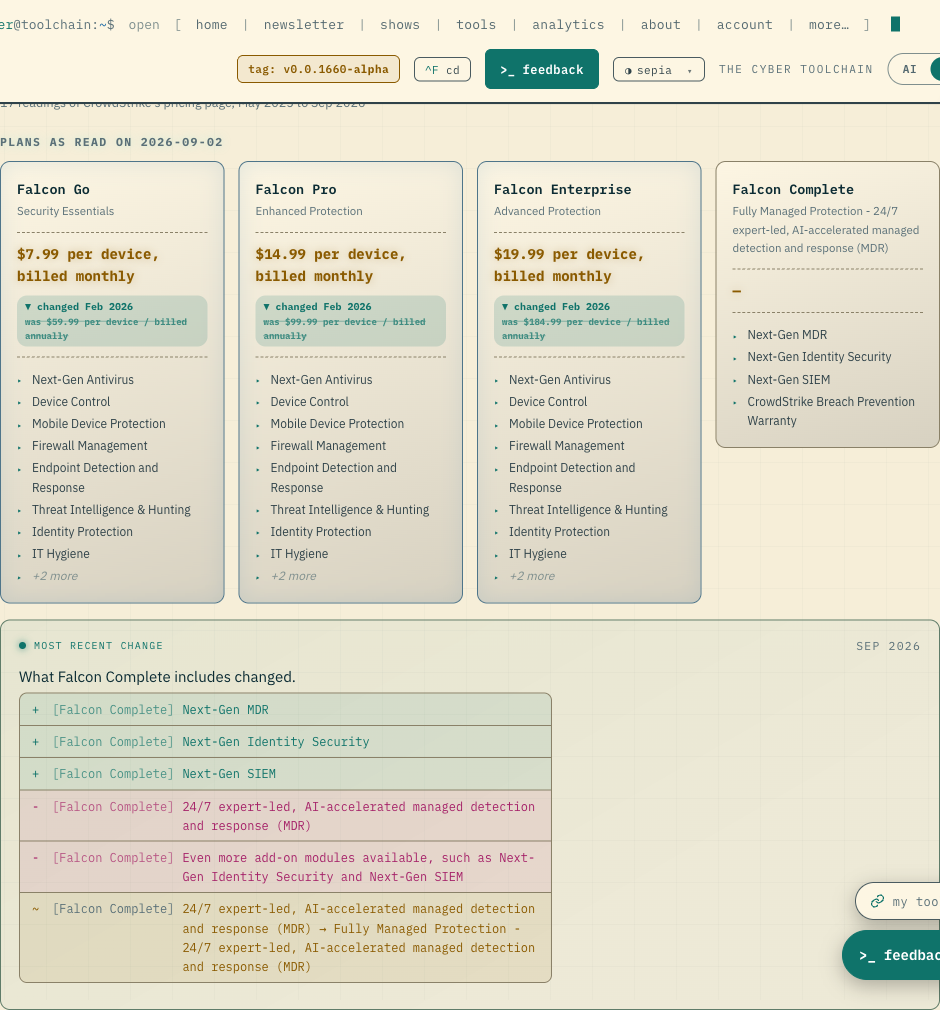
-
Search opens with ⌘K (or Ctrl-K) instead of ⌘F, so it no longer fights your browser's own Find.
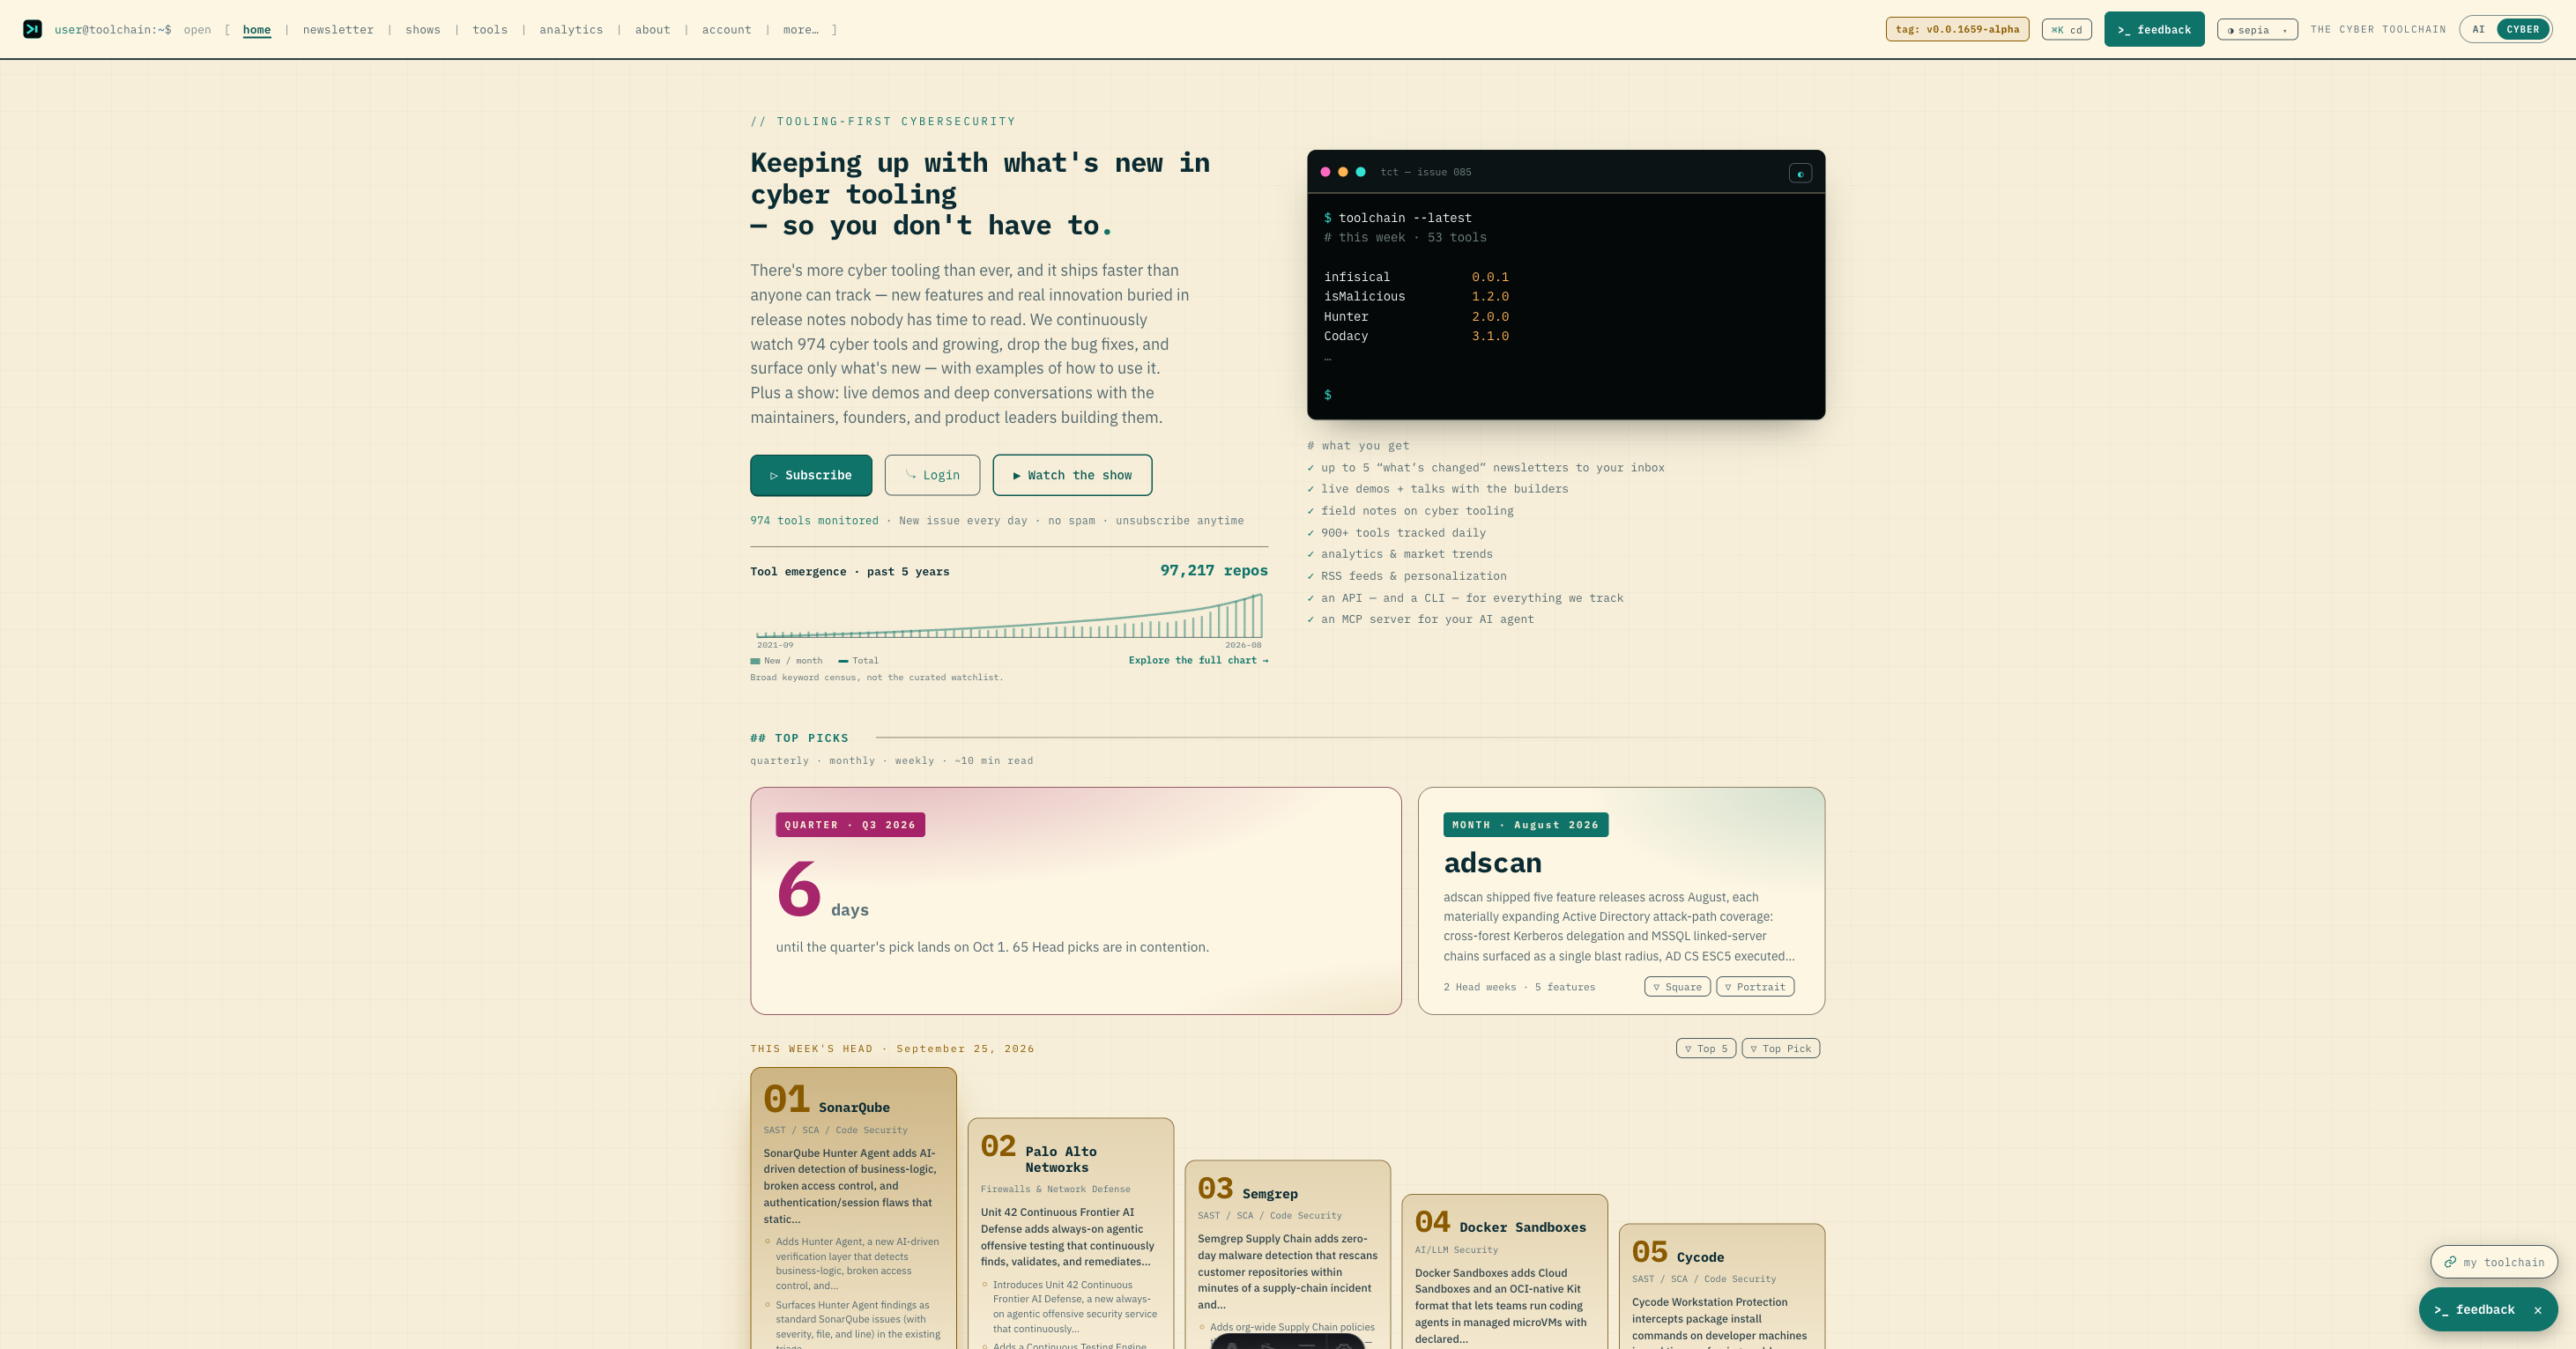
-
Tool pages now tell you the command to type for 115 more tools, and 20 that named the wrong program are fixed — tcpdump's page used to compose `makemib`. Where one package installs several programs, like radare2's r2, radiff2 and rasign2, pick the program and the list narrows to its own options, so the command you copy actually runs.

-
API reference pages are easier to scan. Each endpoint’s method is a colored label, its path is broken into segments with the values you fill in highlighted, and its purpose sits right underneath. Compare now stacks what you gain, what you lose and what to stop calling one above the other, so long paths stay readable. The curl inside an opened endpoint is legible again, so you can copy a working command without squinting at it.
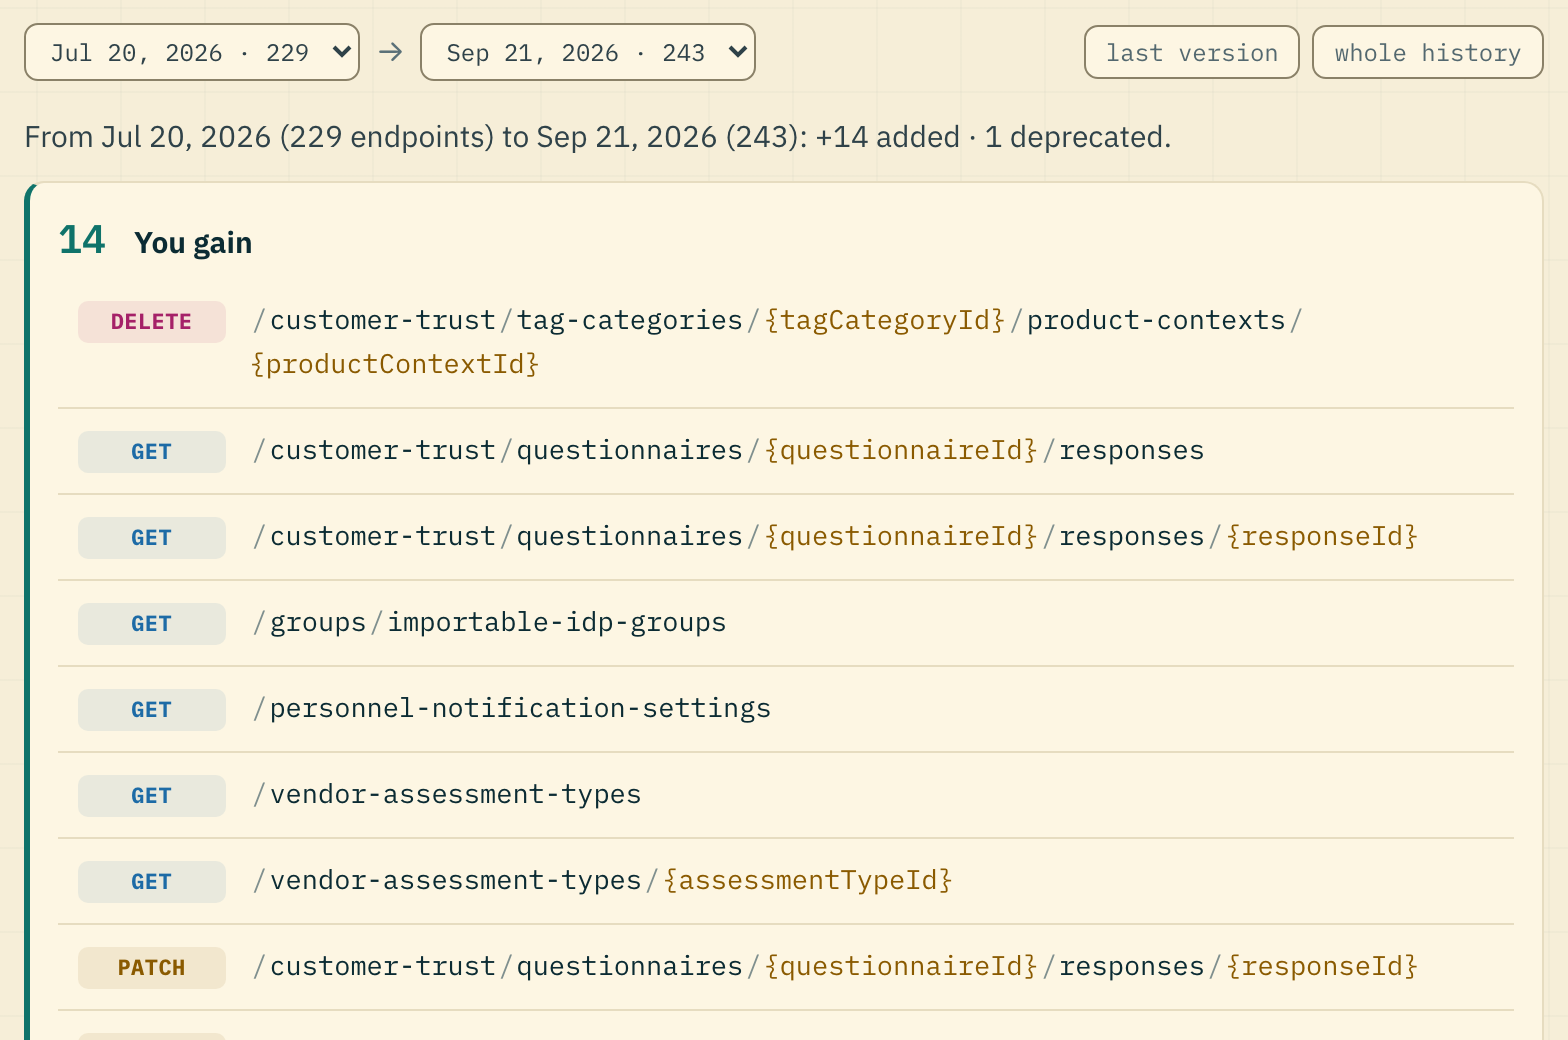
-
Click an old link like /logos or /article and you'll land on its new page through a quick terminal-styled animation, not a blank redirect.
-
Top Picks on the home page now leads with the product of the quarter and the product of the month, and lays this week's Head five out as a podium underneath. Each bar shows what that pick shipped, so you can see the week's best releases without opening the issue. Every card has its own Share button, so the image you download is the pick you meant.
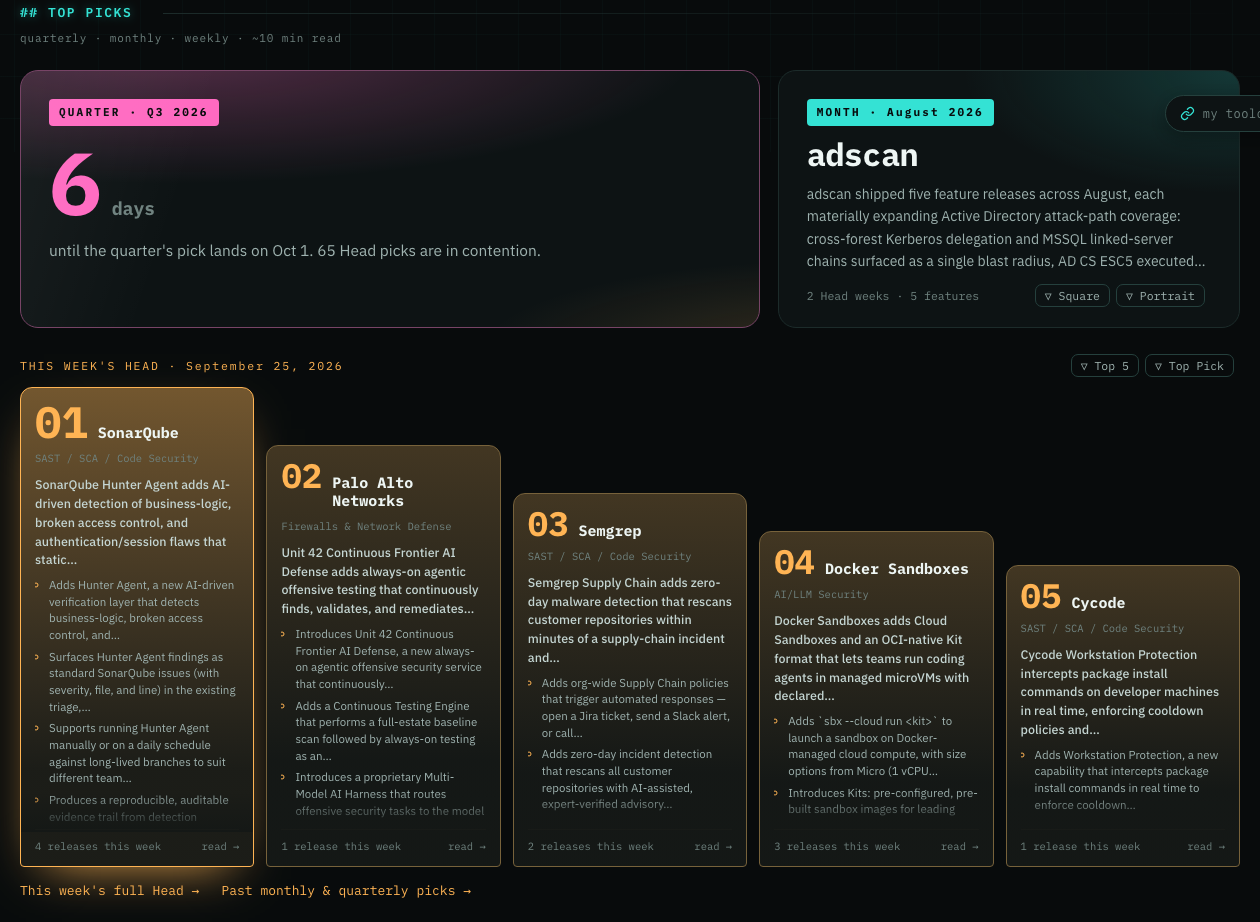
-
The month's top-pick summary now sits in a highlighted callout box, so the one paragraph worth reading first stands out from the supporting bullets and detail below it.
- Grep Monthly and Quarterly Reports now arrive in the email theme you picked on your account page. Before, they always came dark.
*
Sep 23, 2026
- Manage your newsletter preferences and Greps from your AI assistant: see what you monitor, create or update alerts, and read your subscriber issue links and available content without leaving the conversation. The MCP setup page now groups use cases and provides a copyable connection address.
*
Sep 22, 2026
-
See what pwndbg examples actually printed, with synthetic test inputs clearly labeled and fixture details beside each command. Wide output now scrolls within its panel on small screens, keeping commands and controls visible.
-
The 13 questions the MCP endpoint is tested to answer now sit in a collapsed list on /mcp — you can scan every promise at a glance and open just the one you care about, instead of scrolling a page and a half of detail to find it.
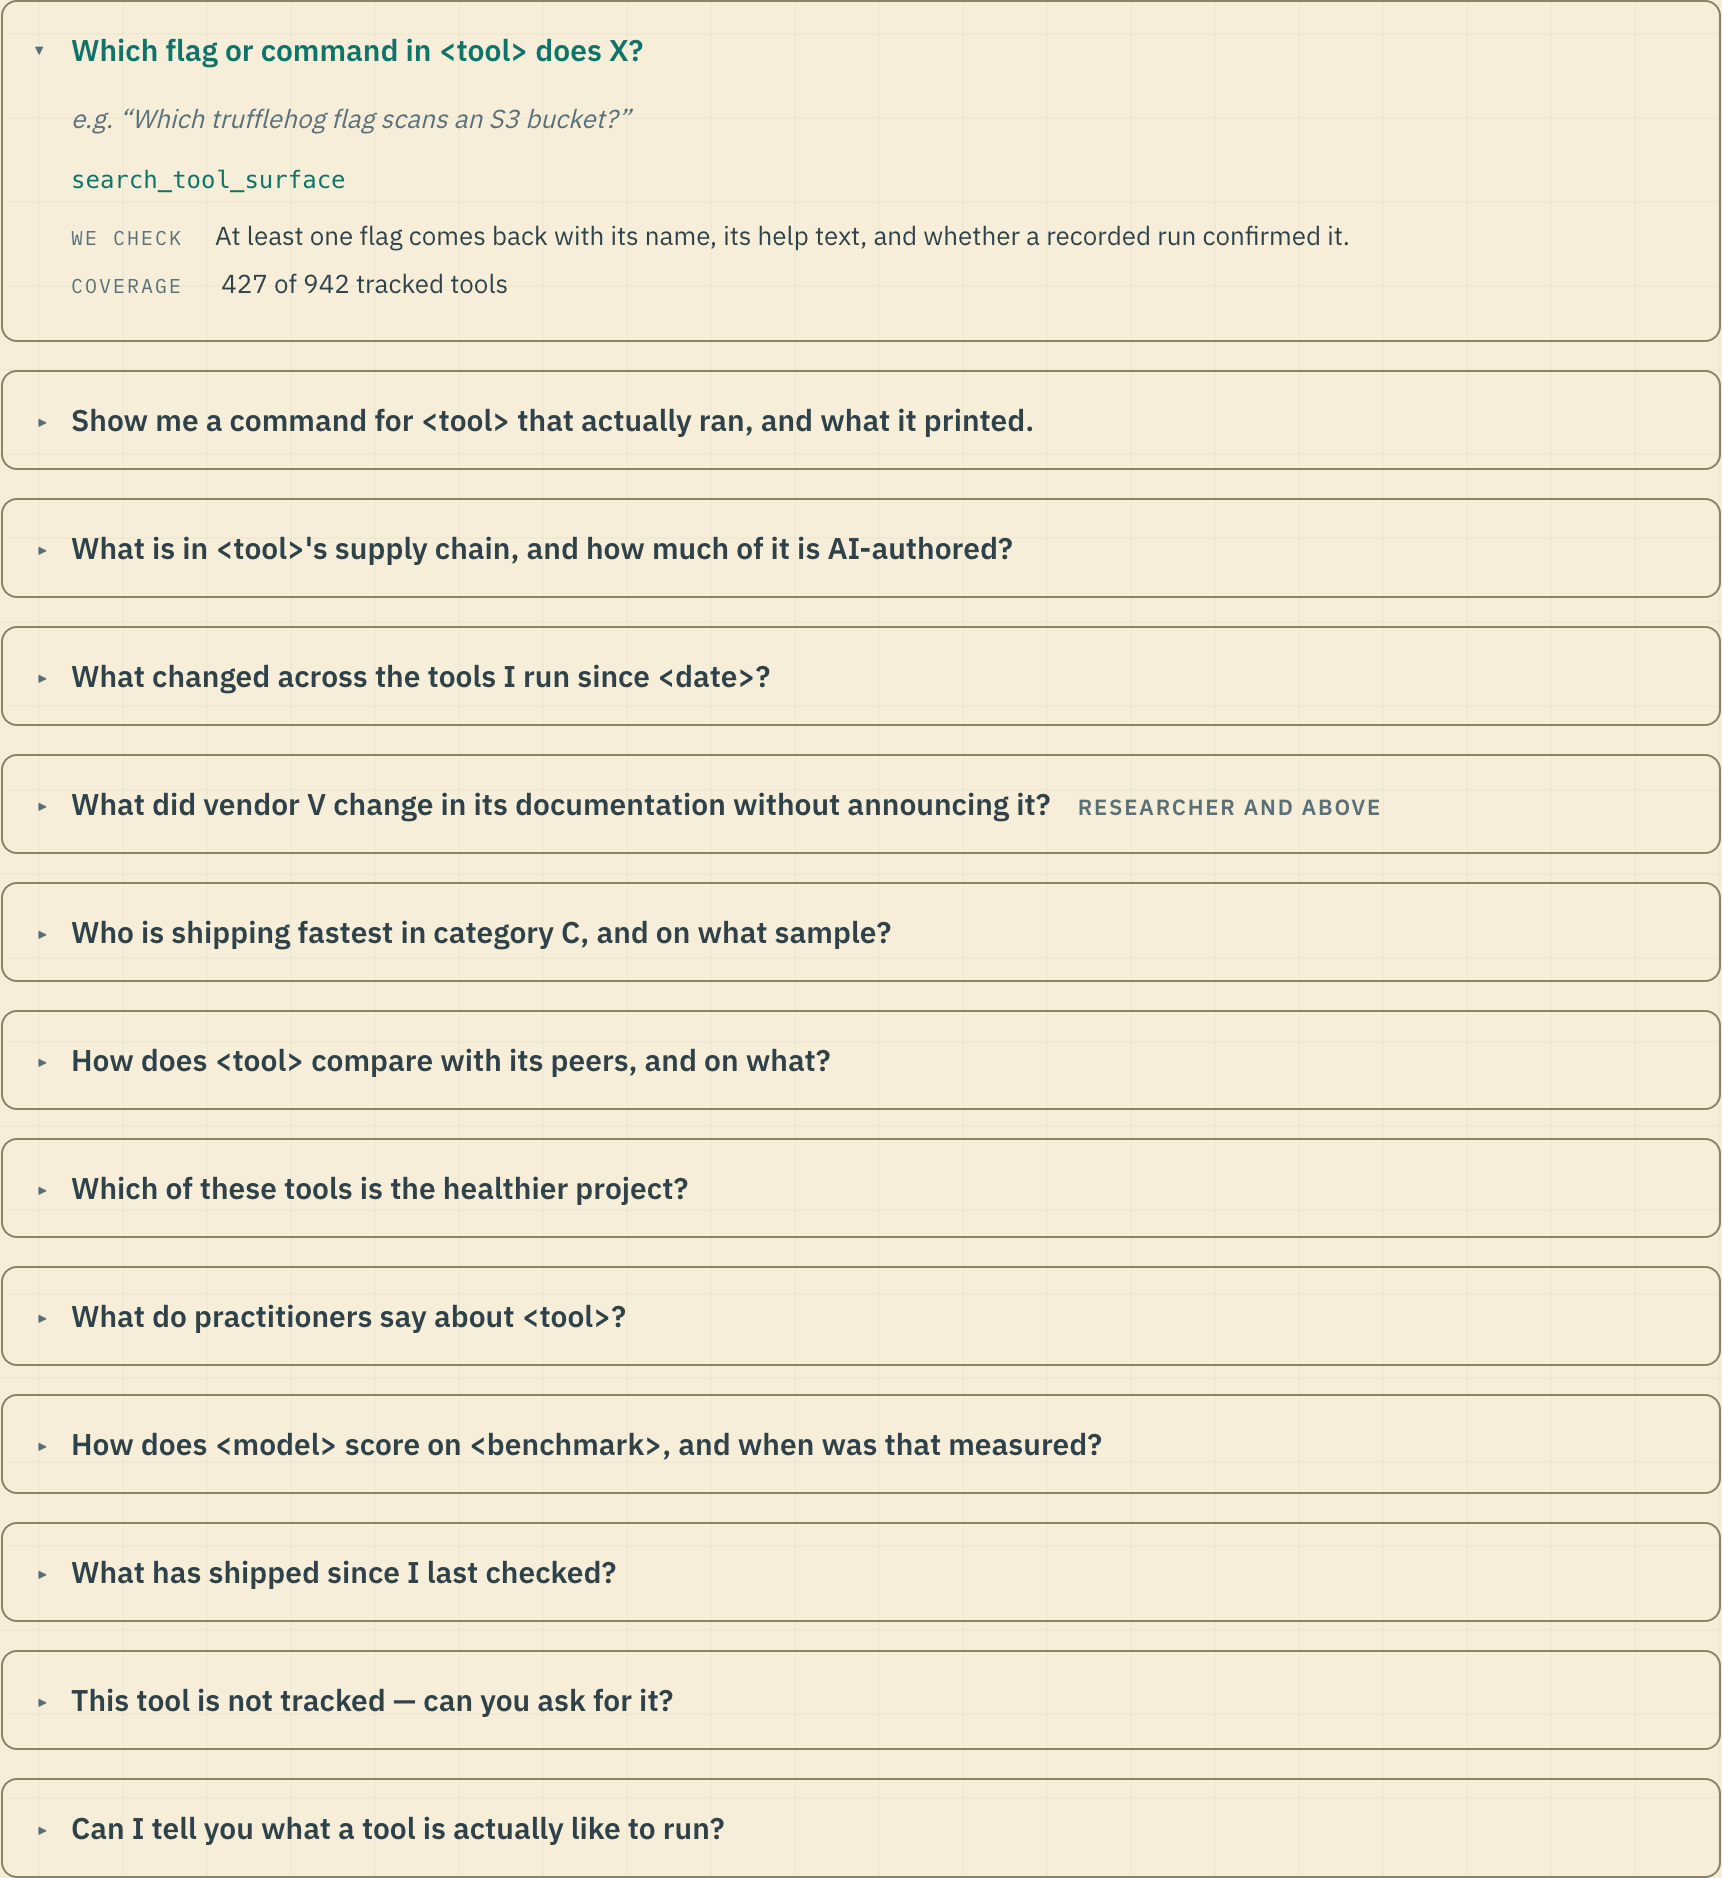
-
Head now names a top pick every month — and every quarter — the single product that stood out, not just the week's five. Picks are free, arrive on the 1st, and stay at /newsletter/top with a share card you can post.
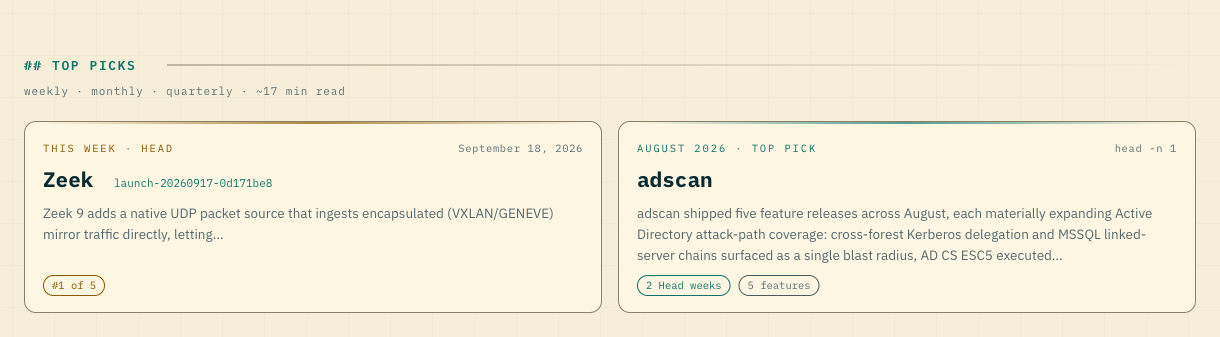
-
Maintainers can now add a 'tracked by Cyber Toolchain' badge to their project's README in four styles that carry our mark, from a shield that sits neatly beside build and licence badges to a larger version for a README header. Each tool page opens the picker on the Brand Kit with that tool's address filled in, so the Markdown or HTML you copy sends readers straight to the tool's page to follow every release.

- Your coding agent can now hand something back. Ask it to request coverage for a tool you run that we don't track yet, and it joins the same review queue as a request made on the site. Ask it to share what a tool is actually like to run day to day, and that goes into the corpus behind our analysis anonymously: no account, no key, no timestamp finer than the date. Nothing you write is published back to other readers.
- Okta's pricing history now runs back to September 2021 — 55 readings and 13 plan relaunches, where before its page was too large to read and it had none. Across every vendor, a plan that vanished from one reading and was back in the next no longer shows as a withdrawal and a relaunch: that was a half-rendered capture, and a plan now counts as withdrawn only once a later reading confirms it. Vendors like JumpCloud, Cisco and Sumo Logic lose the phantom relaunches and keep the real ones. Histories refresh monthly from here on, so new pricing captures reach the Commercials section without waiting on a rebuild.
*
Sep 21, 2026
-
Ask your assistant how a tool stacks up, not just what it shipped. The MCP server now answers six more questions: how a project scores against its peers and where it ranks, up to eight tools side by side in one table, what practitioners have actually said about a tool — quoted, with a link to each source — how models score on the benchmarks we track and when that was measured, everything published since your last call through a cursor so nothing repeats, and a way to ask us to track a tool from inside your assistant. It also ships ready-made prompts — a vendor brief, a toolchain review, a category survey, alternatives to an incumbent — so the multi-step questions are one command instead of something to reconstruct each session.
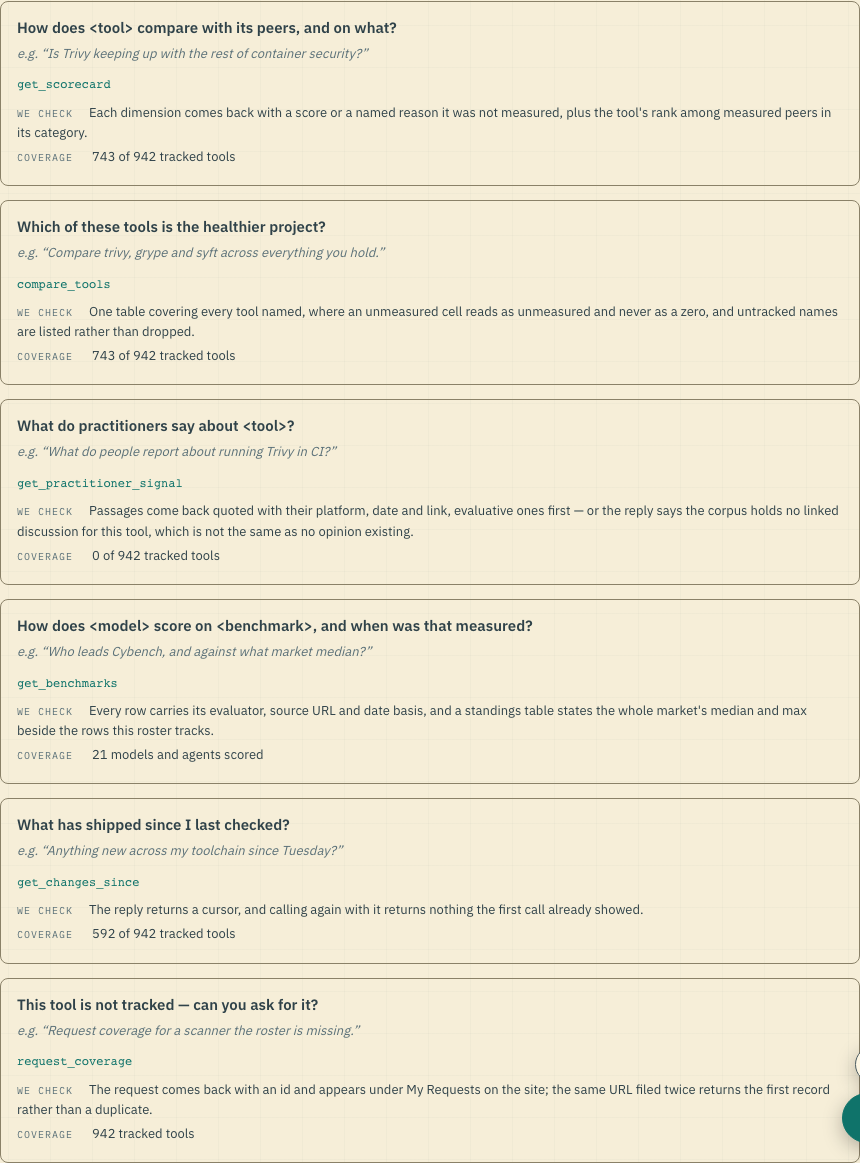
-
Adoption of AI Coding Agents now includes AGENTS.md as a dotted line. It's the generic instructions file any agent can read, and it already appears in as many tracked repos as Claude Code's config (105), so you can see how far the vendor-neutral convention has spread next to the named assistants.
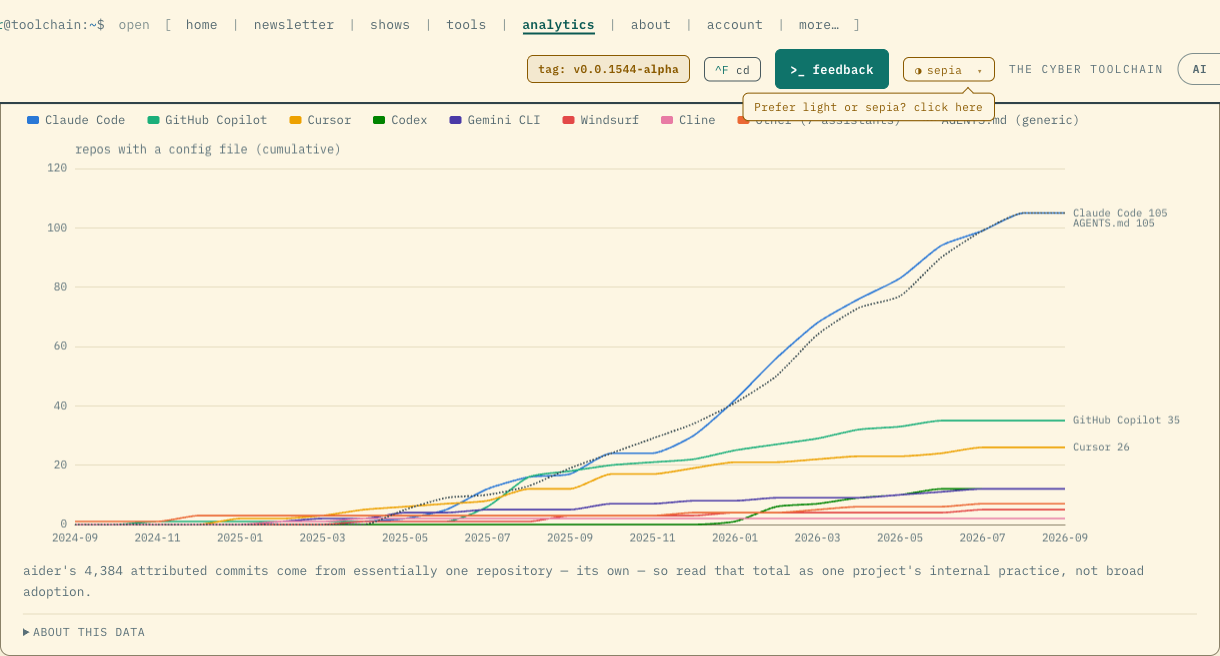
-
Briefed now reads each issue down to its notable changes — at most a quarter of what shipped, and a quarter of the reading. New products lead, then new capabilities, breaking changes and deprecations, wherever they rank in the issue; refinements and polish wait one click away in Everything. A 189-change day briefs to 29, so you can take in the day in a couple of minutes.

- The questions on every tool page now ask what you'd actually bring to the tool. Nmap's used to open with whether it needs elevated privileges; it now opens with “Which hosts on this network are actually reachable right now?” and “What is listening on this server, and which version?” — so a few lines tell you what you'd walk away knowing, rather than how the tool installs. Rewritten for every tool we track.
- Six recently added tools now have full pages: Cribl Stream, Microsoft Defender for Cloud, Tenable Attack Surface Management, CrowdStrike Falcon Data Protection, Rapid7 Cyber GRC and RoboForm each open with an overview of what the product does and the questions it answers, so you can size one up before its next release lands.
- Every product from Tenable, Palo Alto Cortex, Qualys, Snyk, Datadog, Splunk, CrowdStrike Falcon and Rapid7 now opens with an overview of what it does and the questions it answers, written from the vendor's own documentation and product pages, so you can size up a product without leaving the site. Forty-four more pages in all.
*
Sep 20, 2026
-
Grep reports now stay tied to the month or quarter you selected, with HTML, PDF and EPUB downloads. Downloaded HTML retains its reading controls and themes. Private reports and paid newsletter pages no longer load analytics or send referrer information.
-
Ten archived GitHub and Microsoft product demos now play directly in the newsletter from our own media storage, so you can watch without opening a vendor page.
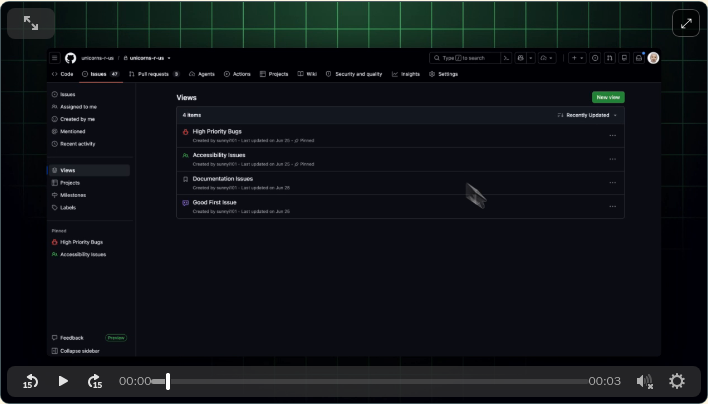
-
The tools table now fits a phone screen: star, tool, version, status and popularity all stay on screen in portrait, instead of sliding off the left edge and making you turn the phone sideways to see which tool a row is.
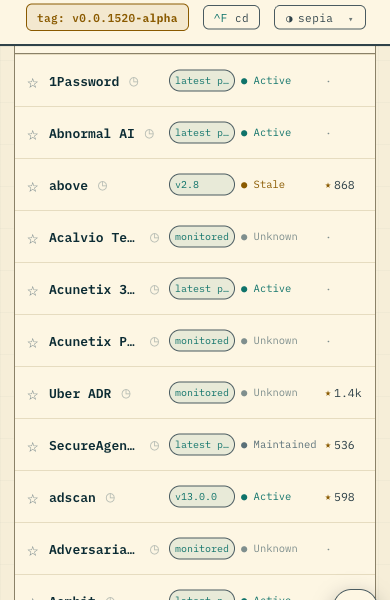
*
Sep 19, 2026
-
Every tool from a vendor with a public pricing page now has a Commercials section, and each vendor has its own page under Vendors: the plans on its pricing page as we last read them, with prices and what each one includes, and every time that lineup changed since our first reading. Each change is dated and explained for someone buying the tool, so you can see how a vendor got to today's pricing before you negotiate with it. Snyk's goes back to 2021. Part of Researcher and Business.
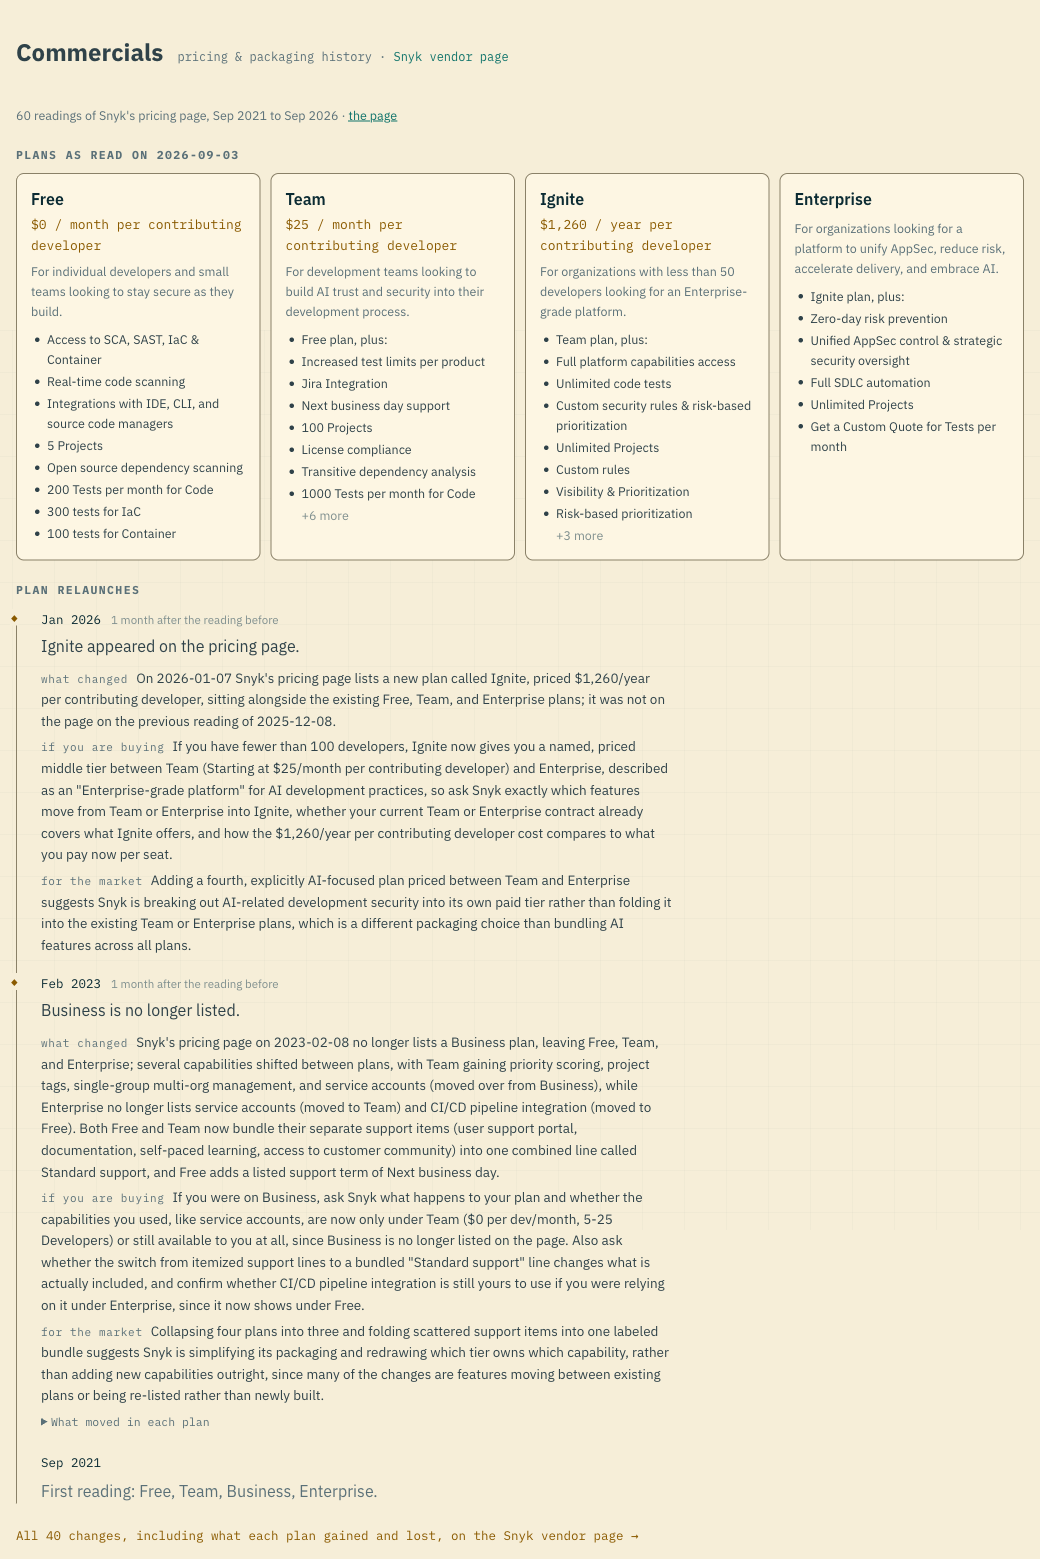
- Connect your AI assistant to the archive in one command: the new /mcp page carries a copy-paste install line for Claude Code and Codex, config files for Claude Desktop, opencode, Cursor, Windsurf, Zed and Kiro, and the exact endpoint to point them at. It also spells out the two ways this quietly goes wrong — pasting the REST API's address instead of the MCP one, and letting your shell bake the key itself into a config file rather than reading it from the environment. Researcher and Business.
- Project health no longer shows a bus factor, maintainer count or contributor count for products whose public repository is only an issue tracker or release mirror, such as Docker Sandboxes. Those numbers were counting whoever publishes the releases, not the team building the product. The section now shows the issue figures that are real, and says why the rest aren't there.
- Ask the API or the MCP server which command actually does the thing: every tracked tool now comes back with its command-line flags — the flag, what it does, and whether we have seen it used in a recorded run — plus a new search that matches a phrase like 'scan an S3 bucket' against flag help and captured commands across every tool at once. Before, you could learn that a tool had 22 documented flags without being able to name one of them.
- The hiring charts on /analytics now carry the history we have actually collected instead of a single week. Every version published since 8 August reported one week of vendor job-board data, so the charts could show a current position but never a trend. They now hold three weeks and gain another every Monday.
- Charts on /analytics now update every morning with the releases we tracked overnight, instead of once a week, so the market view you see is never more than a day old. Connected AI assistants can now also read the AI Toolchain's charts through the MCP server, not just ours.
- The persona preview on your account page now changes only when you pick a persona, not when your pointer passes over the list — so you can read a persona's sample edition without the text swapping out from under you.
*
Sep 18, 2026
-
Subscribers now get a score card on every tool page: five scores from 0 to 100 — shipping velocity, documentation quality, breaking-change discipline, maintenance risk and innovation — plus, on open-source tools, four community-health scores: whether contributors are growing, whether the project is narrowing onto fewer maintainers, whether its issue backlog is shrinking, and how fast maintainers reply. Each is linked to the releases, notes, issues or API history it was computed from, so you can size up a tool before you adopt it and check the working yourself. Where we can't measure something, the card says so instead of scoring it zero.
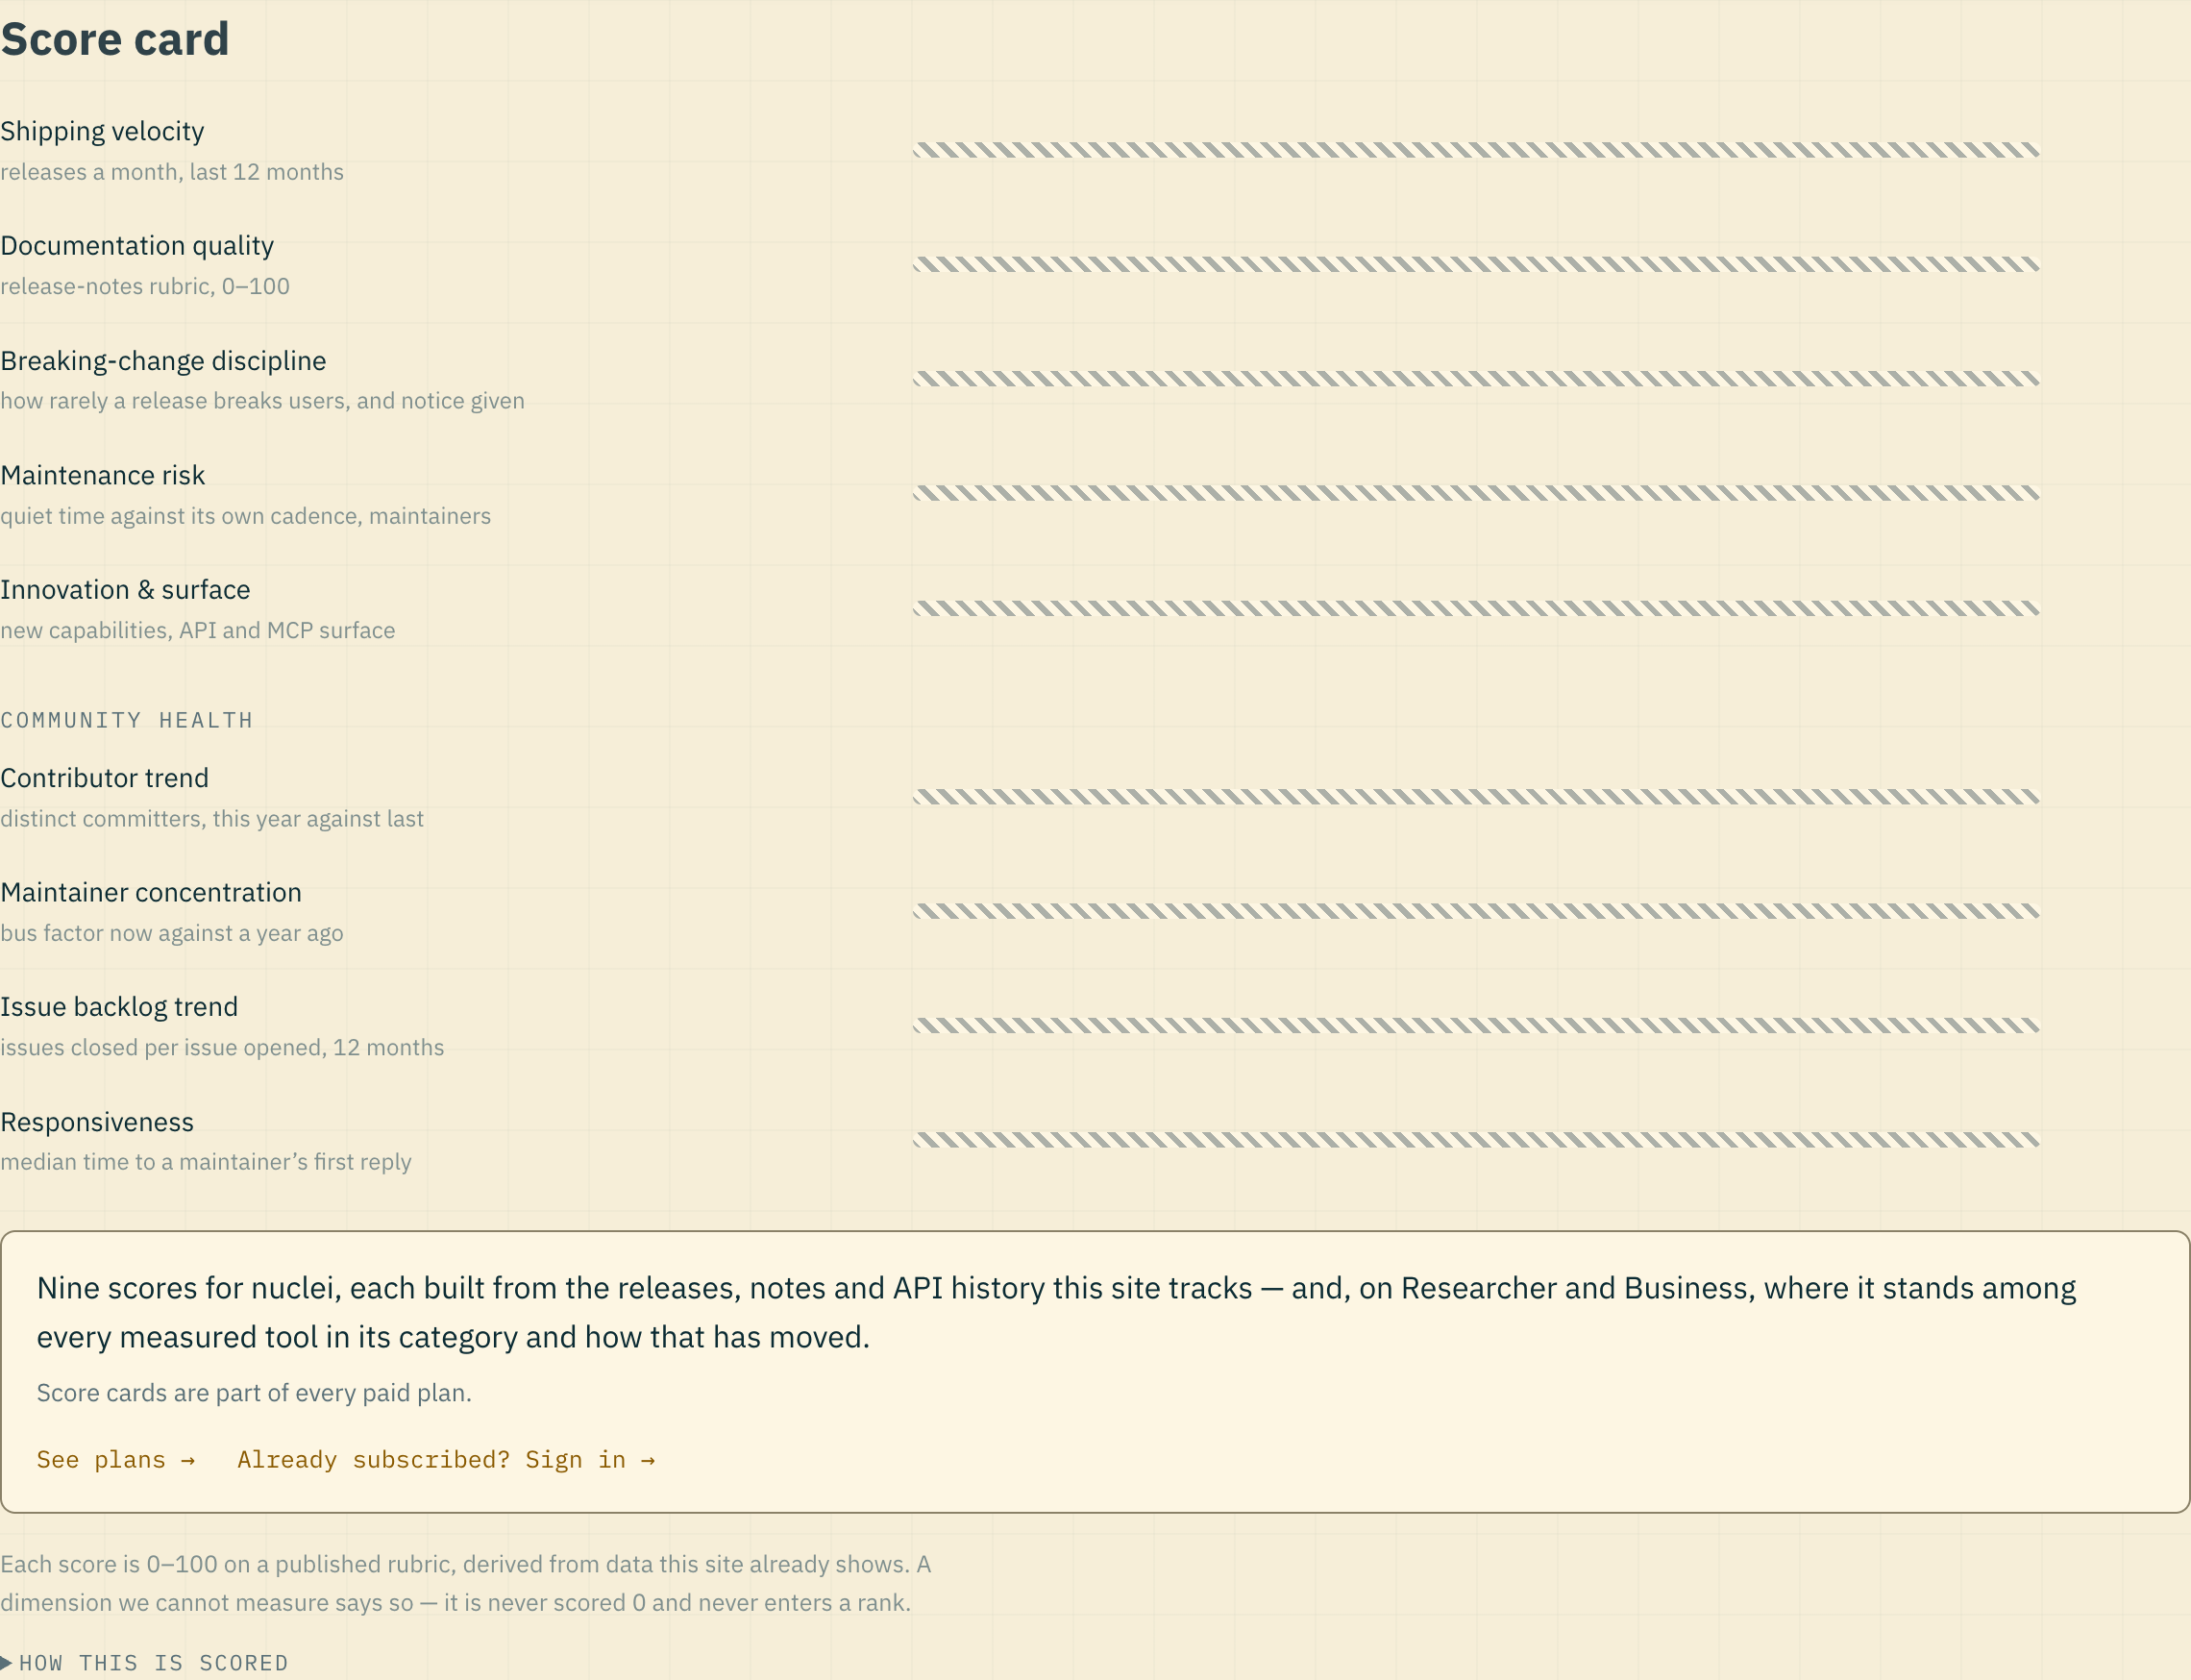
-
Every open-source tool's page now shows how the project itself is doing, not just what it shipped: who files its issues (the community or the maintainers), how fast maintainers answer and close them, how many people commit each month, how many maintainers carry the project and whether that group is growing or thinning, and stars over time. Before, a tool page could tell you a release landed but not whether anyone was still home — now you can tell a responsive, growing project from one drifting into maintenance mode before you build on it. Counts only; no individual is named.
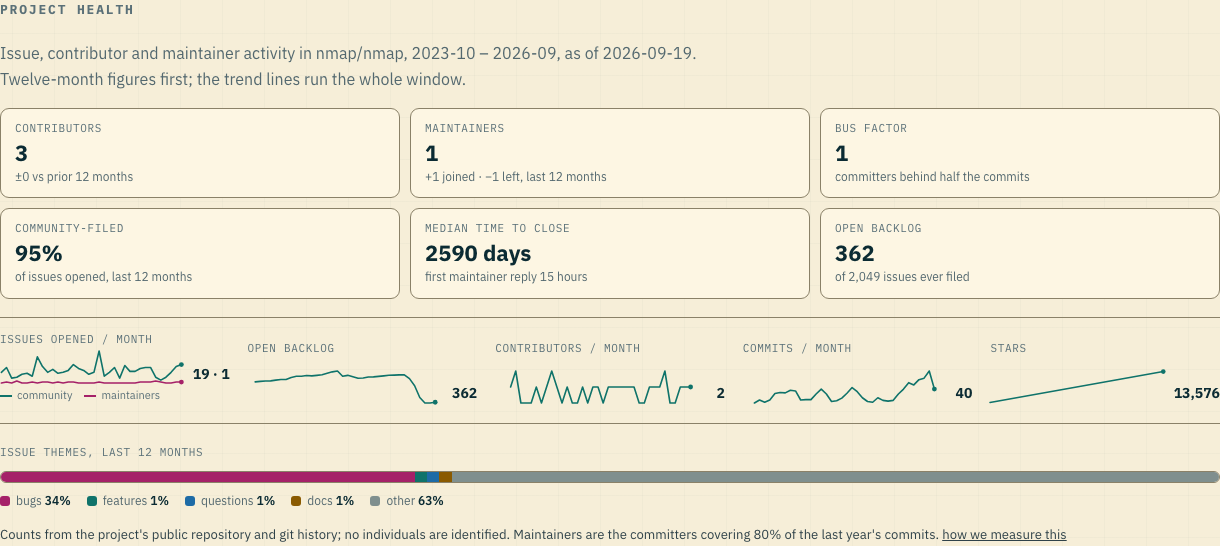
-
A new API key now arrives with five commands you can paste straight into a terminal, your key already in them — instead of one that only proved the key was live. Search every release ever published, pull the issue archive, or ask the MCP server what your subscription unlocks, without opening a reference page first.
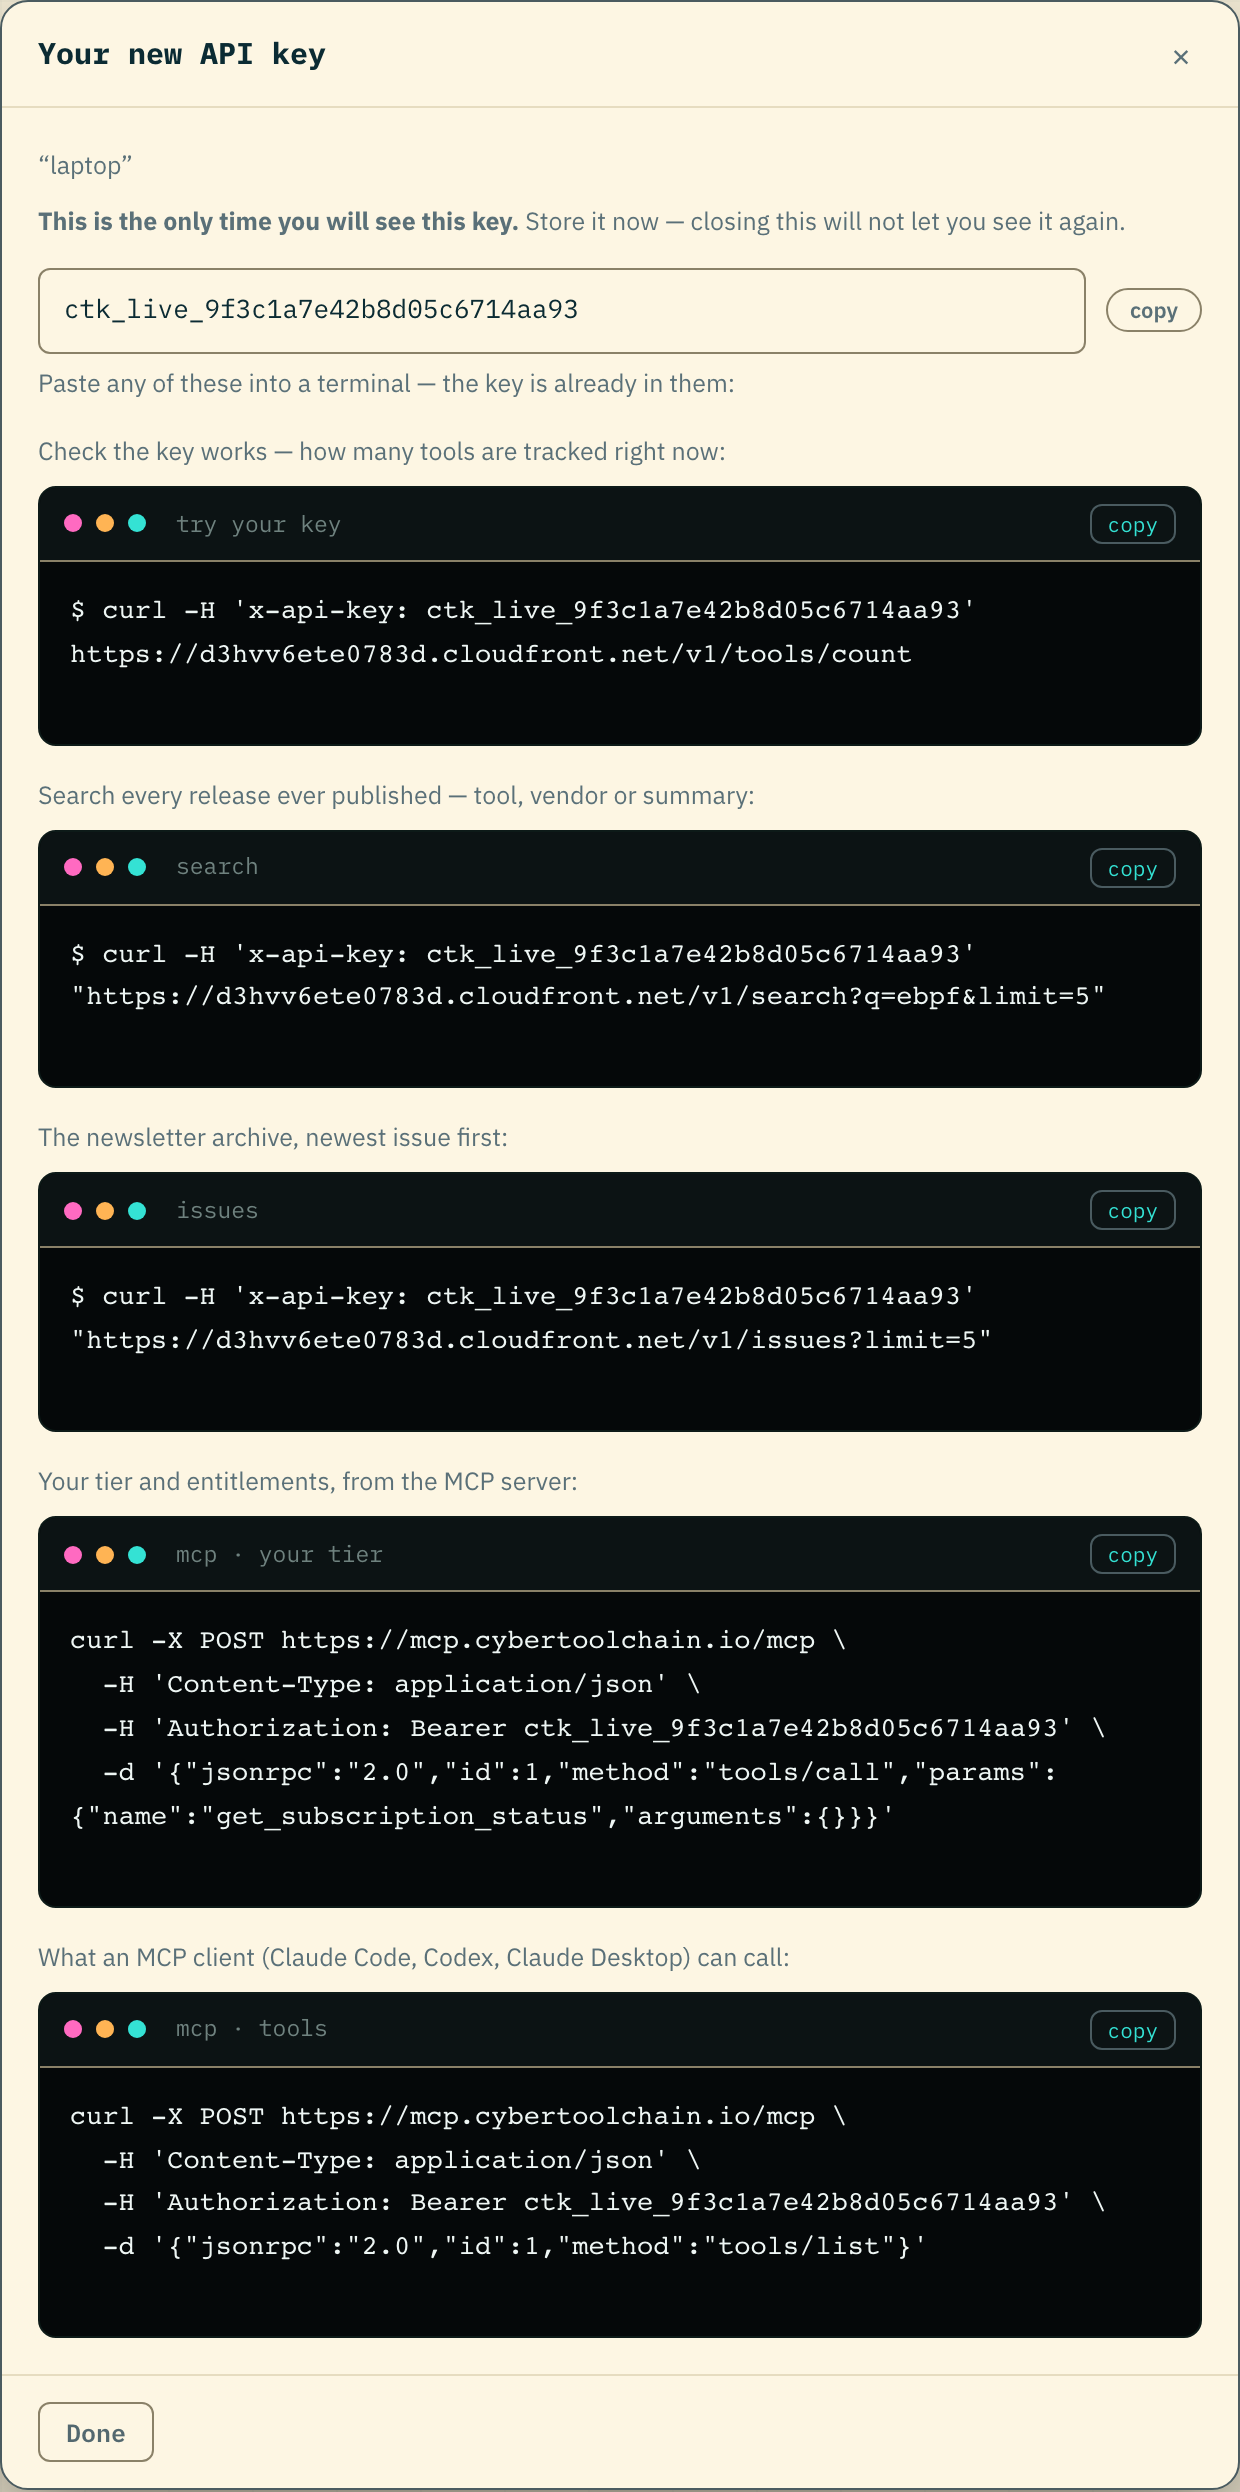
-
Business is now a plan you can simply buy: $1,000 a month, one Subscribe button, and access the moment you pay — no sales call and no company email address. It carries everything in Researcher with no cap on Greps, unlimited answers across the whole corpus, and a quarterly read on your category written for a board. The plans page also stops describing the tier in terms of seats and hand-built watchlists, neither of which it ever needed.
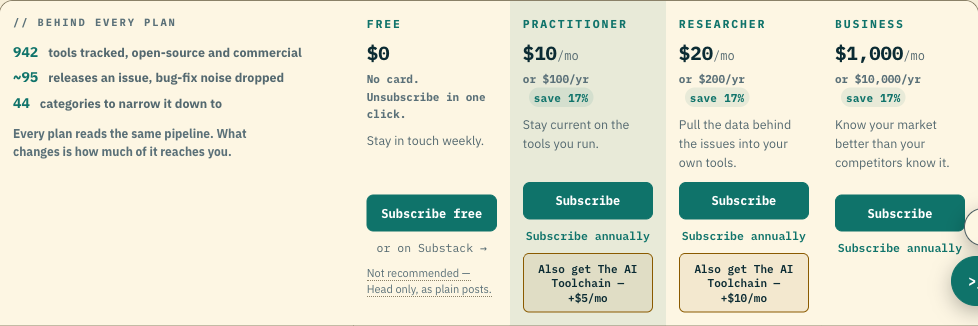
- On Researcher and Business, the score card also shows where each tool stands among every measured tool in its category, the full peer table, and — from the first quarterly reading — whether a move came from the tool itself or from the field around it. A score card for your whole toolchain shows which dimension your stack is weakest on, so you know where to look first.
- Business now includes a quarterly leadership report: which tools moved in their peer rankings, what public vendors newly admit in their filings, who changed prices and which capabilities slid into cheaper plans, and which categories are heating up — a page and a PDF written to forward to a board. The first one covers Q3 2026 and follows shortly after the quarter closes.
- Your coding agent can now ask the MCP server what a tool's command line looks like, what its API surface and SBOM hold, and what the analytics charts say — nine tools where there were six. Researcher and Business see full vendor and tool names in the charts; below that the shapes are there with the names withheld.
- Command-line examples in the API now carry the command that was actually run and the first lines of what it printed, not only a description of it — so you can copy the line instead of reconstructing it.
- Keywords in a Grep — following a capability across every vendor rather than a fixed list of tools — now come with Researcher and Business. A Practitioner Grep that already carried keywords is paused until the keywords come off or the plan moves up; the account page says which, and nothing else about the Grep is touched.
- Uniq issues now link straight to the issue you're reading, so the full record is one tap from the email instead of a hunt through your account. The reading dates at the foot of a Uniq issue are now the evidence for the claims above them: every vendor the issue names carries the dates its page was read and how far apart the two readings actually ran — replacing a roll-call of every vendor opened that period, most of which the issue never mentioned.
*
Sep 17, 2026
-
When one vendor ships the same capability in two products, the write-up now appears once instead of twice, with the second product pointing at it — so an issue stays as short as the news in it actually is.
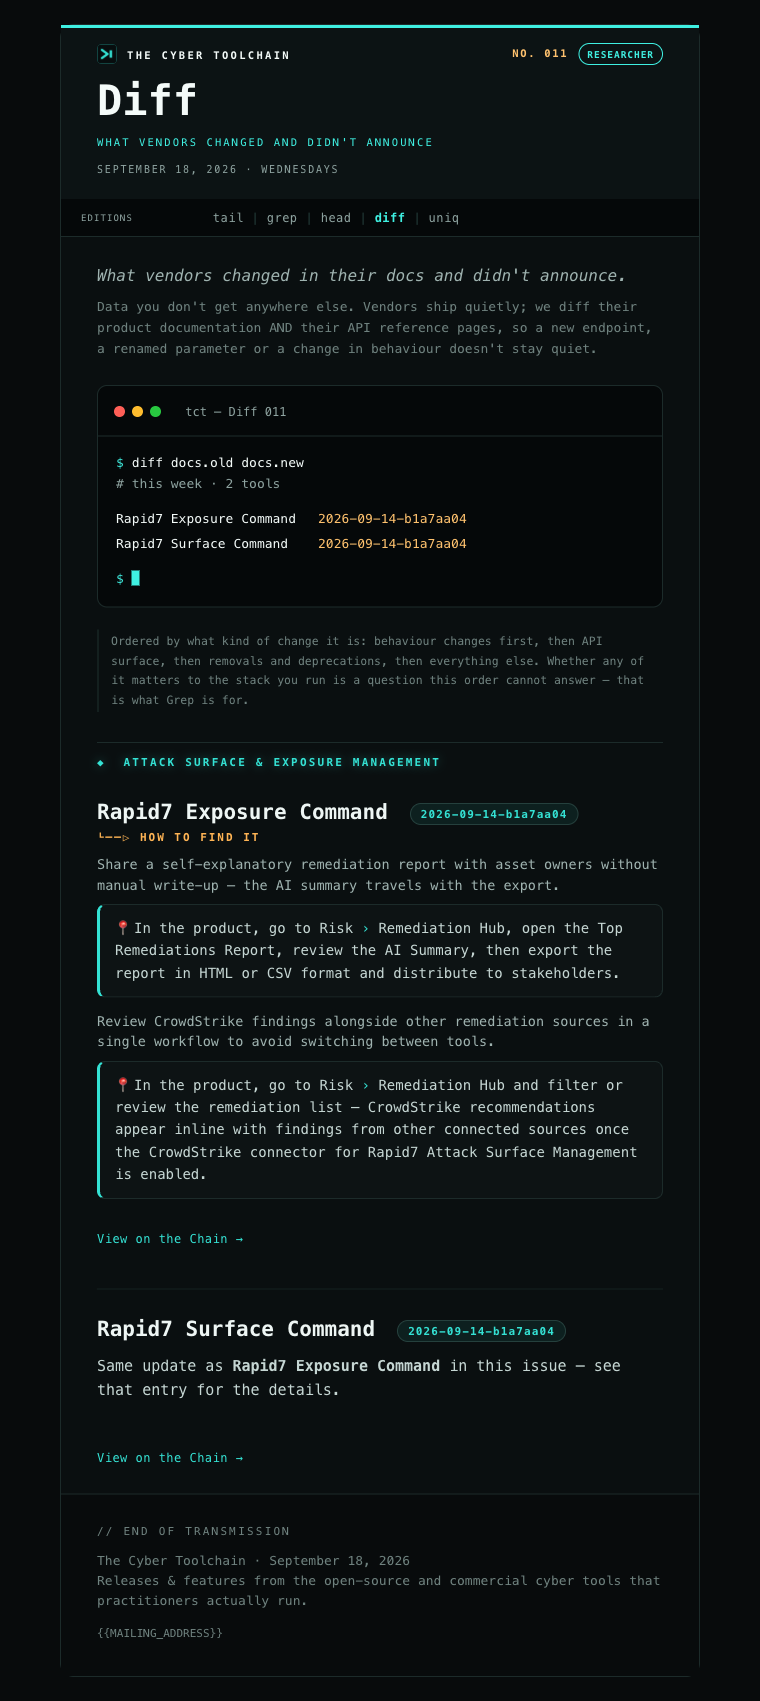
-
Tool pages now show you the command to type. Where the page used to say “no command name is established for this tool” above a list of options you could not run, it reads the tool's own published examples and composes the real command — `$ claude --resume` on Claude Code's page — so picking options builds a line you can copy and run.
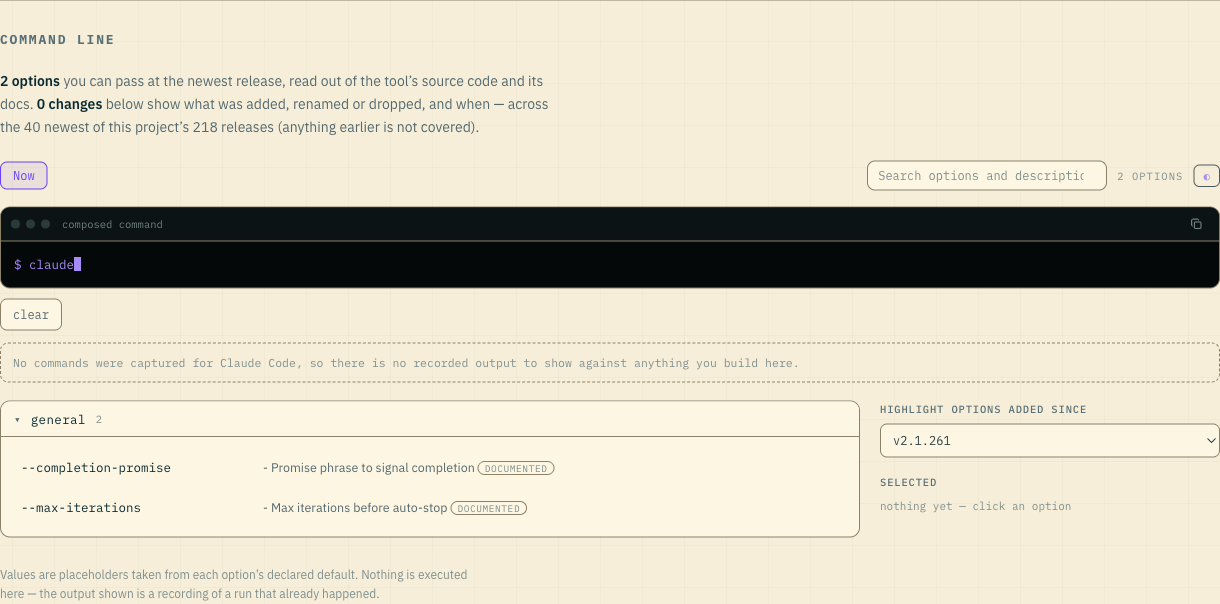
-
VIEW is now one console with two dials: the issue-view dial, and a smaller INFORMATION DENSITY dial beside it — so you set how the issue is laid out and how much of it you get in one place, instead of a separate bar further down the page. It still opens on Everything, and remembers whichever you pick — and the widen-to-window toggle moved into the same console, so layout, amount and width are all set in one place. The license, category, sort and tool-name filters moved into an "Additional filters" drawer that starts closed, so the page opens on the issue rather than four rows of controls. Its summary line always says what's in force, it reopens itself whenever a filter is actually on, and it remembers being left open.
-
Comparing two versions of a tool's API now starts from a rail showing where the endpoints actually moved. Drag its edges to set the range, instead of picking two dates blind from a dropdown — the same control the command-line page already gives you.

-
Tool names on the watchlist now read in full, on one line. A long name like Hugging Face Accelerate used to wrap over three rows or get cut to “Hugg… Face Acce…” — the table scrolls sideways instead, so the one thing you scan for is never the thing that gets truncated.
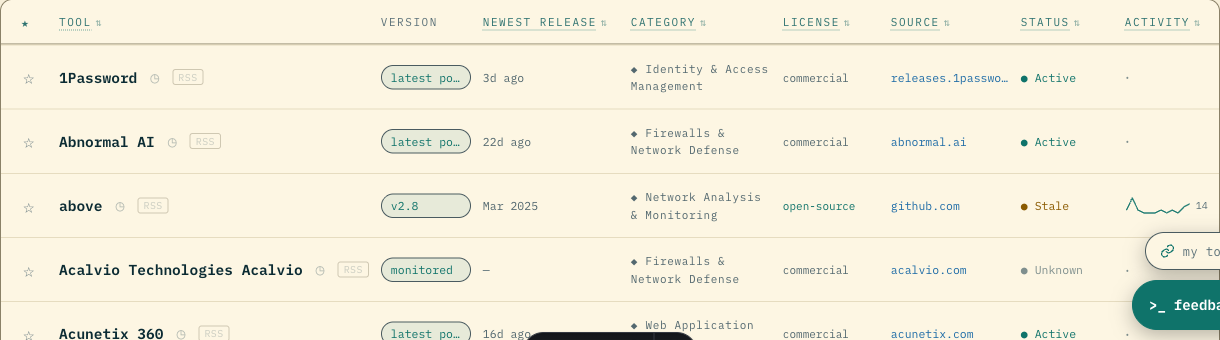
-
The newsletter now renders at whatever width you want it to. A new control above each issue hands the page your whole window instead of the usual reading column, so long command examples, tables and screenshots stop being squeezed — and the site remembers your choice for next time.
-
Screenshots and videos in an issue now open full size. Click a screenshot — or the ⤢ on a video — and it fills the screen, so a vendor's 150-pixel thumbnail of their own UI is finally readable without going and finding the original page. Escape or the backdrop puts you back where you were.
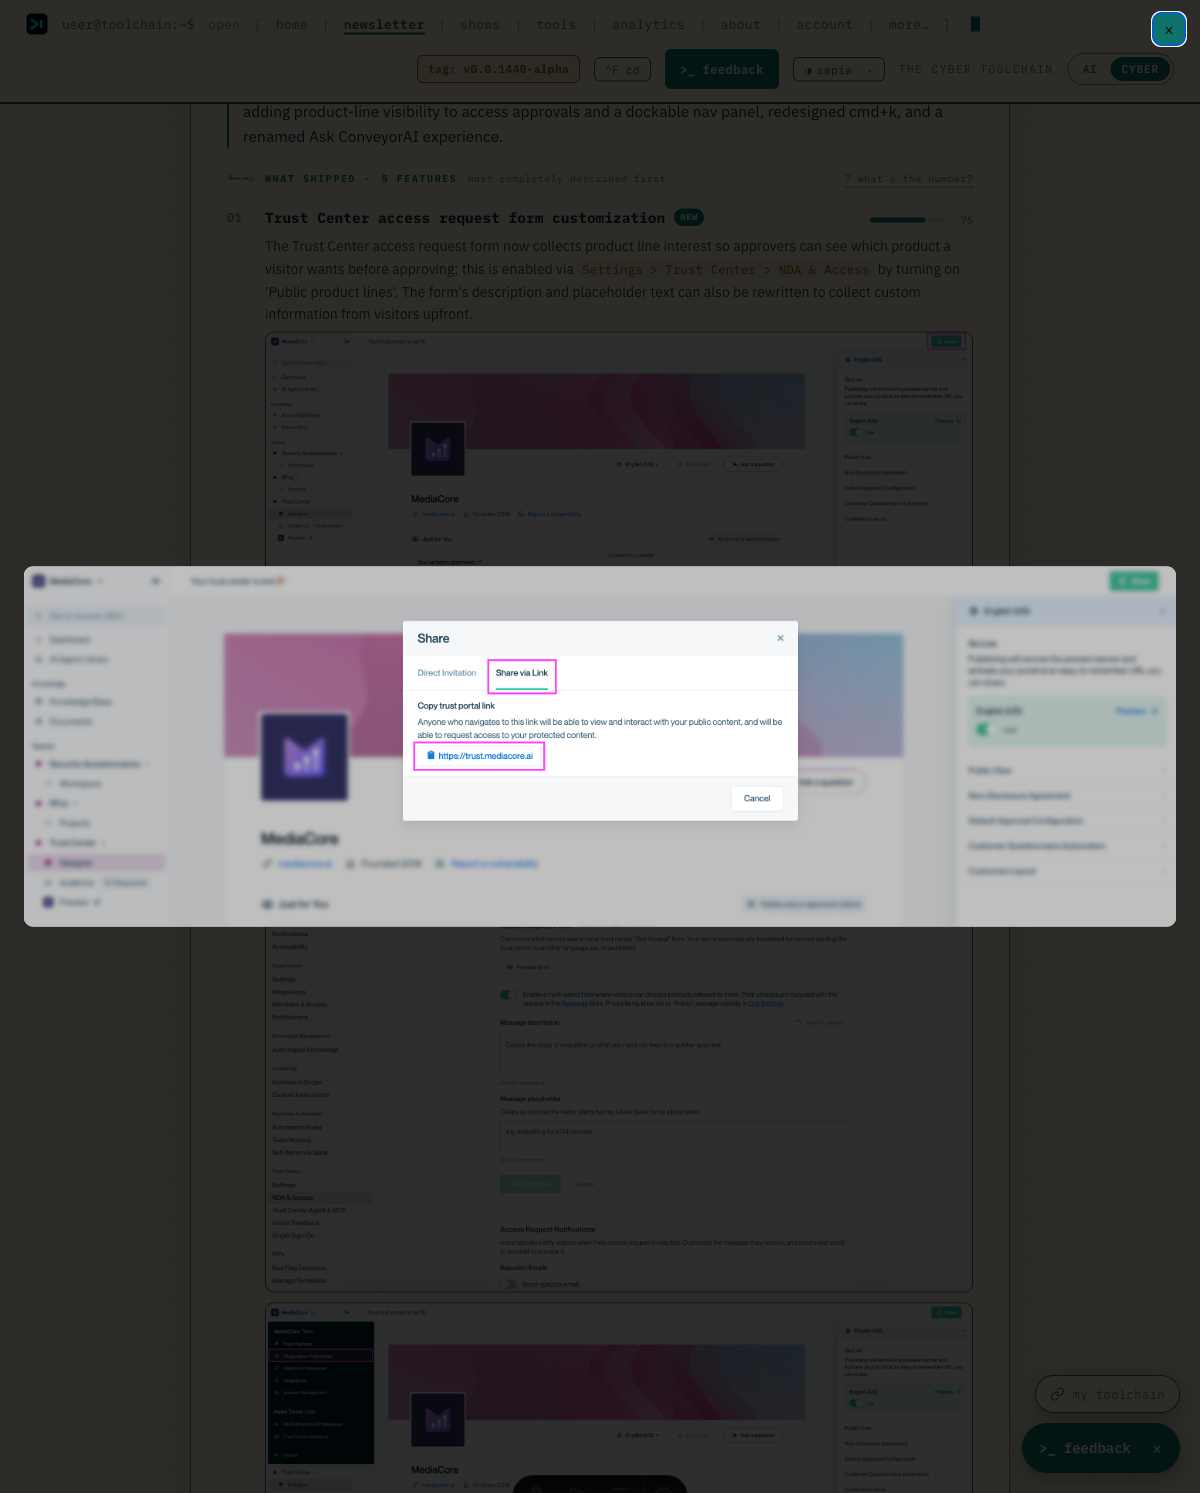
-
Every tool's API page now starts with a command you can run. Open an API reference — 1Password, Cloudflare, Semgrep, any of them — and the first thing you see is where the API lives, how it wants to be authenticated, and one curl already filled in for the endpoint you'd try first, with a copy button. Open any endpoint and its own curl is waiting at the top: host, credential header, path, and a JSON body shaped by the vendor's spec, with the values you supply as shell variables. A filter box and method toggles narrow a long reference in place. Before, the page listed endpoint names and left you to assemble the request from the vendor's docs.
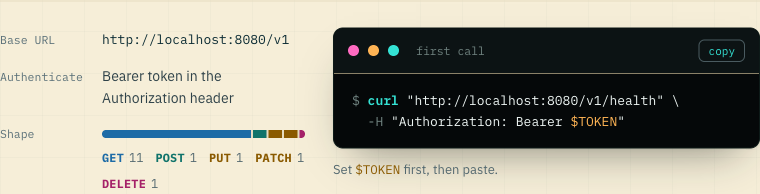
-
An API's history is now on its page, the way a command line's is. Timeline charts how many endpoints each archived version had and what was added or removed, and picking a version re-reads the list as it stood then, with anything removed since struck through. Compare takes two versions and lists what you gain, what you lose, and what to stop calling. On the tool page, the api tab now shows the endpoint count beside it. Before, the page showed only the current surface and a short list of recent changes.
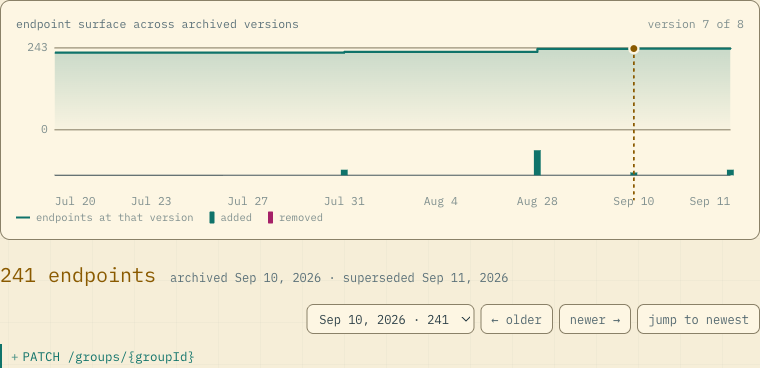
-
The note explaining how each issue is made now starts folded away, so an issue opens straight into the news — click the header to read it, and it stays how you left it.

-
The first position on the issue view dial is now called Scroll: the issue read top to bottom. Every position shows the same issue — the dial only changes how it's laid out.
-
Tool pages read better on a phone: the section menu — summary, features, releases — now sits clear of the heading beneath it, so you can tell the menu from the page it points at instead of reading one crowded block.
-
The column headings on the tools table each have room to breathe now, so Popularity, API and Newest release no longer run into each other and you can tell at a glance which column you're sorting.

-
Picking companies on the hiring charts is quicker. Start typing and matching names now appear in a short list right under the search box, with the letters you typed highlighted; use the arrow keys and Enter, or click, to add one. Before, some browsers showed every company as a long column off to the side of the page.
- Switching between The Cyber Toolchain and The AI Toolchain now keeps your place. Switch from Plans and you land on the other site’s Plans. Switch from any newsletter issue and you land on that site’s newest issue. Before, every switch sent you back to the home page. A page the other site doesn’t have still opens its home page.
- The arrow pointing at Subscribe now keeps nudging you toward it as you read, instead of fading away for good after a few seconds.
- Choose how long you stay signed in from five lengths: 15 minutes, an hour, a day, a week or a month. Pick the short end on a shared computer, or a month on your own laptop so you're not reaching for your inbox every visit. Changing your card still always asks for a fresh sign-in link from your email, so nobody can change it from a browser you left signed in.
- Hovering over the personas on your account page no longer makes the page jump around, so you can compare them side by side in peace.
- The newsletter masthead no longer runs the issue number into the publication name on a narrow screen, so the edition and its number read as two separate things again.
- Grep no longer opens with the day's issue summary. That paragraph described everything that shipped across the whole newsletter, so it routinely named tools your own issue never showed — Grep now starts with your tools and nothing else.
*
Sep 16, 2026
-
Read every issue as the reader you are. Paying subscribers can now choose a persona: Product Manager, Security Engineer, Cyber Leader or Developer. Every issue, in your inbox and on the site, is then filtered to what that reader acts on and rephrased for them: a leader sees the reporting and quantification angle without the flags and settings, a product manager sees the customer problem before the feature. Choose it on your account page, where a real entry shows how each persona reads it; on any issue page, switch personas or back to the full neutral issue in place, with a count of what was kept. Nothing is invented and every number is the original's. The new Personas page explains what each persona keeps and leaves out.
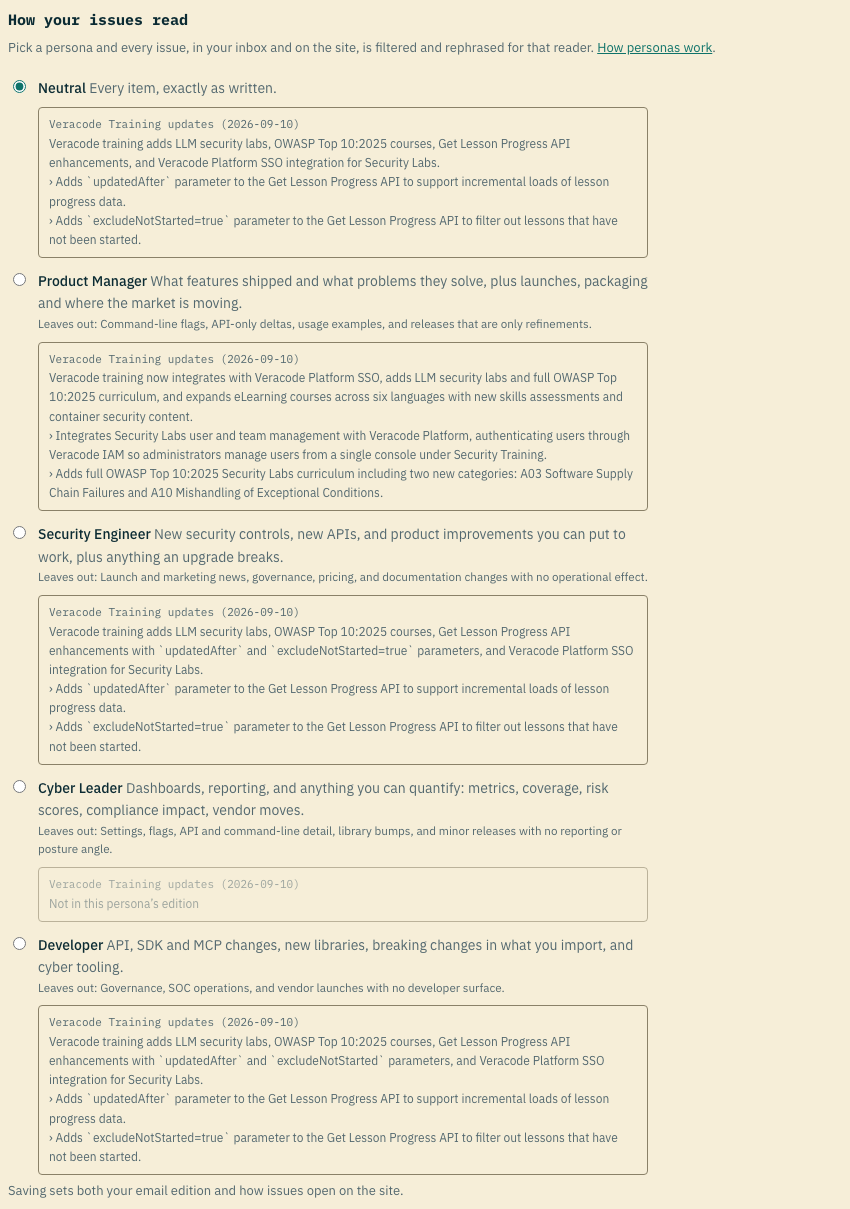
-
Explore real output from newsletter command examples without leaving the issue. Available recordings expand beside their commands on the website, and email links take you directly to them. Commands remain included when no recording is available.
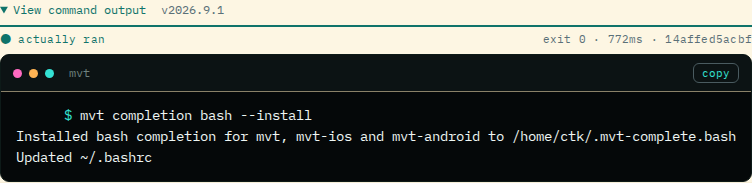
- API catalogs now pick up newer published endpoint lists when site data refreshes.
*
Sep 15, 2026
-
Tool details and plan bundle dialogs now keep keyboard navigation inside the dialog and return you to where you opened it. Newsletter headings also fit narrow phone screens without sideways scrolling.
*
Sep 12, 2026
-
New on Analytics: What people are watching. An attention index for every tool we track, like Google Trends, built from Hacker News mentions, GitHub stars and package downloads. See which categories are drawing more attention week by week, and which tools are heating up or cooling down against their own six-month norm. You can spot a project gaining ground before everyone is talking about it. It's marked Incomplete for now: the star and download counters only started in August, so the early weeks rest on Hacker News alone.
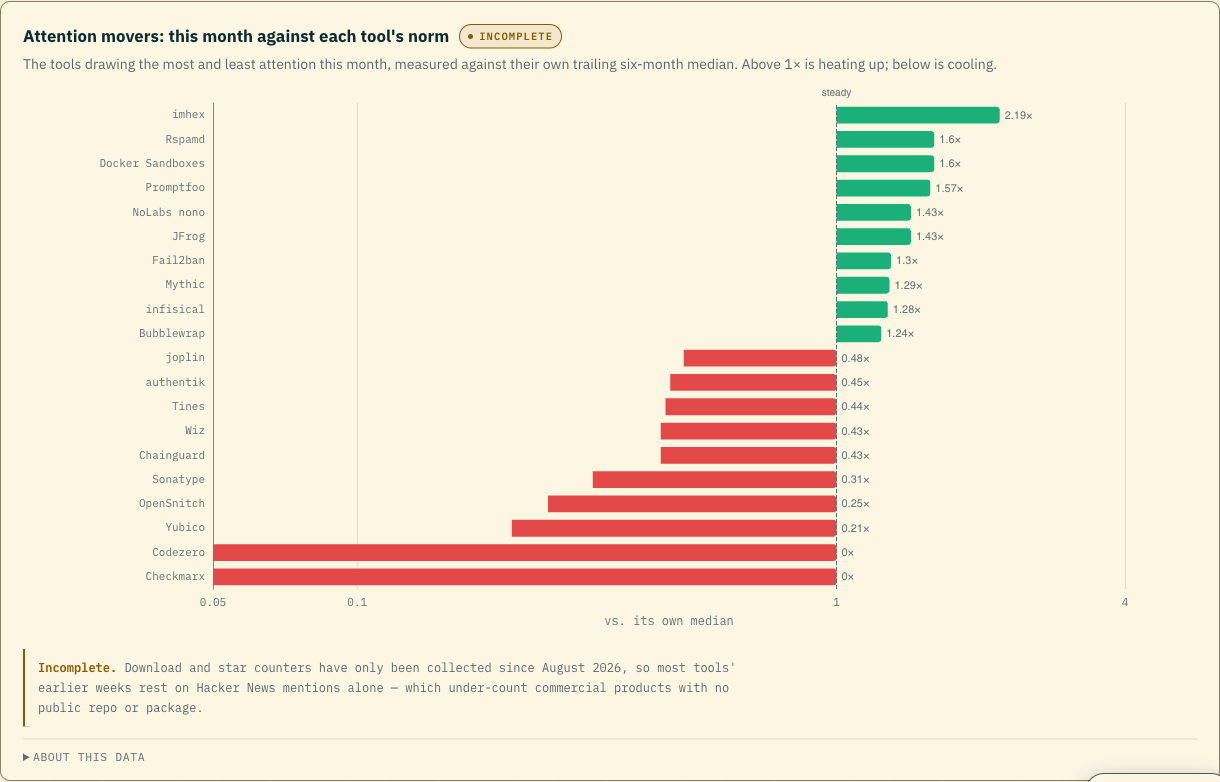
*
Sep 11, 2026
- The Test datasets page now lists 48 datasets, up from 18. New: attack-emulation libraries (Red Canary Atomic Red Team, Datadog Stratus Red Team), Proofpoint ET Open network IDS rules, Microsoft Sentinel's KQL detections, real attacker CloudTrail logs, labeled IDS captures (CIC-IDS2017, UNSW-NB15, CTU-13), abuse.ch and CISA KEV feeds, and vulnerable targets for API, cloud and Kubernetes scanners. You can test a product against the same data practitioners use, without hunting for it first.
*
Sep 10, 2026
-
Dataset pages for multi-file collections like Wireshark Sample Captures and Malware-Traffic-Analysis.net now give copy-ready curl commands for a few example files, so you can pull a capture in one line instead of hunting through the catalogue.
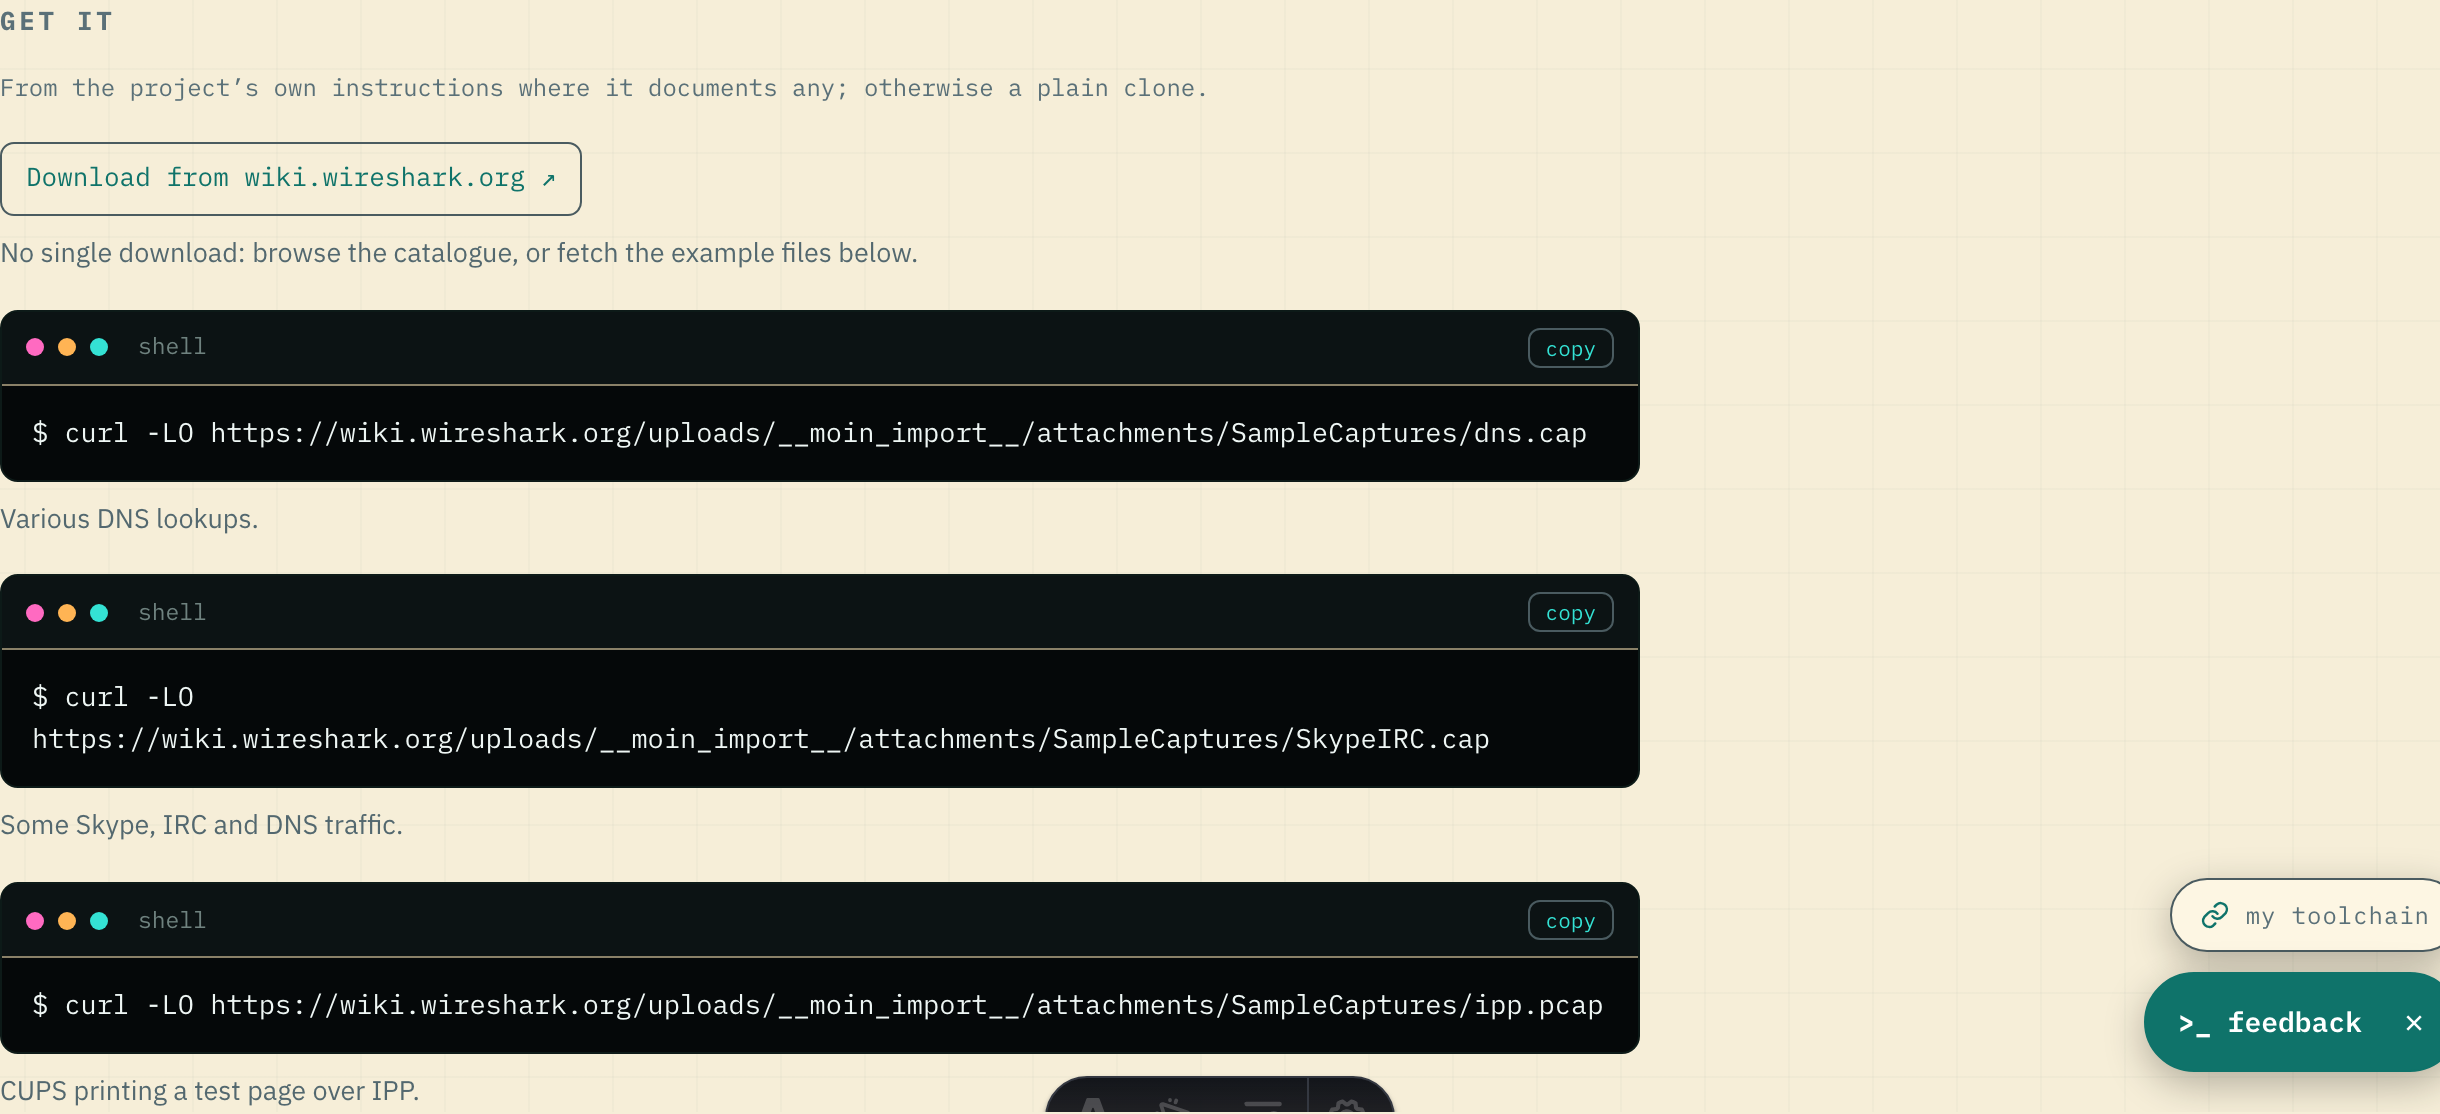
-
New: a Test datasets page. Find public malware samples, detection rules, packet captures, attack logs and IOC feeds to test a cyber product or build detections — filter and sort from the column headings, then open any dataset to see what's inside it, how to get it, and the commands for the tools that read it (like suricata -r sample.pcap). Live-malware collections are labelled and link-only, so nothing lands on your laptop by accident.
-
Grep can now follow a capability, not only a name. Add up to 20 keywords to any Grep — "SCIM", "eBPF", "supply chain" — and it arrives the morning after a tool we track ships something whose summary, feature bullets or breaking changes say that word. Every card in a Grep email now says why it is there ("matched: wiz", "matched: \"scim\" · feature bullets"), the line the preview has always shown. Greps on Practitioner and up also carry the day's API and MCP changes for the tools you follow. And the free plan now holds one Grep of up to three tools, releases only, so you can try it before you pay.
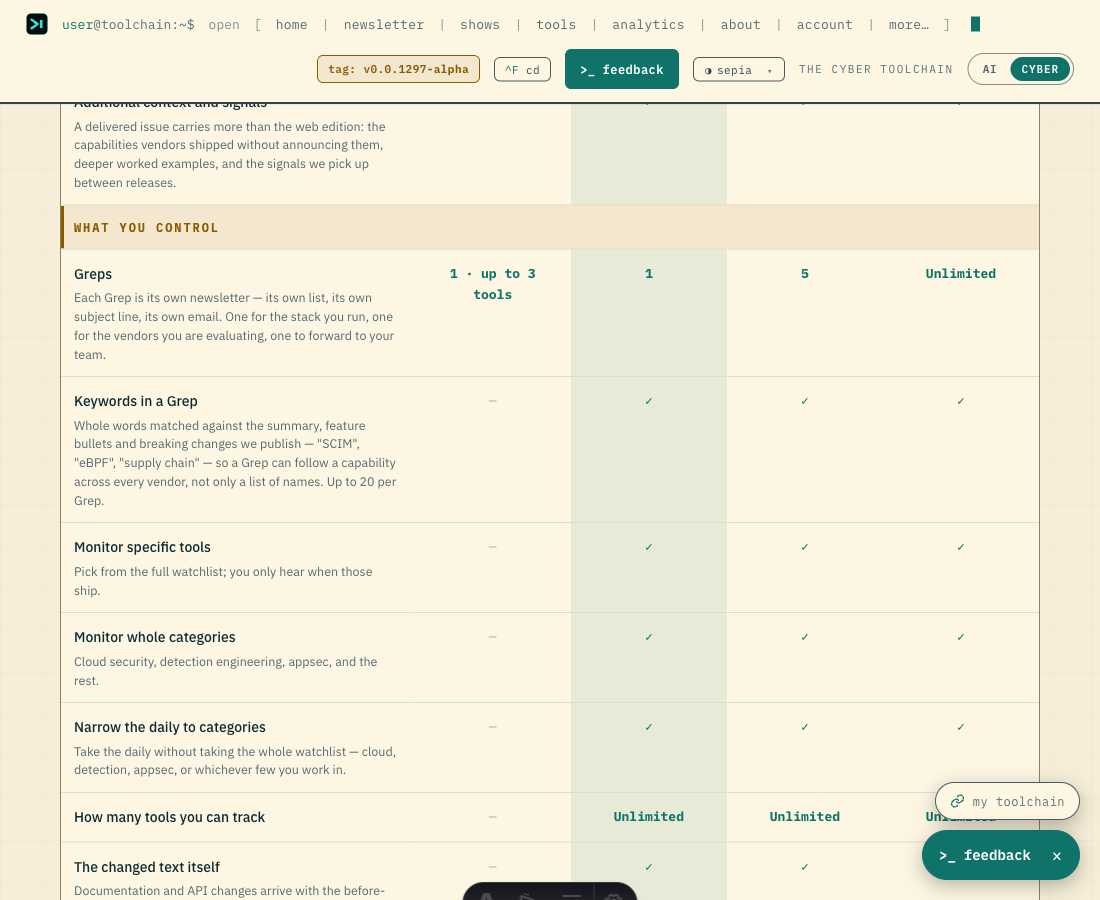
*
Sep 9, 2026
-
This week's Head picks now carry the same two reading controls the daily has: a view dial for the full issue, expand-in-place or a preview pane, and a DENSITY switch — so you can read the week at whatever depth suits you without leaving the page. Collapsed rows keep a one-line summary of what each release actually did, and DENSITY shows a running count ("21 of 26 changes"), so you can see what Briefed dropped instead of guessing. Everything is one click away, and your choice carries across both newsletters. The daily's same control is now labelled DENSITY too.
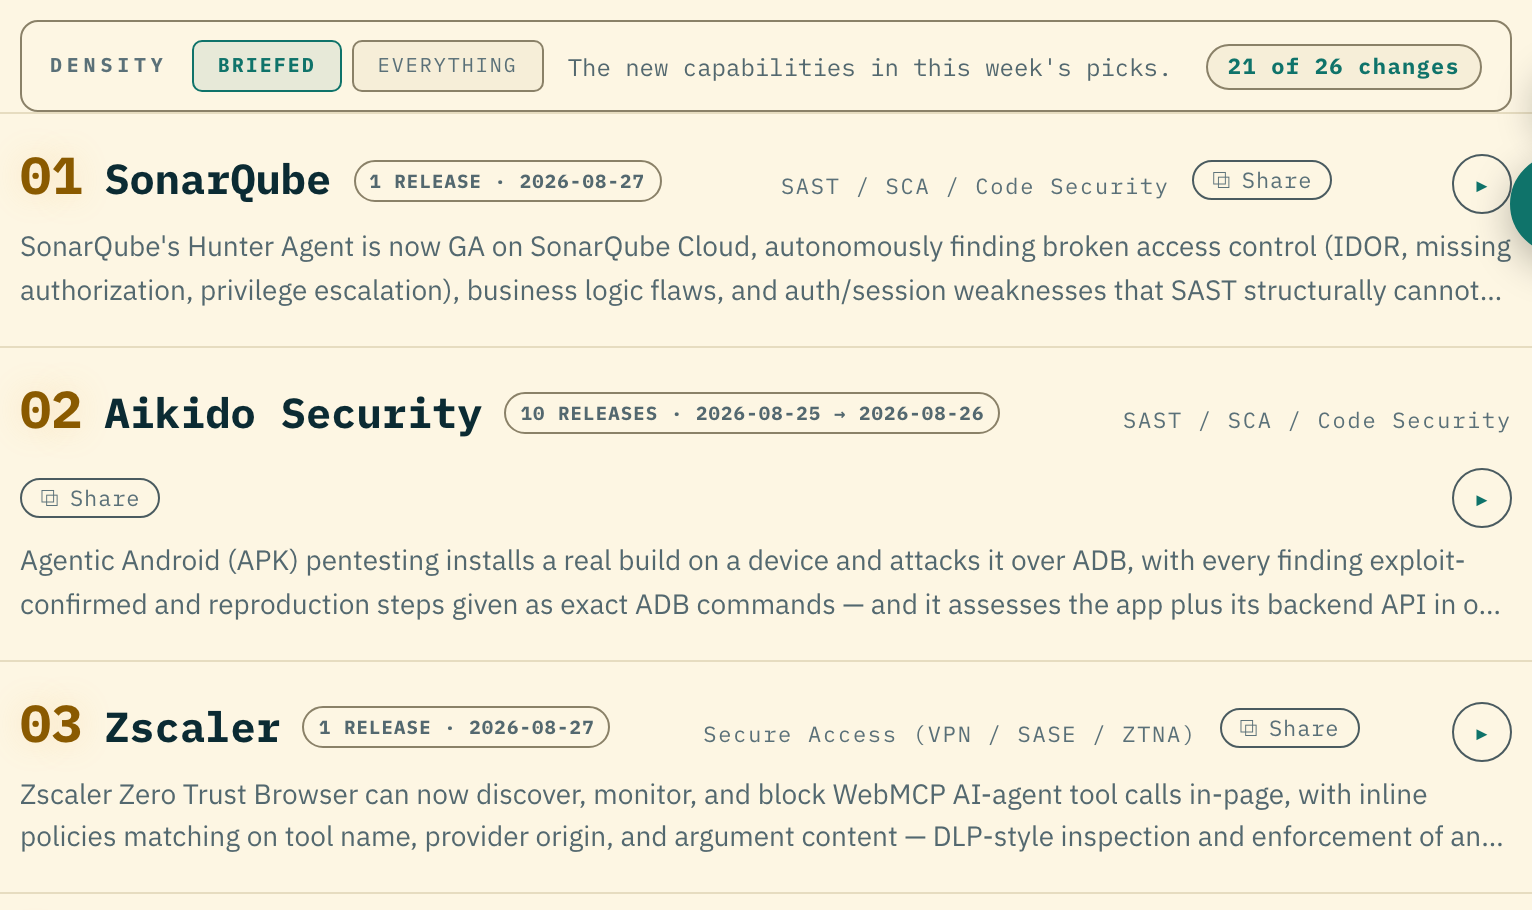
-
Every chart's “About this data” panel now names its sources in plain English — “GitHub releases and tags”, “Vendor public status pages”, “Vendor job postings” — where it used to list our internal database and config file names. If you want to check where a number came from, the panel now points at something you can actually go and look at.

-
A new chart tracks new-tool volume across the whole security market — not just what we track. It sweeps new GitHub repos and Hacker News launches every month, so you can see whether tooling is actually accelerating, independent of our own curation pace.
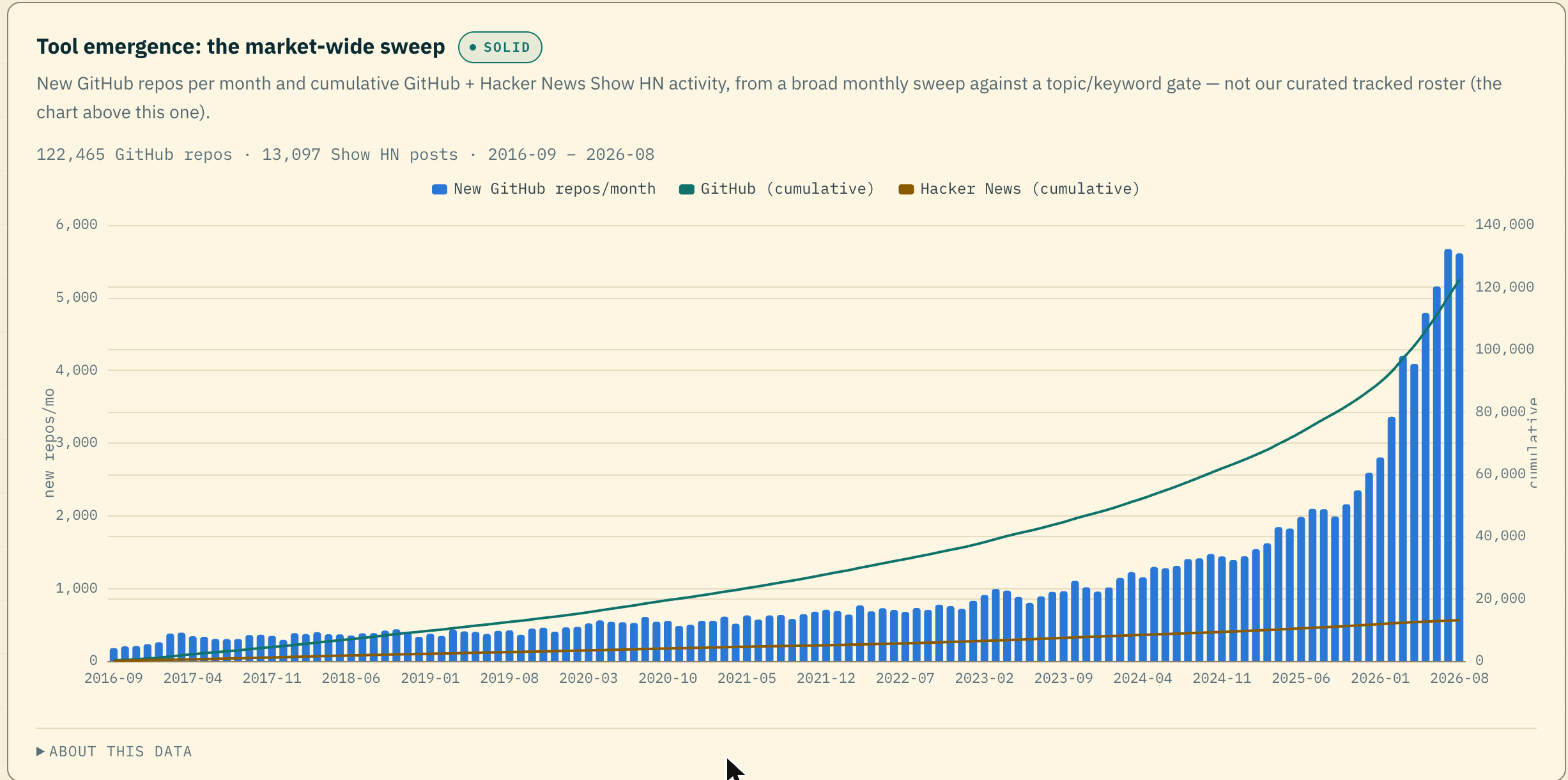
*
Sep 8, 2026
-
Send feedback without leaving the page. Report an issue or suggest a tool, with an optional email address if you'd like a reply.
- The Reliability chart now shows only the platforms Cyber Toolchain tracks. Five AI coding tools and one retired vendor had been appearing there; they now belong to The AI Toolchain’s own Reliability chart instead.
-
Find screenshots from past newsletter issues in each tool’s Screenshots section, with links back to their sources and six more images per click. Newsletter screenshots now use our hosted copies instead of relying on vendor image servers.
-
Every plan on the plans page is buyable, and the page now says so — it had been telling readers that only the free tier was open while four working checkout buttons sat directly above that line.

- Fixed account recreation caused by billing cancellation notifications arriving after deletion.
- Browse every cyber tool in a lightweight alphabetical directory, with descriptions and direct links to release histories and usage examples.
- A tool's page now leads with its release history — how many releases we've tracked, since when, and the latest — instead of repeating the vendor's own one-line blurb, so a search for what changed in a tool actually lands on the page that answers it.
- Every per-tool and per-category feed item now carries a link back to that tool's full history, so you can jump from one release to everything else it shipped.
- A tool page now fetches only that tool's release data instead of the whole archive, so the version picker and the upgrade digest fill in immediately — the file behind them went from 3.7 MB to a few kilobytes.
- A Grep preview still counts every entry your Grep would catch, including the ones written up in Diff. Those now read “This one is written up in Diff” instead of carrying the write-up itself.
- Fixed the command-line box on 7 tool pages (bloodhound, enum4linux-ng, MISP, pwncat, reaver, RiskShard, step CLI) that showed no runnable command at all — pick any flag now and you'll see the real command to copy and run.
*
Sep 7, 2026
-
Expand in place now keeps each tool's one-line summary on screen at the Everything depth, so scanning the issue shows you what a release was about before you open it — switching from Briefed always shows more, never less.
- Our contact address is now info@cybertoolchain.io — same address, now on our own domain instead of a lookalike one, so replies and erasure requests land in the right place.
- Tool page summaries now highlight commands, flags, and functions in color instead of showing raw backticks — matching how the newsletter already reads.
*
Sep 6, 2026
- Your back issues on the account page now read properly on a phone. Each issue's number, date, what is in it, and the copy/read/download buttons stack down the screen instead of running off the right edge with the buttons out of reach.
- Sentences that ran into a link with no space between them — "See theAPI docs" — now read normally across every page on the site.
-
Diff now shows you what changed, not how much a vendor wrote. Every tool's week reads as a short diff — + documented, ~ changed, - removed — ordered by the kind of change rather than its length, with the tools that changed documented behaviour named at the top. The issue carries the changes worth your attention and names the rest with a link, so a week of documentation drift reads in about six minutes instead of ten and a half.
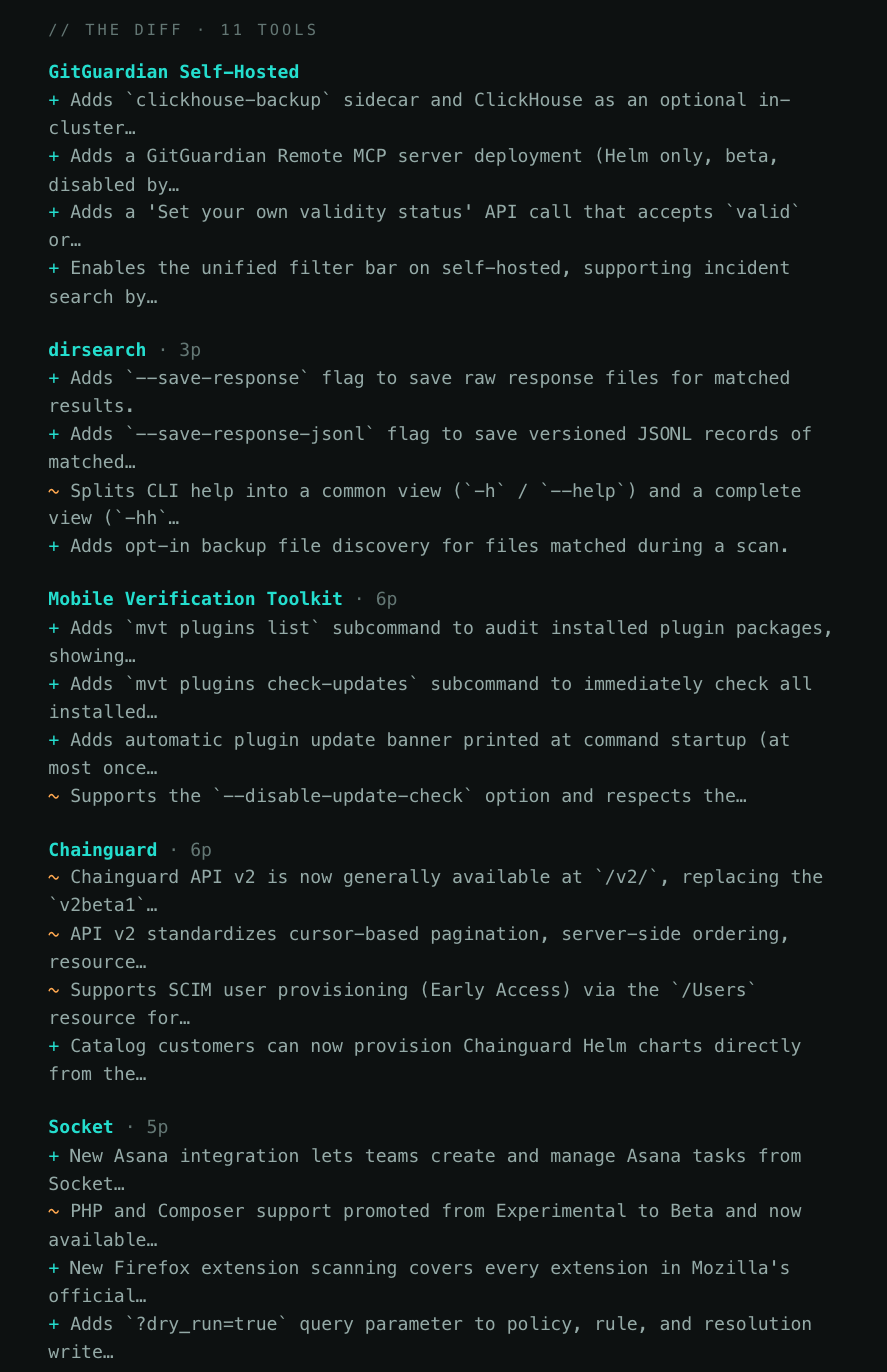
- Adding the other Toolchain to your plan now moves the subscription you already have instead of starting a second one, so the bundle costs you the difference rather than two full plans. And if you're already subscribed, a Subscribe button sends you to your account to change your plan rather than opening a second checkout.
*
Sep 4, 2026
- A tool's code-analysis page can now show a real screenshot of its desktop window, captured by running the tool itself in our sandbox — so a reverse-engineering or forensics GUI shows you what it actually looks like before you install it, alongside the source-derived facts we already publish.
- Briefed now narrows every entry, not just most of them. Entries built from a tool's commit history used to fall back to showing their summary; they are now read down to the genuinely new capabilities like the rest, with the refinements held behind Everything.
-
Briefed now leaves out the tools it had nothing to say about. A category heading with a tool name and no news beneath it told you nothing; those tools — and any section left empty by them — are gone until you switch to Everything.
- Briefed also drops the items that only refine something you already run, so what is left is the day's genuinely new capabilities. Where an entry has no such labelling to go on, its summary stands in for the bullet list and says how many details Everything holds.
- The editions line at the top of every issue now lists only the newsletters this site actually publishes, so you are never pointed at an edition you cannot receive.
- The command-line card in each issue now fills the width of the email on a phone instead of shrinking to a narrow box in the middle of the page.
- The daily email now opens with the three releases that matter most, rather than the three we happened to write about at greatest length — the same ranking the website and the issue's own summary already used. Each gets its four biggest changes with a link to the rest, so the top of the issue is the news instead of whichever vendor writes the longest changelog.
*
Sep 3, 2026
-
Every tool in an issue now carries a tier marker next to its name — hover it and you'll see exactly why that tool ranked where it did: the feature scores it earned, and the bonuses for a breaking change, a product screenshot, or a command you can actually run. Before, a tool getting one line in the index looked the same whether it scored badly or just had a quiet week. The full rubric is published on the methodology page, so you can re-derive any score yourself.
-
Tool pages no longer repeat a tool's tagline as its own Summary — when there's no fuller AI-generated summary yet, that section now stays quiet instead of just restating what you already read above.

-
The issue summary at the top of each newsletter email now sits in its own bordered box, labelled // SUMMARY — so you can tell the read-this-first overview from the first tool's write-up without reading a paragraph to find out which one it is.
*
Sep 1, 2026
-
The “prefer light or sepia?” nudge no longer shoves the page sideways on a phone. It hung a few pixels past the screen edge, which let every page scroll horizontally — now it sits inside the frame and the page stays put.
-
The charts on the home page are drawing again. Shipping velocity, release-note themes, best release notes and the language mix had been coming up blank — so you can size up the market at a glance without opening /analytics.
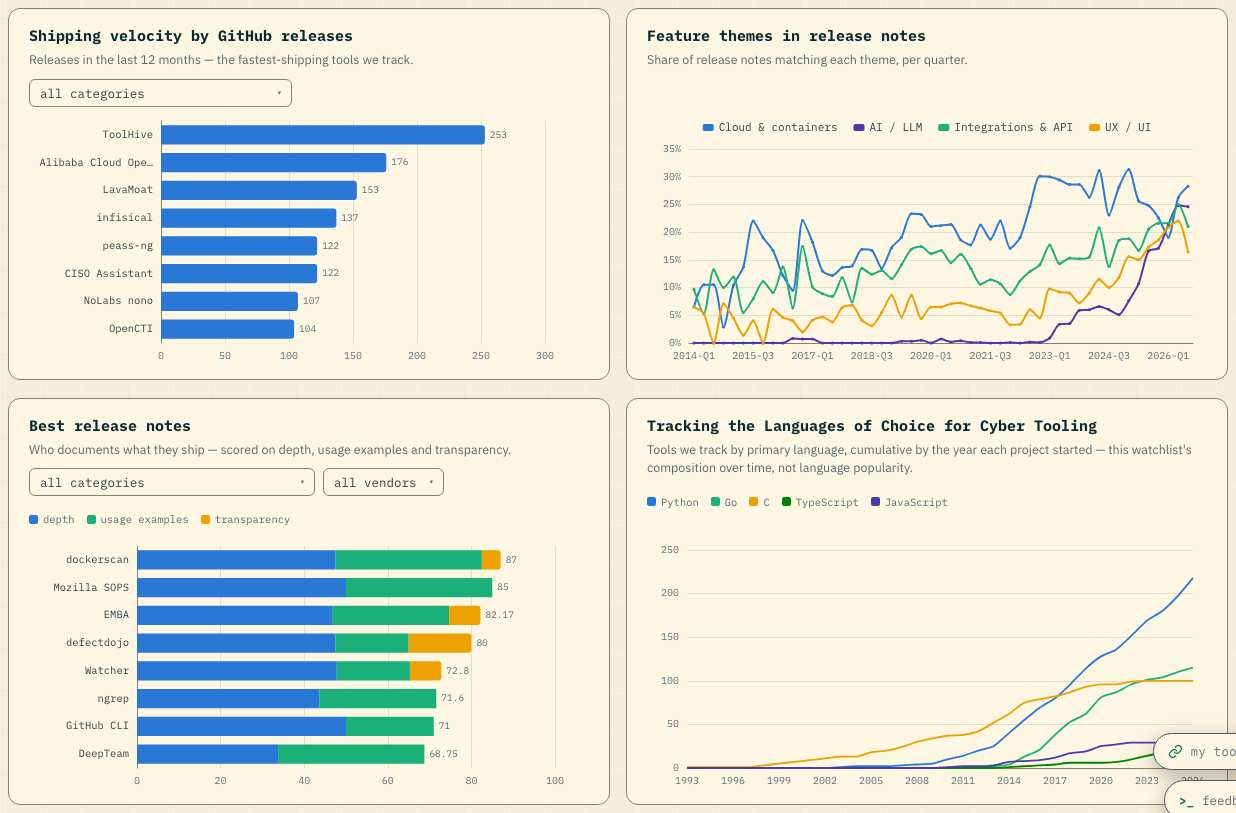
-
Release entries no longer repeat their lead sentence as the first feature bullet, so every line adds new information instead of making you scan the same point twice.
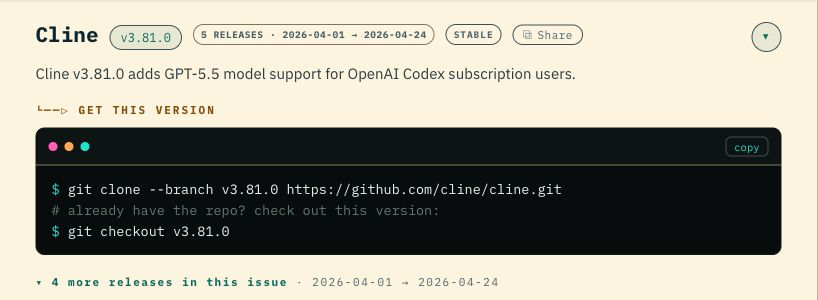
*
Aug 31, 2026
-
The newsletter's sort control now says “sort by” rather than naming the order it happens to be in, so it's clear you can reorder an issue before you open the menu.

-
Switch on Monthly or Quarterly Reports and you now see exactly which tools a report will be sent for, listed under the switch — so you can tell at a glance whether your Greps name the tools you meant, instead of piecing it together from your Grep list.
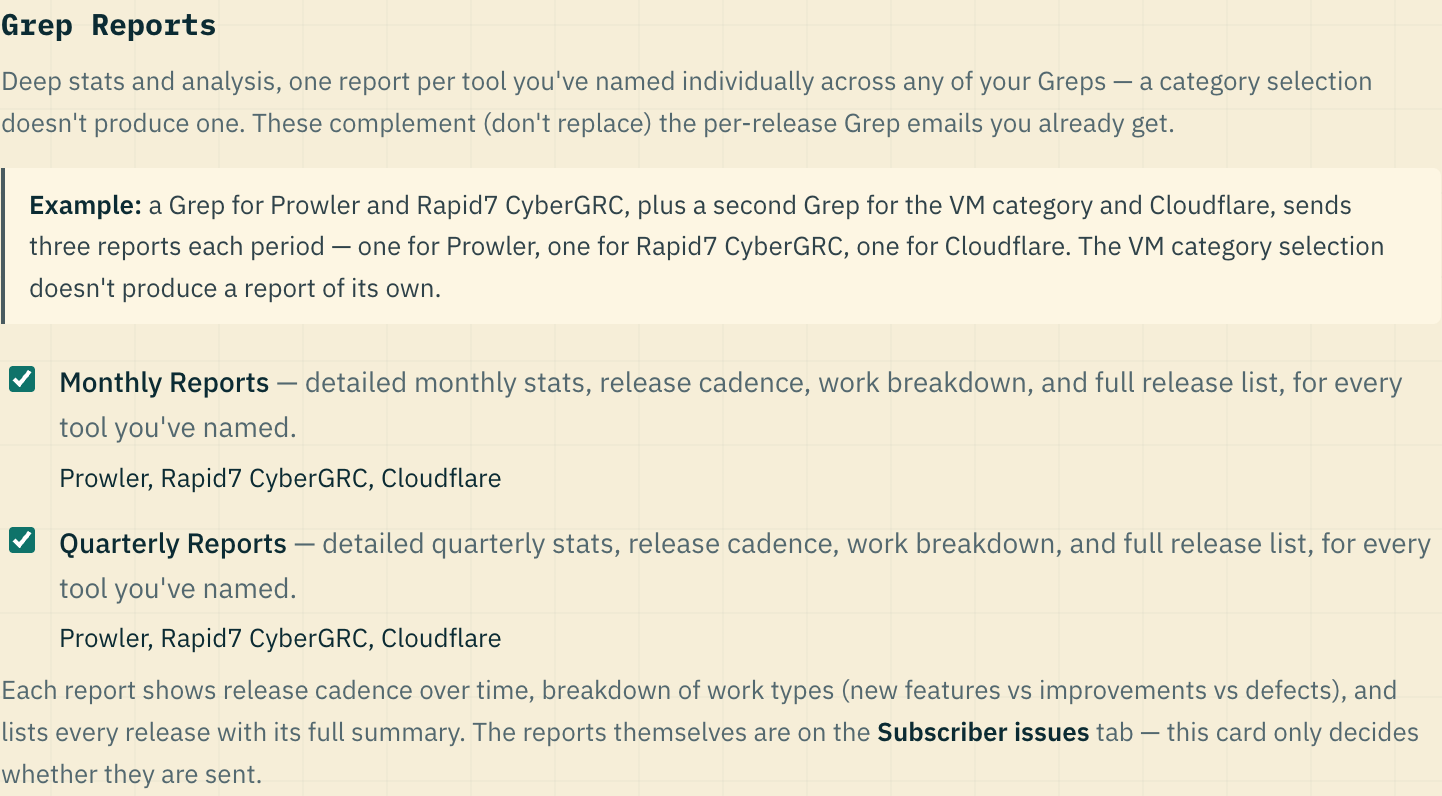
-
The “thinner coverage below” divider now only appears where the coverage actually drops off. On entries where every feature was documented thinly it sat above the first item with nothing above it to compare against — so it said less than nothing.
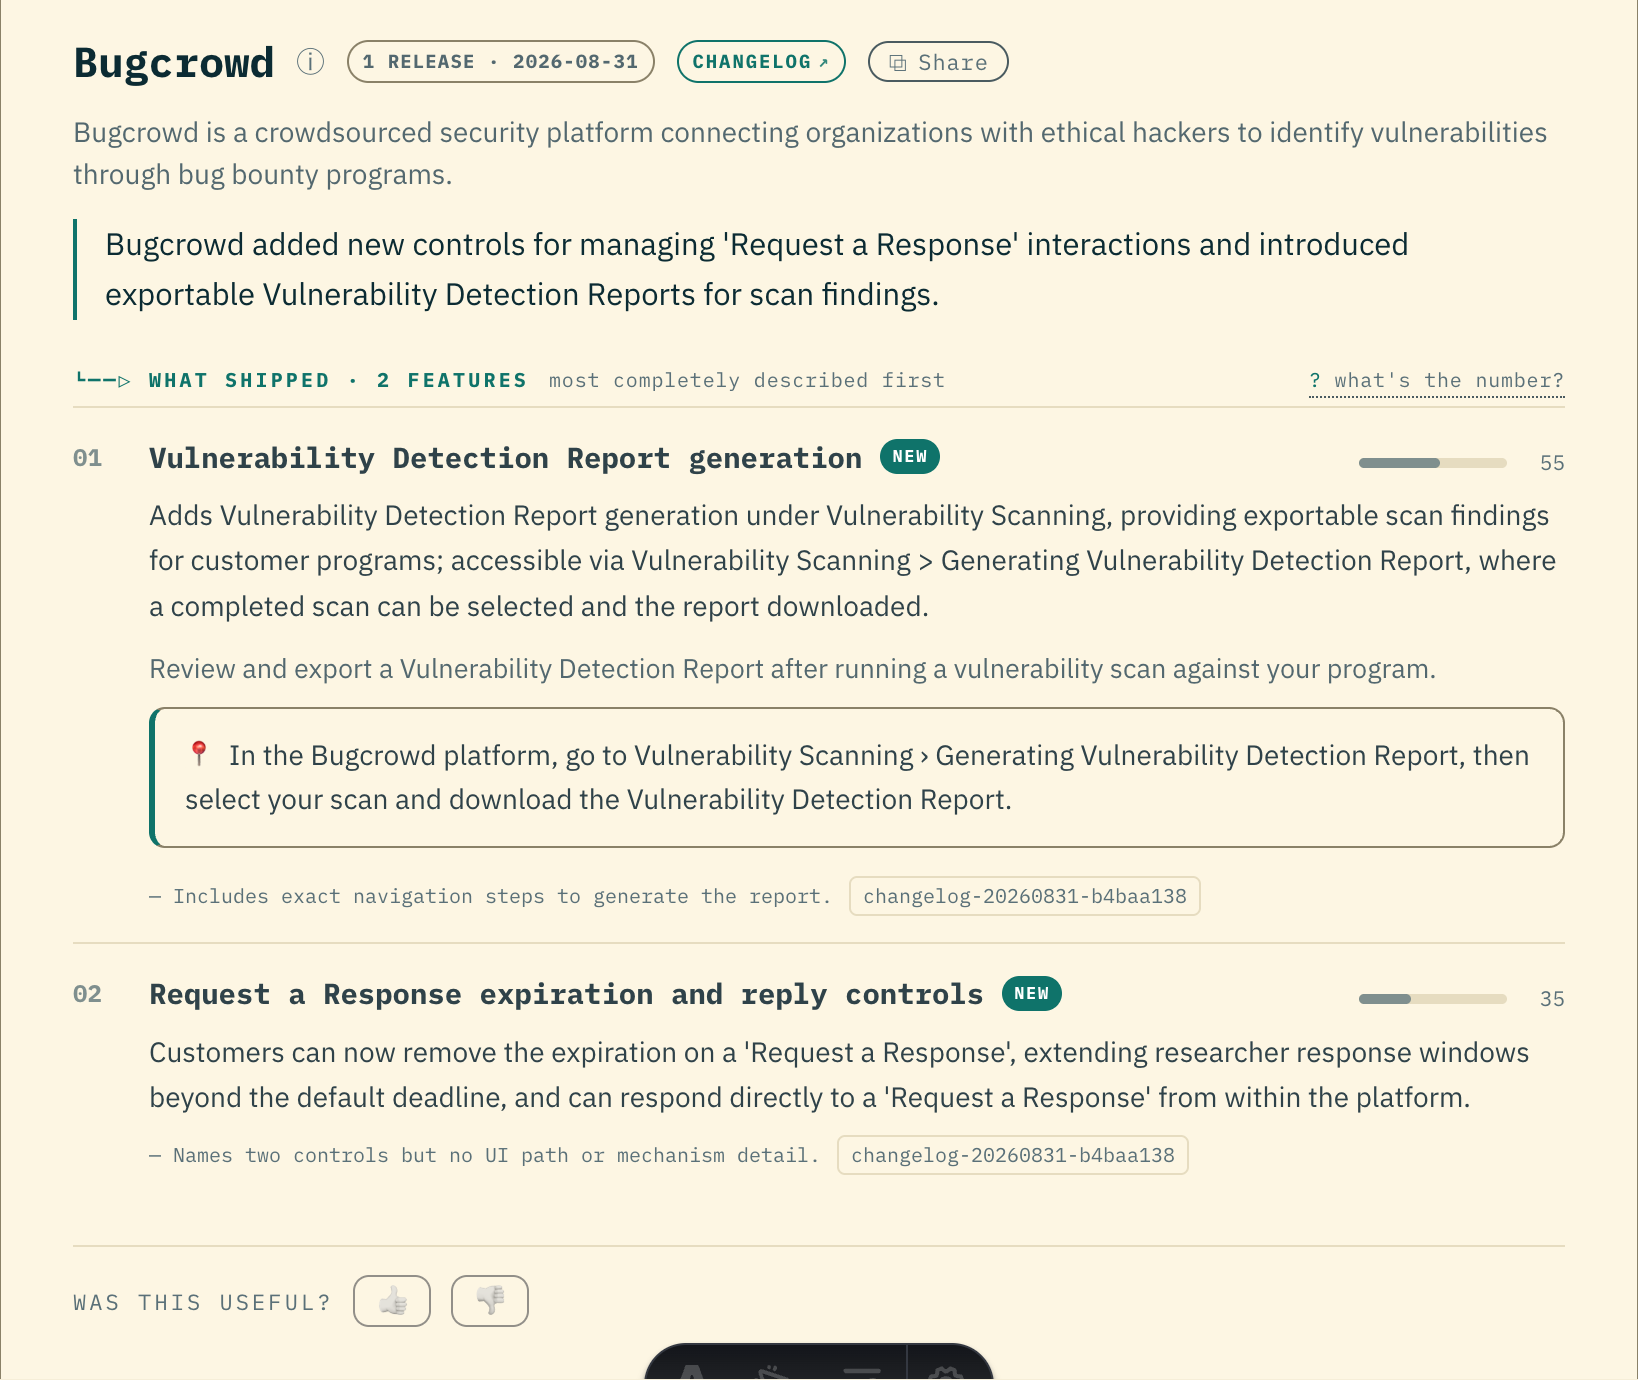
-
An issue now opens on everything it contains, with a brief across the top written to be read first: what stands out today, grouped by what it lets you do, every tool named linking to its entry. Contents and The Brief each fold away from their own header row, so you can put the preamble aside once and have it stay that way.
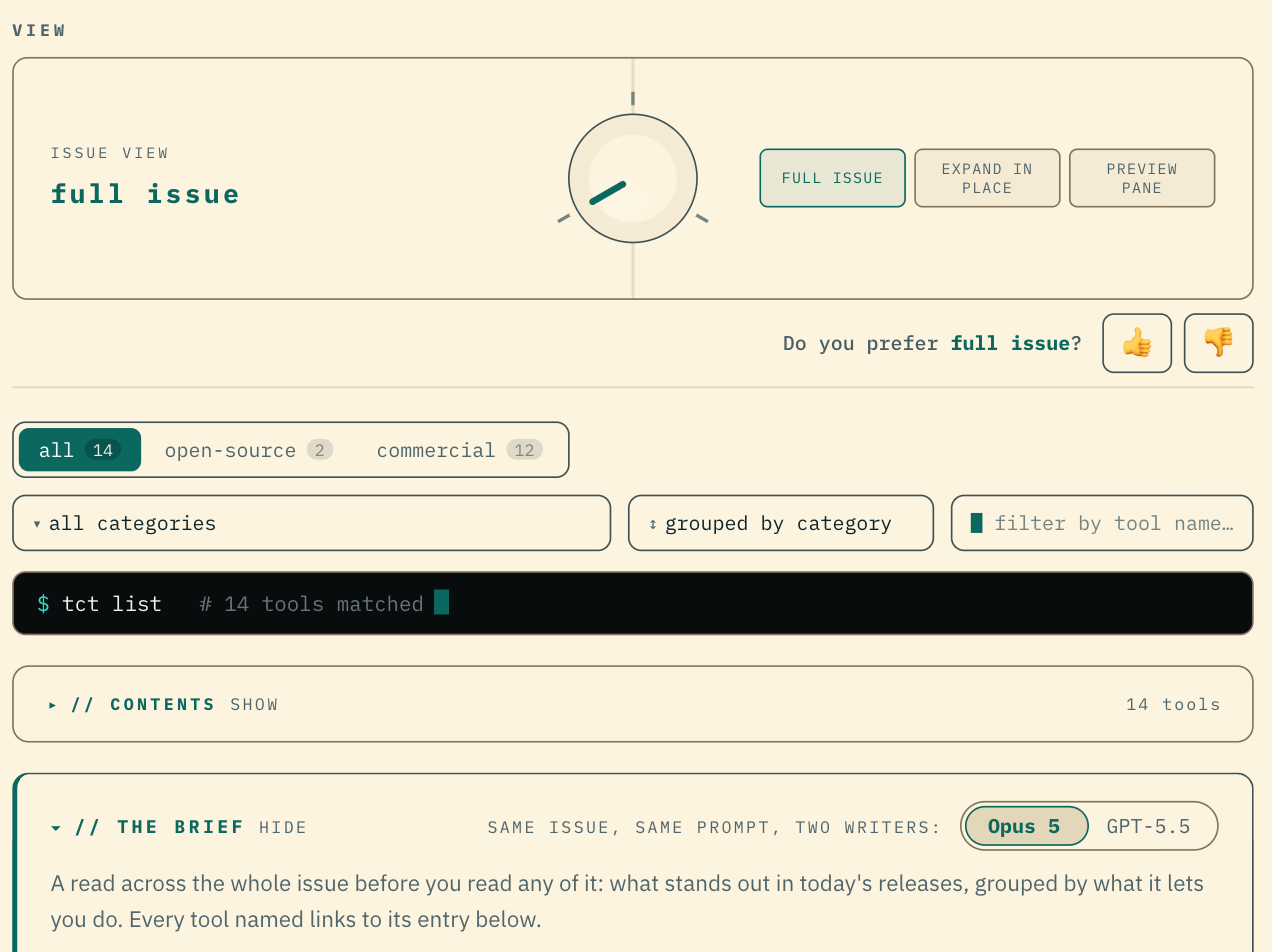
- The filter box on an issue blinks a cursor now, so it reads as somewhere to type rather than a label.
*
Aug 30, 2026
-
The full diff on a Product Docs Weekly entry now reads as before-and-after. Switch it to side-by-side columns, or to stacked blocks showing what the page said and what it says now — pick once and every entry follows. Instead of reconstructing a patch in your head, you see the vendor's edit the way they made it.
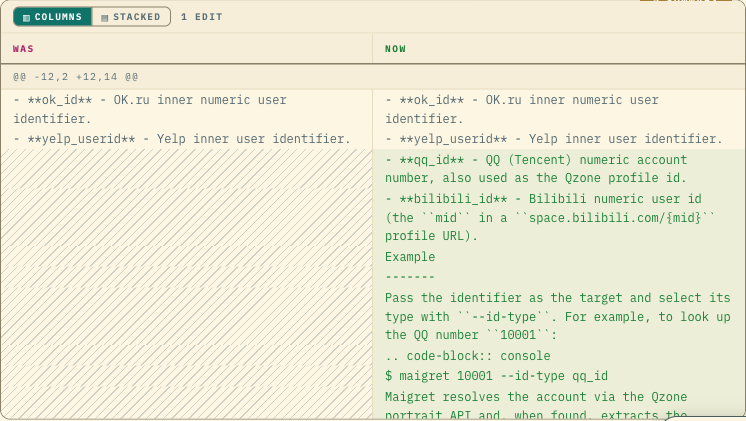
-
Your Grep reports now sit on the Subscriber issues tab beside your Diff, Head and Uniq back issues, instead of at the bottom of the settings form — one row per tool with a Monthly and Quarterly pill each, so you can see what is ready to read without scrolling through a page of controls. Settings keeps the switches that decide whether reports are sent. The “these links are private” notice is now said once at the top of the tab rather than three times.
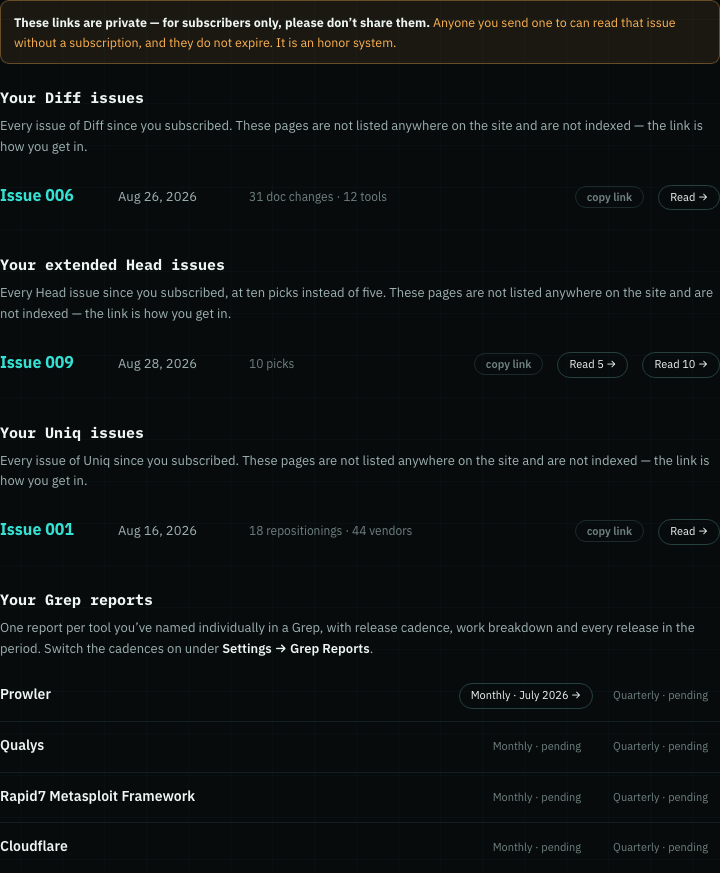
-
We now run the tools and show you what actually happened. When a release introduces a new command or flag, we build that exact version in a sealed container, run the command against a test target we own, and publish what it really printed — the full command with every option, and the tool's own colours, in a terminal panel under the entry. Until now the command shown in an entry was written from the release notes and never executed. Releases we can't run — closed-source products, hosted services, docs-only changes — render exactly as they did before.
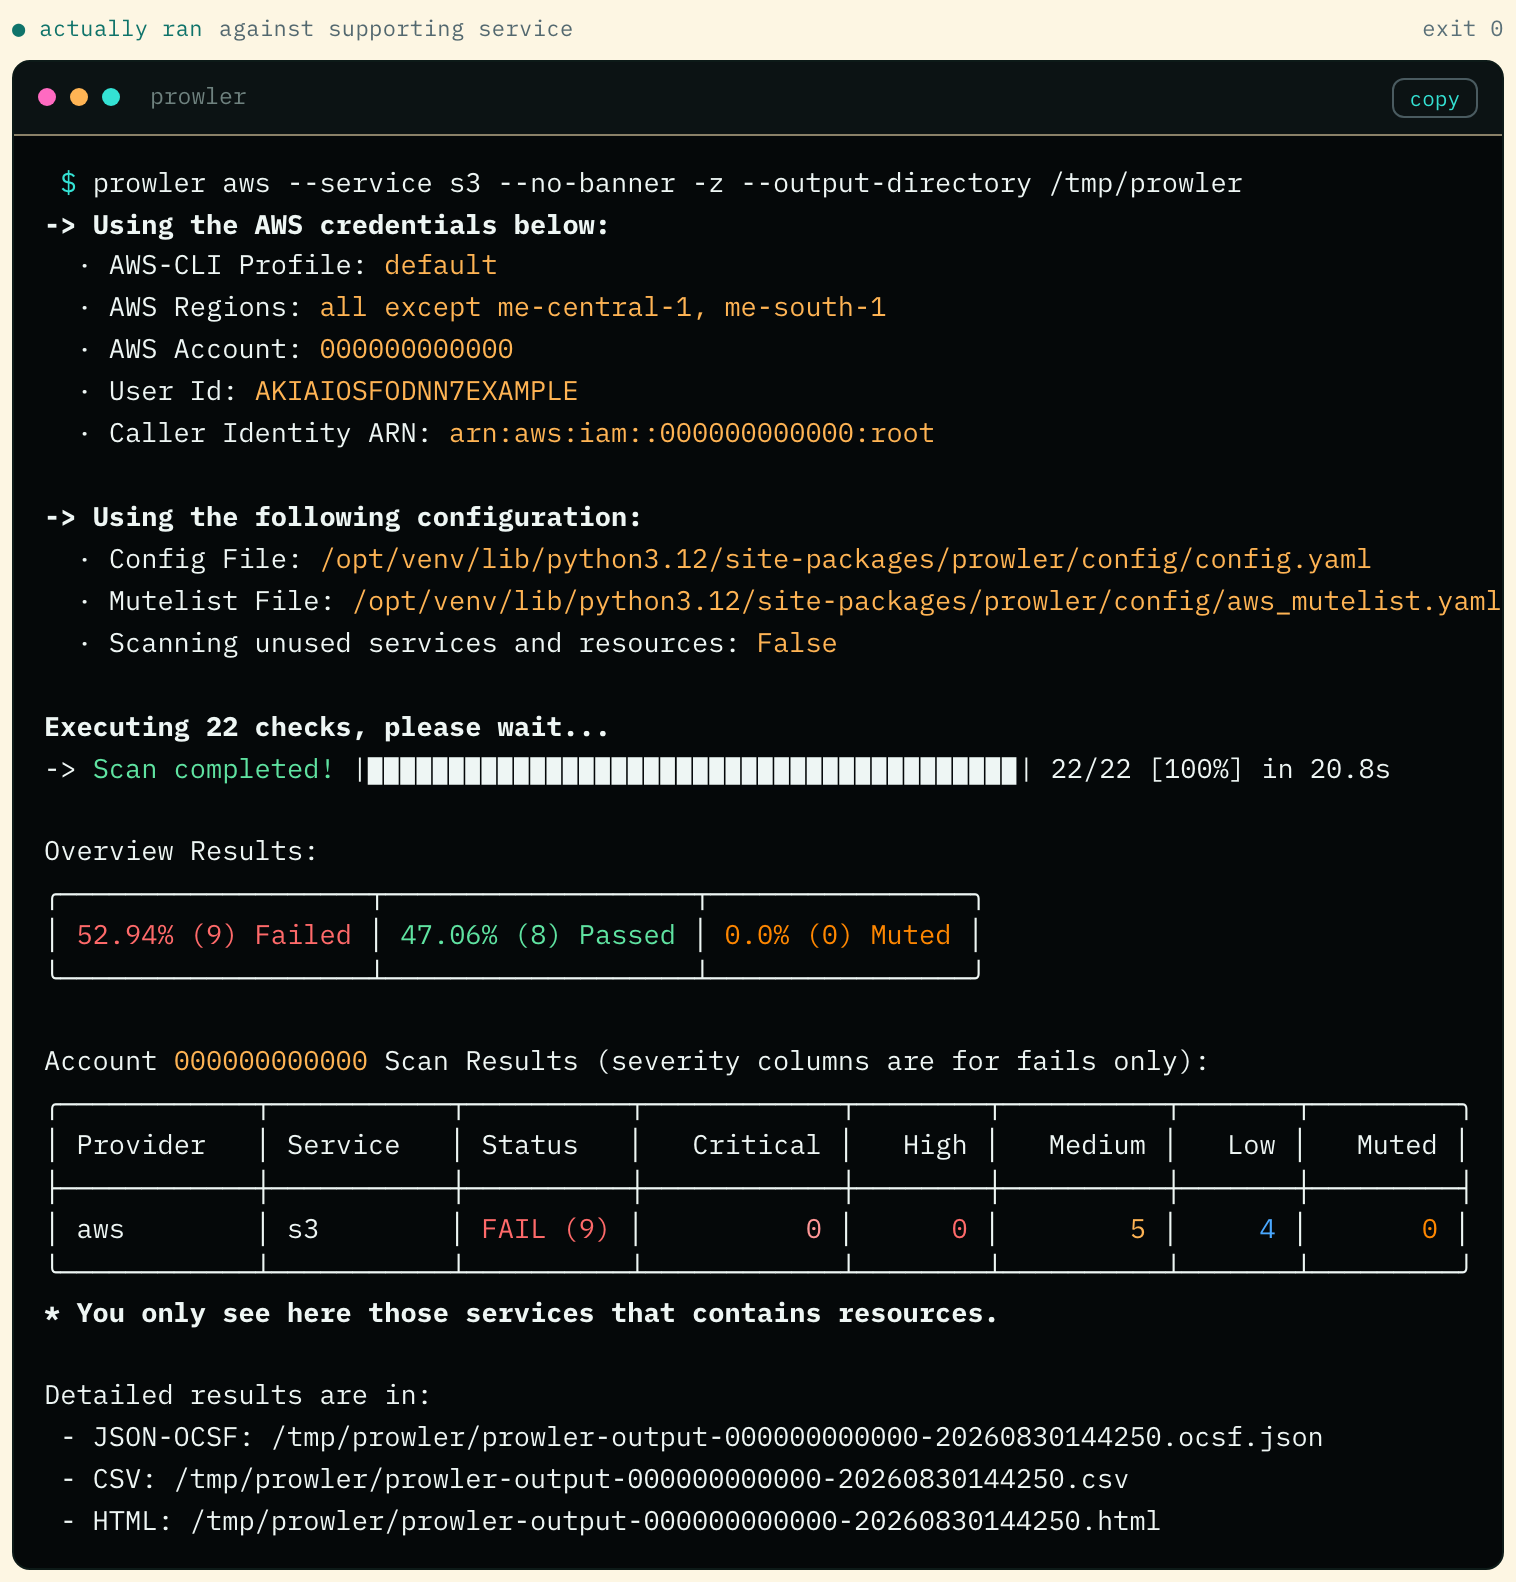
- Every subscriber issue now carries its own PDF and EPUB — including back issues that never had one — so you can read a Diff or Uniq issue on a Kindle, or offline, instead of only in the browser.
- Tool pages that showed a name and nothing else now say what the tool actually does, in the vendor's own words where they publish one — so a tool you have not heard of is no longer a blank box you have to go and look up.
*
Aug 29, 2026
-
Grep report releases now open. Click any release in a monthly or quarterly report and the full record slides in beside it: when an API changed, the endpoints it deprecated by name rather than a count; the capability the release advances and how long it has been shipping; the commands and flags that exercise it; and a real recorded run with the output it printed. No more leaving the page to find out what a one-line entry actually meant.
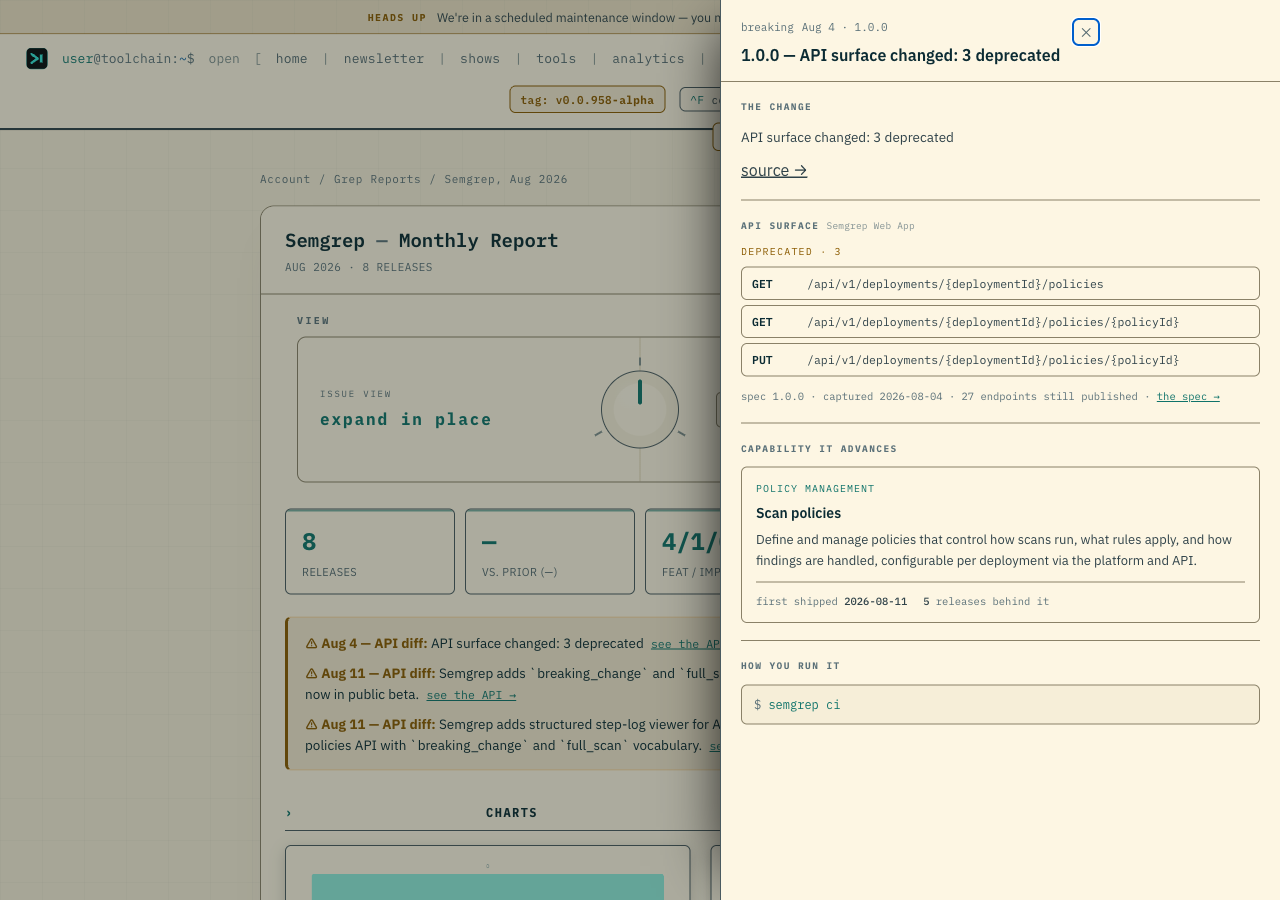
- The 404 page now links directly to our assistant if a page still feels missing.
- A site-wide notice banner can now surface important status updates (e.g. this maintenance window) at the top of every page.
- The homepage terminal now shows the week's tools even when their releases carry no version number — vendors that ship from a changelog instead of a tagged release used to be dropped from the list, leaving one lonely line under a header counting six tools. They now appear with an "updated" marker, so the preview matches the week it names.
- The Cyber Toolchain now lives at cybertoolchain.io. The old cybertoolchain.github.io address redirects here, so every link you've saved keeps working — but the domain in your address bar is now the one that actually serves the page. Previously cybertoolchain.io framed the site inside another window, which quietly broke things: staying signed in between visits, and paying with Apple Pay. Both now work.
*
Aug 28, 2026
-
Grep Monthly and Quarterly Reports, for Practitioner plans and up. Every tool you've named individually in a Grep now gets its own deep-dive report: every release from the period, cadence over time, what kind of work it was, and any breaking changes or deprecations called out up top — so you can see what a vendor actually shipped without reading a month of issues one at a time. Read it in the browser with the same reading dial Tail uses, filter the release list by clicking any period on the chart, or copy it as text. Switch either cadence on from your account.
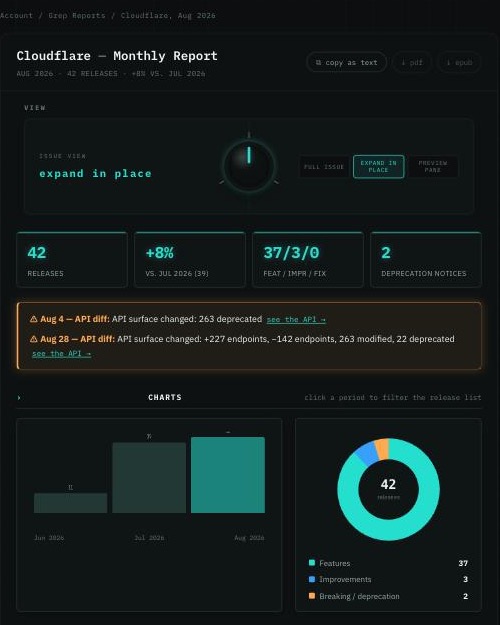
*
Aug 27, 2026
-
The homepage now previews all four newsletters — Head, Tail, Diff, and Uniq — so you can see what each one covers before subscribing.
- Sample and account-page links to early Diff issues work again — they were sending readers to a dead end.
- The account page now flags a Grep's name field directly when it's missing, instead of a note you could scroll past.
*
Aug 25, 2026
-
Tail’s reading views now live on one dial: start with the full issue, turn to expand entries in place, or move to a split preview pane — so you read each day at whatever depth you want, without leaving the page.
-
Every Tail view now asks whether you prefer it, so you can rate each reading mode independently. Preview Pane follows category, license, and tool-name filters.

*
Aug 24, 2026
- Tail and Grep now show only what shipped that day — API and MCP interface changes stay with Diff, which is where that detail has always belonged.
- Your Grep watchlist no longer flags a tool as retired just because it's covered by our sibling newsletter instead.
*
Aug 23, 2026
-
Tail now says what it is: the daily firehose, everything the toolchain shipped today, already filtered.
- Tail's email leads with the releases we documented best — the ones with a command you can run — instead of whatever the fetchers returned first, and reads in three depths: three to read, ten to skim, the rest at a glance.
- Share a link to any page and it now arrives with a proper preview card — the site's name, what the page is, and our mark — instead of a cropped icon.
- Search engines can now find every issue, tool page and article on the site, rather than only what they happen to follow a link to.
- Every newsletter issue now has a real heading structure, so a screen reader can move tool to tool instead of scrolling through one flat page.
- A dead or mistyped link now lands on a page that points you at the newsletter, the tools list and the articles, instead of a blank error.
- Every code-analysis figure is now backed by a content-addressed store keyed by a digest of the data itself, so any number on the site can be re-derived against the exact bytes it came from.
*
Aug 22, 2026
-
One plan can now cover both sites for the year. Practitioner across The Cyber Toolchain and The AI Toolchain is $150/year, Researcher $300/year — the same two months free the single-site annual plans get. Choose it on your account page before checkout.
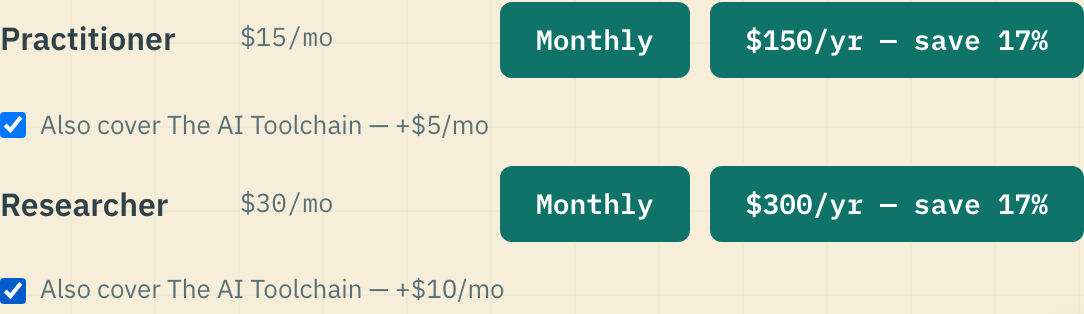
-
Our logo and a ready-made LinkedIn cover are now in the brand kit. The mark comes with no circle or box around it, so it drops cleanly onto any profile, light or dark.
- The wordmark now reads cyber|toolchain — a pipe rather than a slash — on the page and in every file you can download.
- The velocity chart's commercial-vendor tally is accurate now: AI tools that belong on our sibling site no longer count toward it, and a vendor's changelog pages roll up under that vendor instead of each becoming its own entry. 349 vendors across 477 doc pages.
- When a tool ships one release, you now read about it once. Vendors that publish a release note, a docs update and an API change on the same day used to appear four or five times in a single issue, each entry repeating the last.
- Full documentation diffs no longer open with GitHub page furniture. A diff that used to start with a star count or a “reload this page” error now starts with the change itself.
- A documentation page that only restamped its date, or only reshuffled a list of links, no longer becomes an entry claiming the vendor changed something.
- Releases that add a flag or an endpoint now come with a command you can actually run. Whole categories were silently going without — post-exploitation tools like impacket named their new flags in the write-up and never showed you one being used.
- Sixty more security vendors are on the watchlist: every RSAC Innovation Sandbox finalist from 2005 to 2026 that still ships — Yubico, Claroty, Cato Networks, BigID, Menlo Security, HiddenLayer, Salt Security and this year's cohort among them. Each has its own page at /tools.
- We can now follow vendors whose announcement pages only appear once JavaScript runs — a class of newer companies we previously could not read at all, including Arkose Labs, Bedrock Security and Pindrop.
*
Aug 21, 2026
-
Release notes that mention a file or a flag now read as a sentence instead of breaking apart mid-line on a phone.
- Tool pages no longer show an “examples” link for tools that have no captured runs — the link went nowhere.
-
The Cyber Toolchain's mark is now the chevron from our brand kit, in the site's teal — the same shape The AI Toolchain wears in violet. The two sites now read as one family in your browser tabs.

- Sign in on one toolchain and you are signed in on the other. Switching between The Cyber Toolchain and The AI Toolchain no longer asks for a second email — your account already covers both.
- Signing out now ends your session on both sites at once, not just the one you are looking at.
-
Every tool page now opens by answering whether the tool is worth your time: what it is, whether it costs money, how you run it, who it's for, and where it sits. Below that are the questions you'd ask before evaluating it, each with an answer.
- Tool pages now say whether a project is still alive — when it was first committed, how many people work on it, and whether anything has shipped in the past year. That last one is the fact nobody volunteers.
- Where a cyber tool's own documentation names a comparable product, the page says so and says where it read it. Where it names none, the page describes the category instead of guessing.
- A handful of tools publish nothing we track. Their pages now say so, so you can tell a description drawn from the vendor's own words from one written without them.
-
You can now remove a Grep from your account page without opening it first — hover a Grep and an × appears in its corner. It asks before anything is lost, names the Grep, and offers to pause it instead, since a paused Grep keeps its list and stops sending.
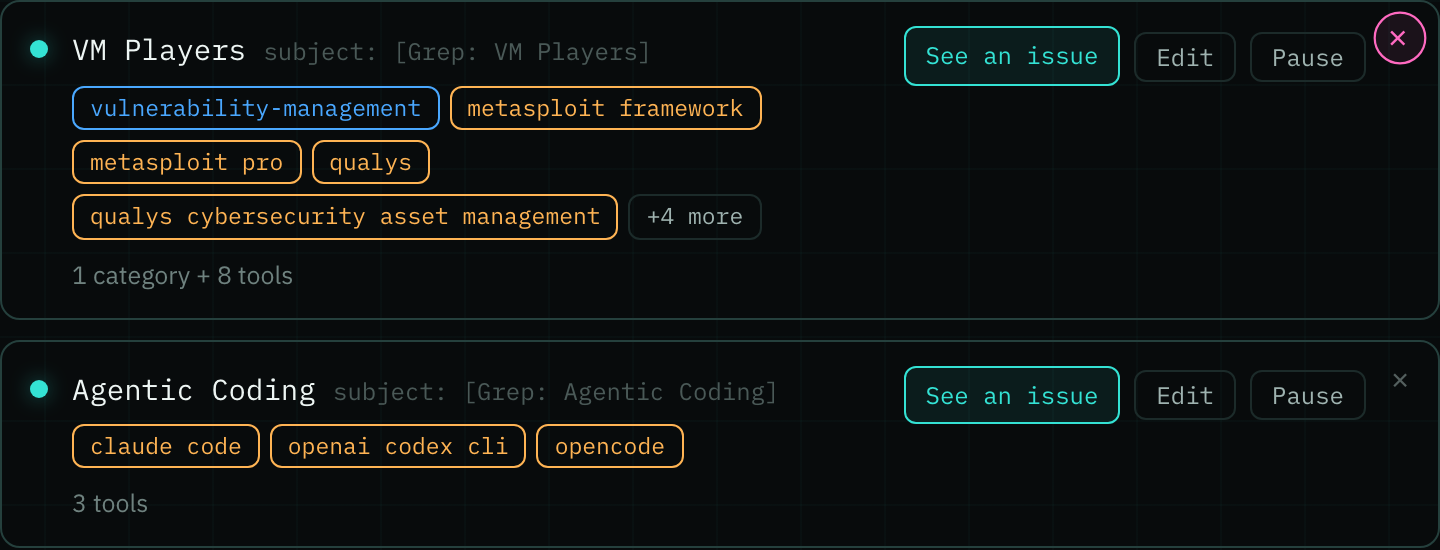
-
Adding the cross-site bundle now confirms what you actually bought. The receipt names the other site, says your plan covers both, and sends you there to pick the tools your daily should cover — instead of repeating the plan you already had.
- Reconstructed issues now say why they exist: the newsletter did not exist that month, so nobody received them, and here is the date the first real issue went out. What they were built from — the release notes each project published at the time — comes after the reason, not instead of it.
- If you cancel a subscription, your account page now says so, and names the date your access ends — instead of telling you the plan renews.
- Screenshots that a vendor's page loads lazily now show the actual picture instead of an empty grey box — across the whole archive, not just new issues.
- In the newsletter email, older releases under a tool now show a clean version tag and a proper status pill.
- A tool shows one “latest” marker again, on the release that actually is the latest.
- Tool descriptions now say what the product does, not what its changelog feed is.
*
Aug 20, 2026
-
The Cyber Toolchain's newsletter archive now reaches back before launch — reconstructed issues covering the months before the newsletter started, built from the same release notes each project published at the time, and clearly marked as reconstructed rather than sent.
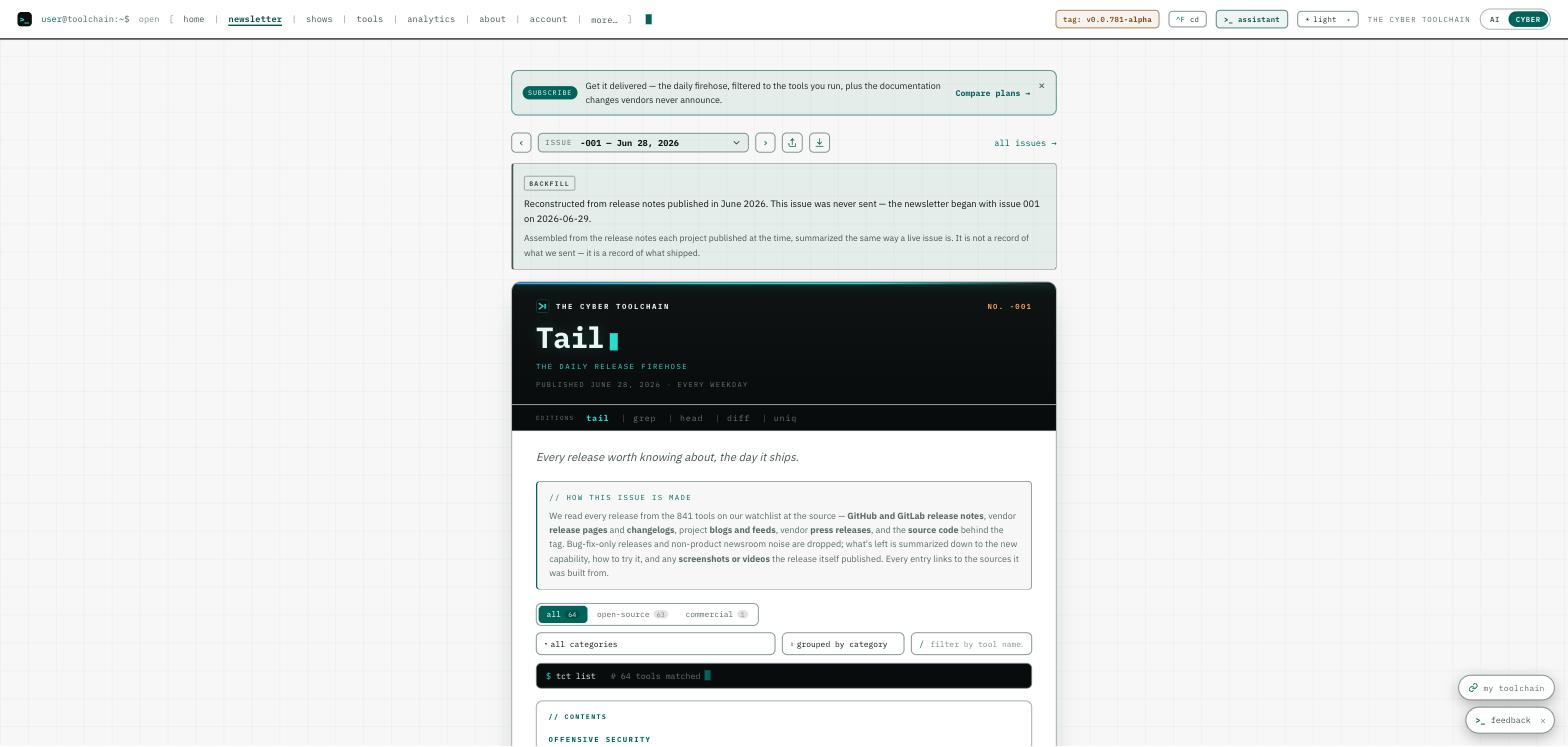
- Tool pages now show release history, commands, and code analysis together on one page instead of split across separate tabs.
- The samples page has a jump-to-section nav, so you can go straight to the sample you want instead of scrolling past the others.
-
The brand-kit's downloadable avatar mark now says which Toolchain it's from — "CYBER TOOLCHAIN" or "AI TOOLCHAIN" — instead of just "TOOLCHAIN", so it's still identifiable once downloaded on its own (a GitHub org avatar, a Slack icon).
- Cloud and Kubernetes tool pages now show real, sandbox-captured commands — cosign, Prowler, Cloud Custodian and Helm went from empty to working examples, with fresh command examples added across a dozen more cyber tools.
- Practitioner and Researcher subscribers can now add access to the sibling site — The AI Toolchain from here, The Cyber Toolchain from there — for $5–$10 more a month.
- The brand kit's wordmark now reads "cyber | toolchain" (and "ai | toolchain") instead of a slash, and the mark-concepts grid dropped two directions that didn't hold up.
*
Aug 19, 2026
-
Subscriber PDF and EPUB downloads now offer 4 color palettes — dark, light, sepia, high contrast — pick the one that matches how you read, not just the accent color.
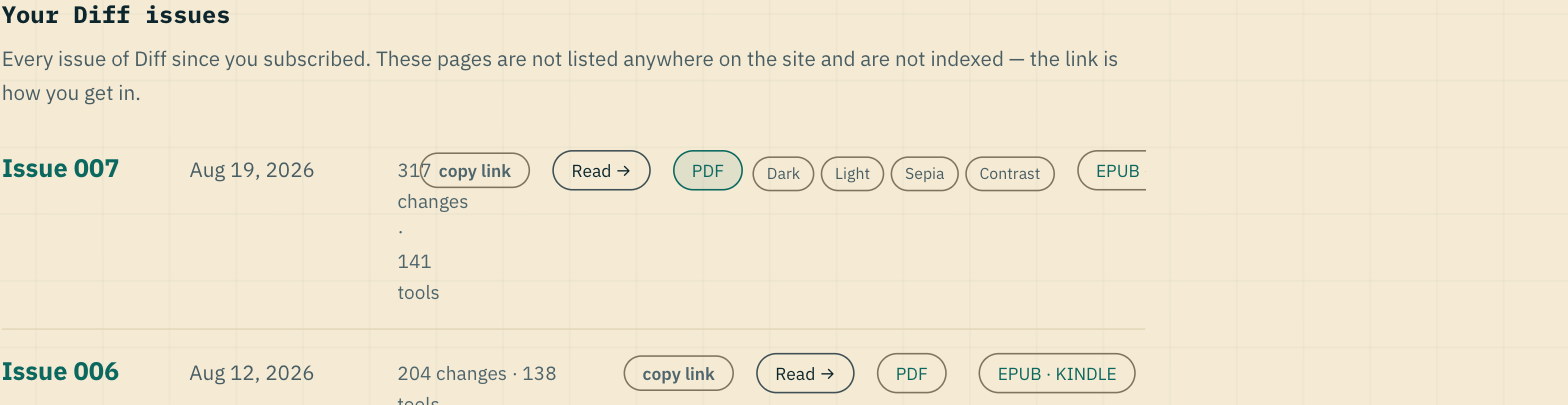
*
Aug 18, 2026
-
The AI | Cyber switcher in the top nav is now a segmented toggle — the site you are on is a solid filled pill, with a one-time arrow pointing at it, so it reads as a switch you can click rather than two words of chrome.
- Added PDF and EPUB downloads for public Head issues and entitled subscriber issues, including Send to Kindle support.
- The tools list now covers cyber tooling only — AI-native tools (coding agents, agent frameworks, local-model runtimes) moved to our sibling site, The AI Toolchain.
- Fixed the changelog and field notes pages, which had been silently rendering empty.
*
Aug 17, 2026
- A Grep issue now gives each tool one entry instead of one per release. A tool that cut a release and moved two doc pages is a single card headed by the version, and the card names what else moved that day — “4.1.5 · docs ×2” — so a docs-only day still reads differently from a second release. The subject counts tools rather than releases, and the Grep preview on your account page now shows exactly the cards the mail sends.
*
Aug 16, 2026
- When a week is thin, the newsletter now says so and why: “Only 8 of the 130 tools that shipped a feature release this week cleared our bar for depth and differentiation — so this issue runs 8 picks, not 10.” Previously only the website explained a short issue; the email said nothing.
- The Head email now shows which edition you’re reading. The subject names it (“top 10 picks”) and the terminal card runs the command that produced it — both used to be fixed at five, so the deeper edition arrived looking exactly like the free one.
- Every Head issue on your account page can now be opened at either size — five picks or the full list — whenever the two actually differ.
-
A fifth newsletter joins the set: Uniq, which tracks how vendors reposition themselves — the category they claim, the buyer they name, and the prices on their page. It is not sending yet; the editions strip on every issue now lists all five.
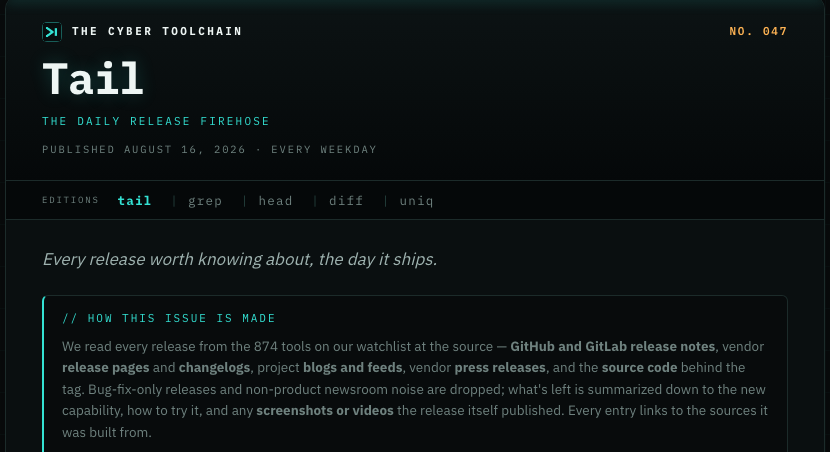
- Chainguard and 31 of its competitors are now on the watchlist — hardened container images and the software supply chain field around them, from Mend, JFrog and Sonatype to Minimus, Echo, RapidFort and Iron Bank. That takes the tools page from 841 to 874.
- Signing in now reaches the tabs you already have open, instead of only the new one the link opened. A test send now delivers your Head edition rather than a generic sample.
- Release notes we read off a vendor's documentation page now link to the exact release they describe, instead of whichever page that release's first sentence happened to link to.
-
A Login button now sits beside Subscribe on the front page, so if you already subscribe you reach your account in one click instead of hunting for the link in the footer.
- Signed out, your account page now tells you to sign in — and what signing in lets you change — instead of describing settings you cannot see yet.
- The small "+3" beside a version in This Week's Highlights now explains itself when you hover it: how many releases that tool shipped this week, and which versions they were.
- Ask for a sign-in link and we now say the link opens your account in a new tab, so you know the page you are on can be closed.
-
Generate an API key and it now arrives with a ready-to-run command — copy it, paste it into a terminal, and confirm your key works before you write a line of code.
- Your account page now names the API's base URL, with its own copy button, so there is no hunting for the host.
- Every example on the API reference page now points at a working address.
- Your account page is now two tabs: Settings, and Subscriber issues. Every private Diff and extended-Head issue you can read sits in the second one, at the top of the page instead of the bottom of a long form — and the tab carries a count, so you can tell at a glance whether there is something waiting.
- A sign-in that expires while you are on the account page now offers a button to email you a fresh link, instead of leaving you on a page whose controls have quietly stopped working.
*
Aug 15, 2026
-
Head now shows everything a tool shipped that week in one ranked list. When a project cut several releases, they read as a single set of features instead of the newest one plus a collapsed "more releases" link.
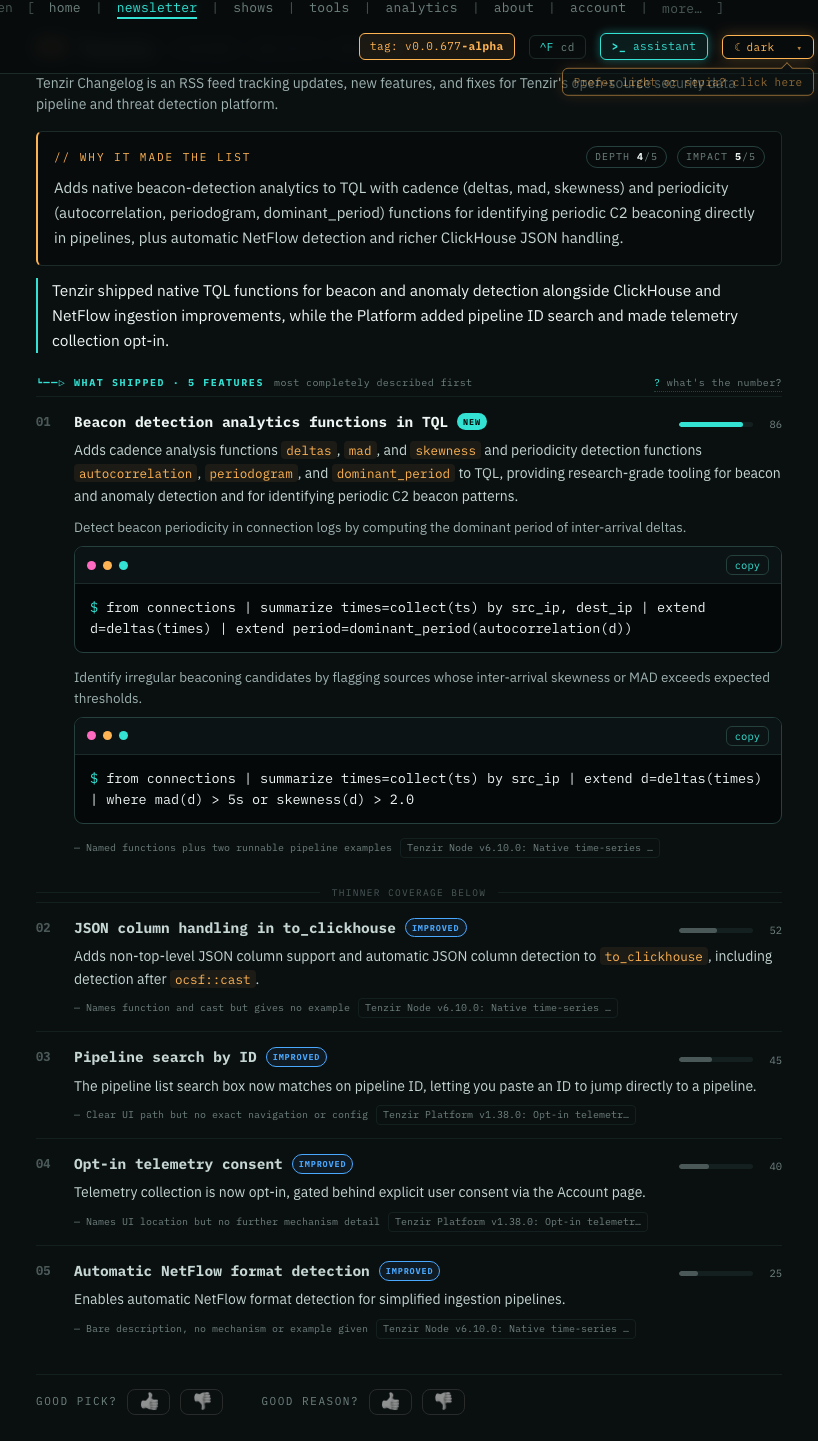
-
Command examples that failed when we ran them are no longer shown on tool pages. A tool whose every captured run failed now says so, instead of showing you broken output.

- Release notes published on vendor blogs and changelog pages no longer lose their features when several releases are merged — a whole tool's list could come back empty.
- Practitioner and above can read Head at ten picks instead of five: the same week, judged to the same bar, five more tools deep. Choose it on your account page; back issues are listed there too.
- Every link in the newsletter email now opens the issue you were reading. Head and Diff emails sent readers to the latest daily issue instead of the one in their inbox.
- This Week's Highlights says how many picks are in the issue, not how many releases those picks came from.
- Status labels like PRE-RELEASE keep their shape in the email on a phone.
*
Aug 14, 2026
-
Researcher and Business subscribers can now pull toolchain data directly into their own scripts — releases, tool SBOMs, CLI examples, analytics — through a new API, documented in full at /api with live request and response examples for every endpoint.
-
This Week's Highlights now scores each pick on how much it changes what you can actually do, not just how novel the underlying idea sounds — look for the DEPTH and IMPACT scores under each pick's case for why it made the list.

- Generate and manage your API keys from your account page — give each one a name and an optional description, and revoke any single key without touching the others.
- Tool pages now always show a tool's current category — a past recategorization no longer gets stuck showing what an old newsletter issue said.
*
Aug 13, 2026
-
Technical terms in an issue now explain themselves — hover or tap something like AF_XDP or AWS ENA and you get a sentence on what it is and why a tool would build on it.
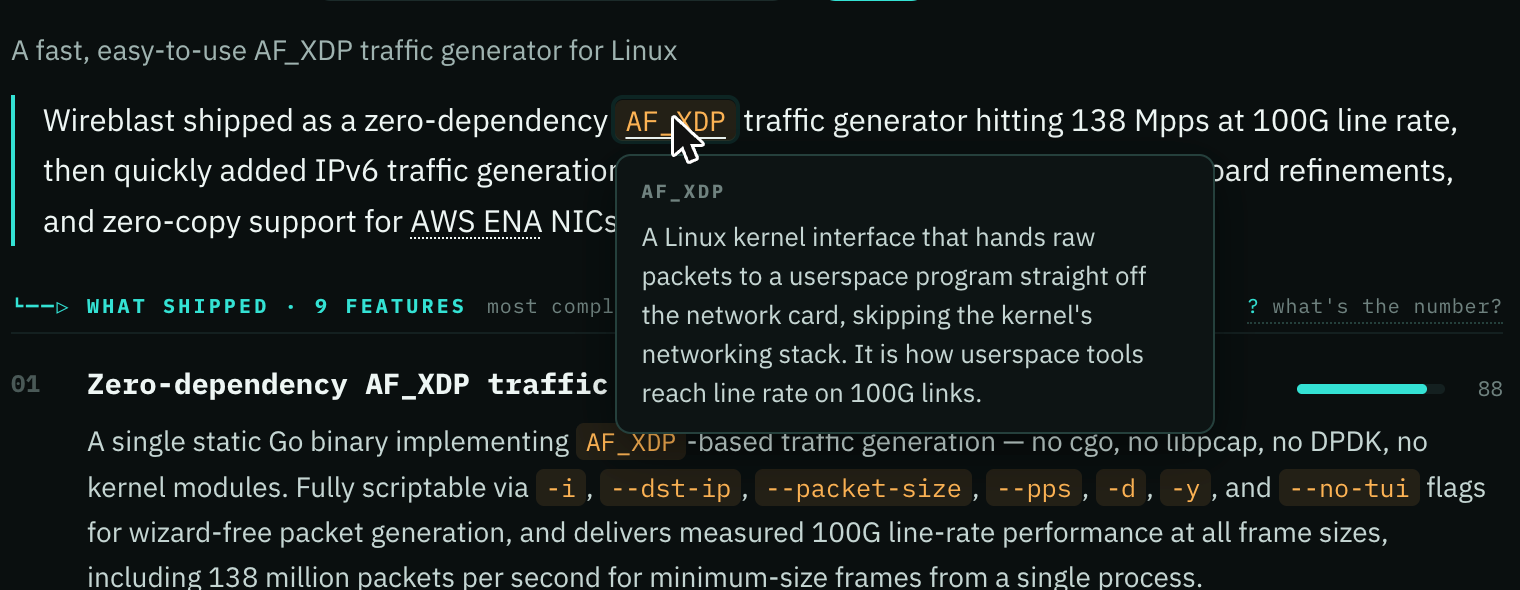
-
You can now download any Tail, Head, or free Diff issue as a PDF — click the download icon next to the issue picker.

- Screenshots and videos in every issue now load faster — they are served from a content network at about a third of their previous size, with no change to how they look.
*
Aug 12, 2026
-
Diff now gathers a whole week of documentation changes for each tool into one entry — a summary of what moved, with every change listed underneath. Docker Sandboxes went from one line plus nine hidden releases to a single entry covering all 18 changes.
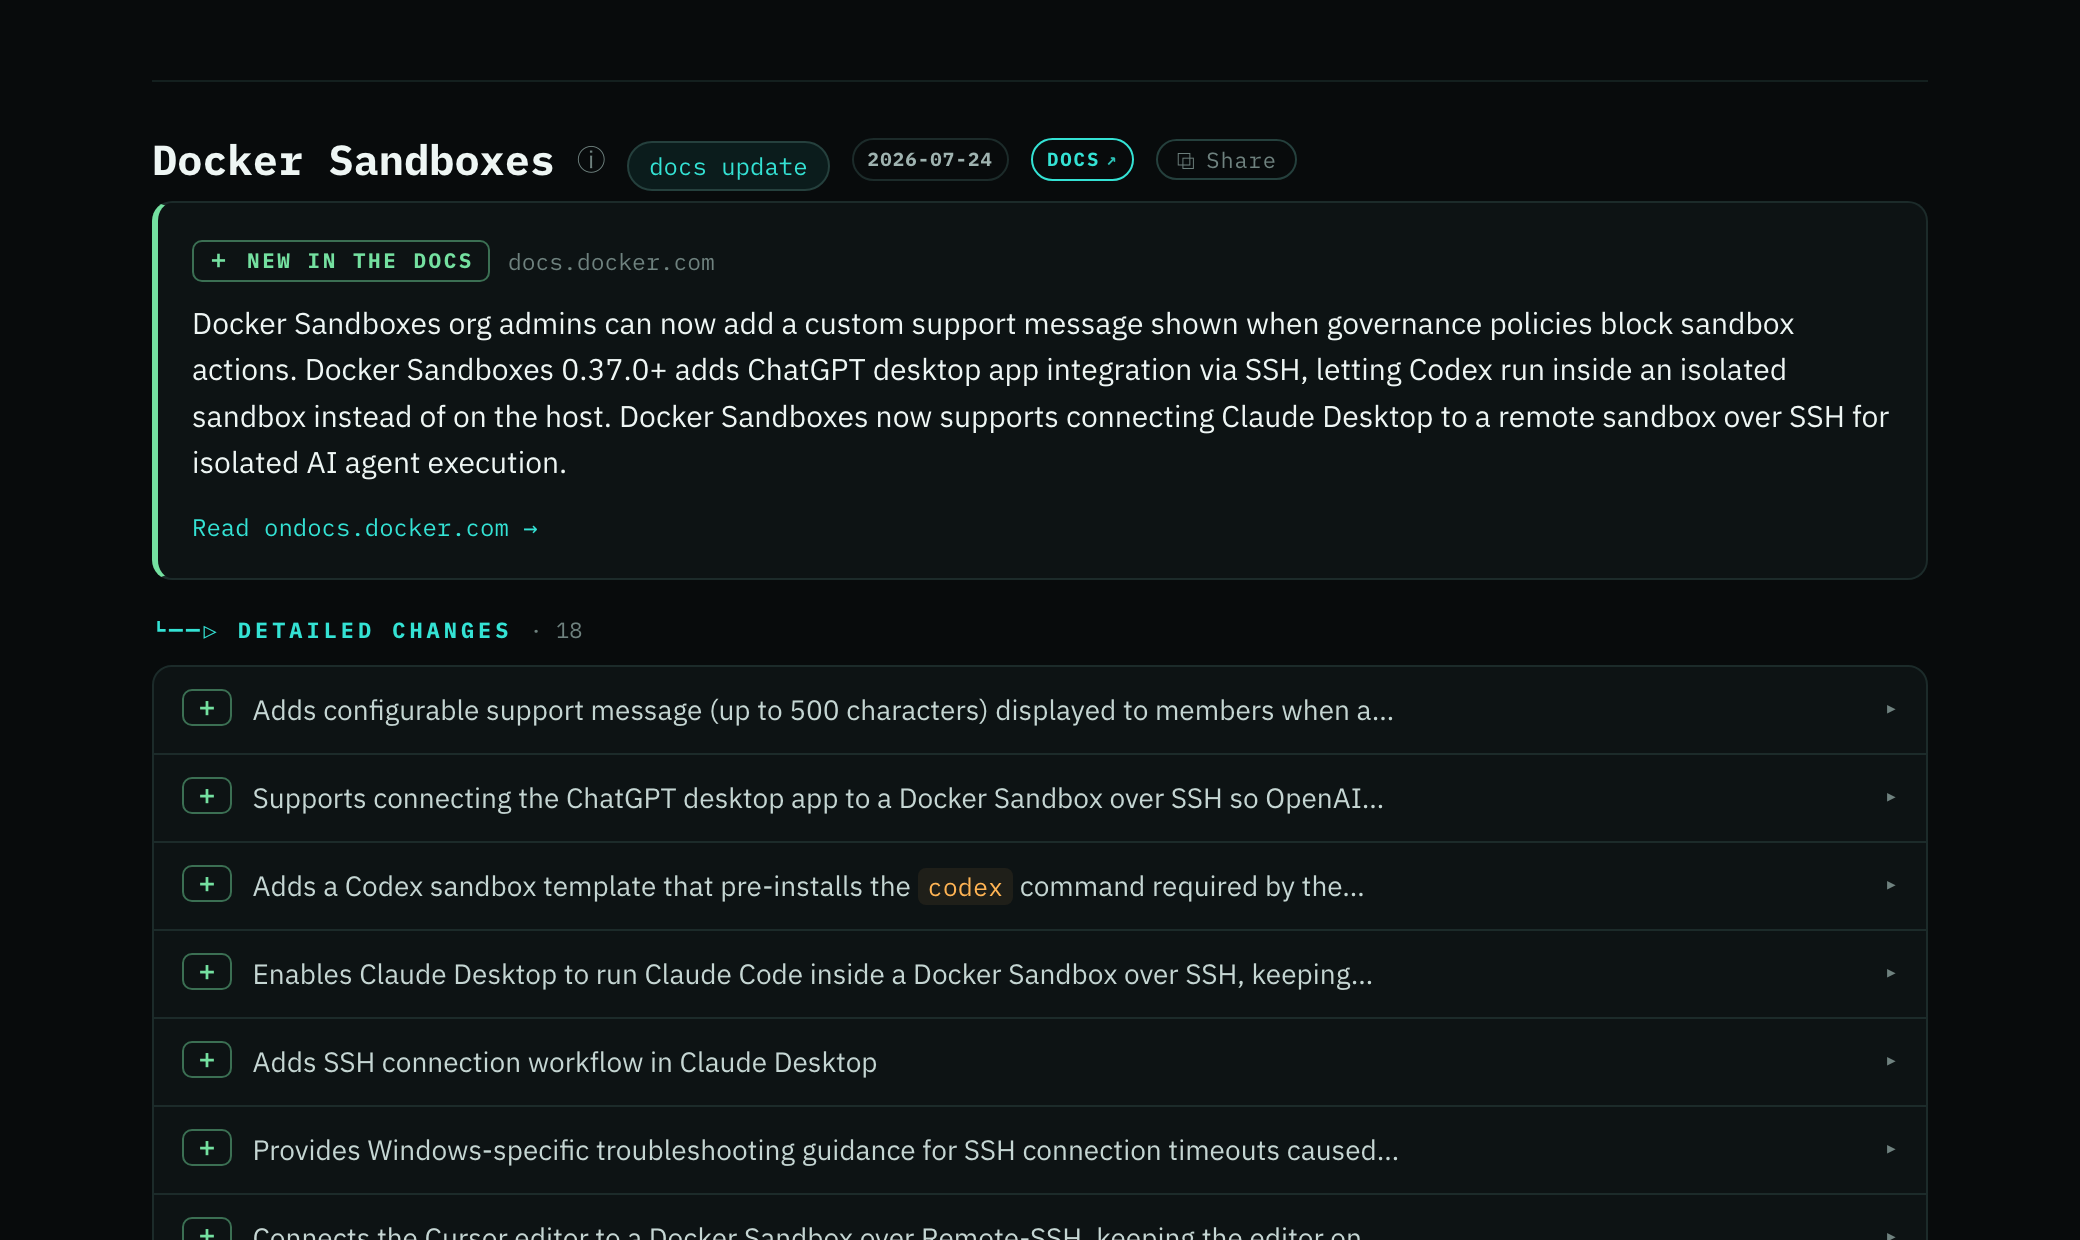
-
Your Diff issues are now listed on your account page, each with its own private link, so an issue is never lost with the email.
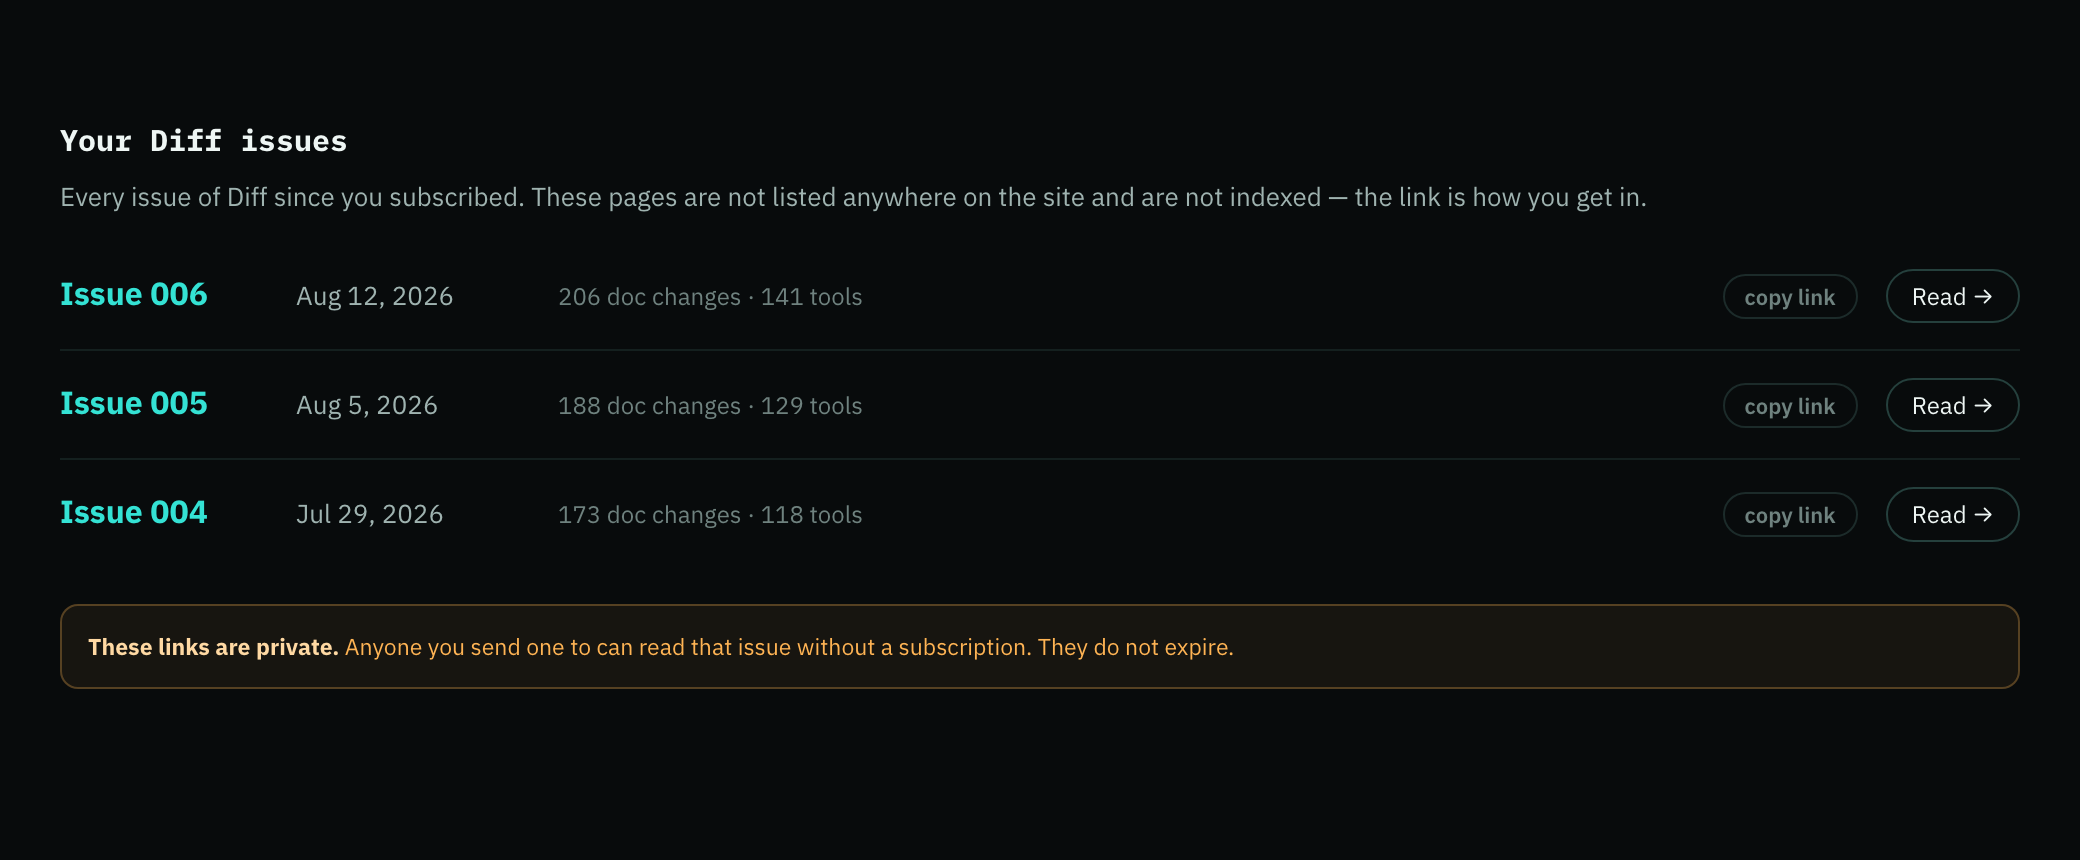
- Newsletter issues have clearer addresses — /newsletter/tail/43, /newsletter/head/3, /newsletter/diff/4. Every existing link still works, including links to a specific tool inside an issue.
- Researcher and Business now get the changed text itself in Diff and in API changes: what a page said before, what it says now, and which parameters, response fields and allowed values moved.
-
Every issue now says which edition it is, what it covers and how often it arrives — and links to the other three.
- Pictures in an issue now show the product. Logos, wordmarks, seals and merch photos no longer render mid-entry, and the whole archive has been cleaned the same way.
- Product Docs Weekly no longer arrives with headings over blank space — documentation entries carry the description of what actually changed.
- Screen labels you look for in a product now read differently from commands you type.
- A config snippet is titled with the file it goes in, so you know where to put it.
- Upgrading your plan from your account page now moves the subscription you have instead of starting a second one alongside it.
-
A tool with nothing to show yet says so: the “full history & commands” button greys out and explains it opens once there's data, instead of sending you to an empty page.
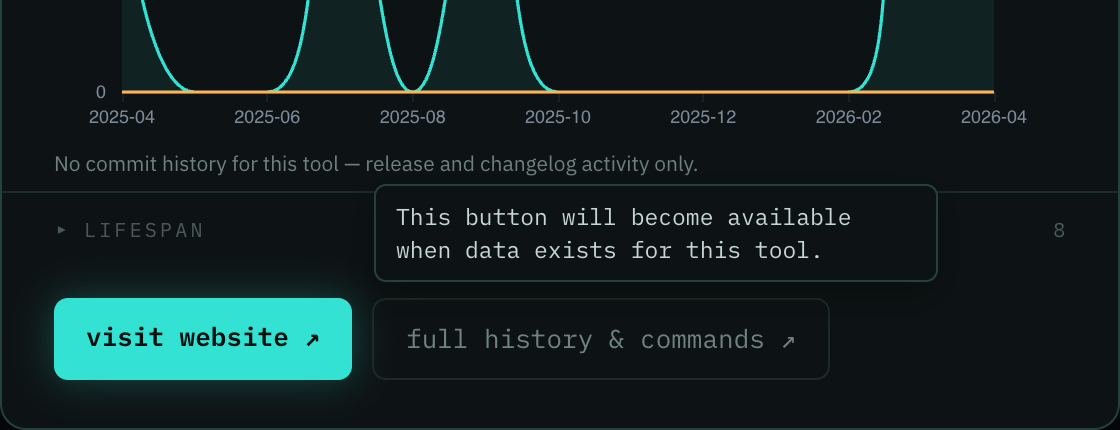
-
The archive calls each newsletter by its name — Tail, Head and Diff — and filters to the one you want.
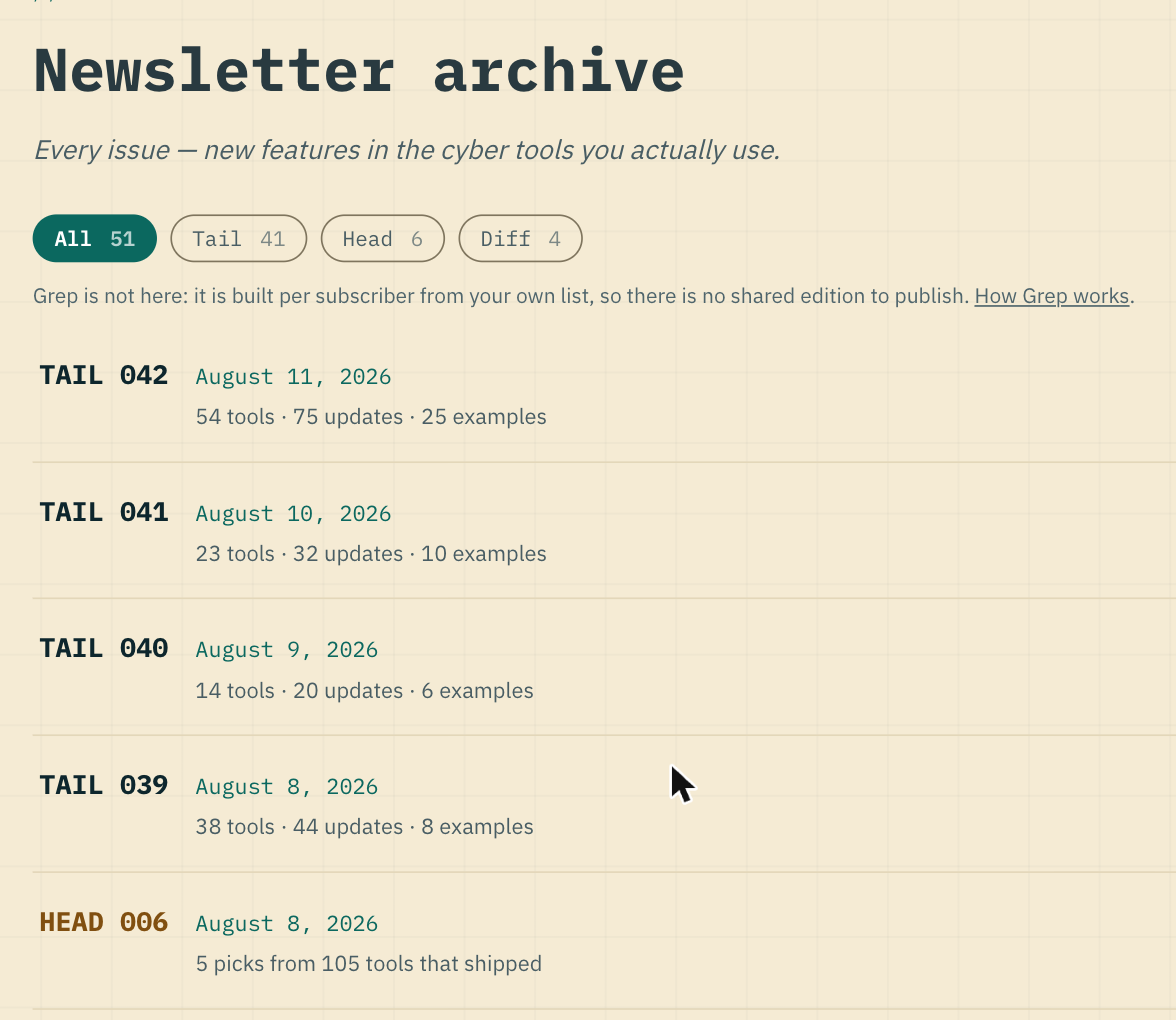
- Choose how long you stay signed in: 15 minutes, a day, or a month. Billing always asks for a fresh link, whichever you pick.
- Send yourself as many test issues as you like — the daily cap is gone.
- Issues render properly on a phone again: round window dots, pill-shaped version badges, and code names no longer wrapped in stray backticks.
- Two videos in one release now say which is which, instead of two identical “Watch video” buttons.
- Links out of a tool's details open in their own tab, so you keep your place in the tools table.
- Prescient Security's Cait joins the watchlist.
*
Aug 11, 2026
-
Run several Greps at once — each with its own name, its own list of tools, and its own email.
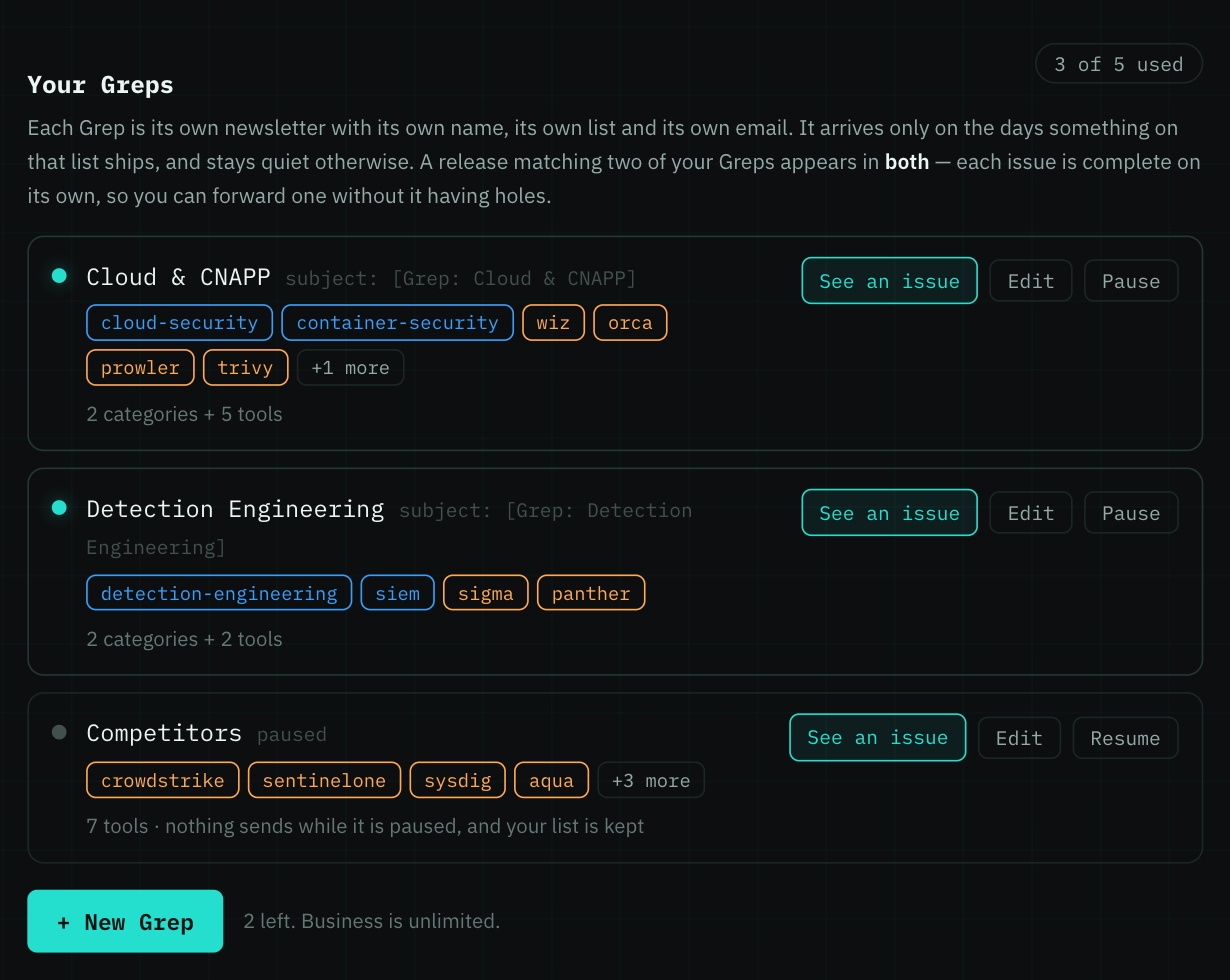
-
Your weekly newsletters say what they are, and “Taking a break” reads in one line instead of two.
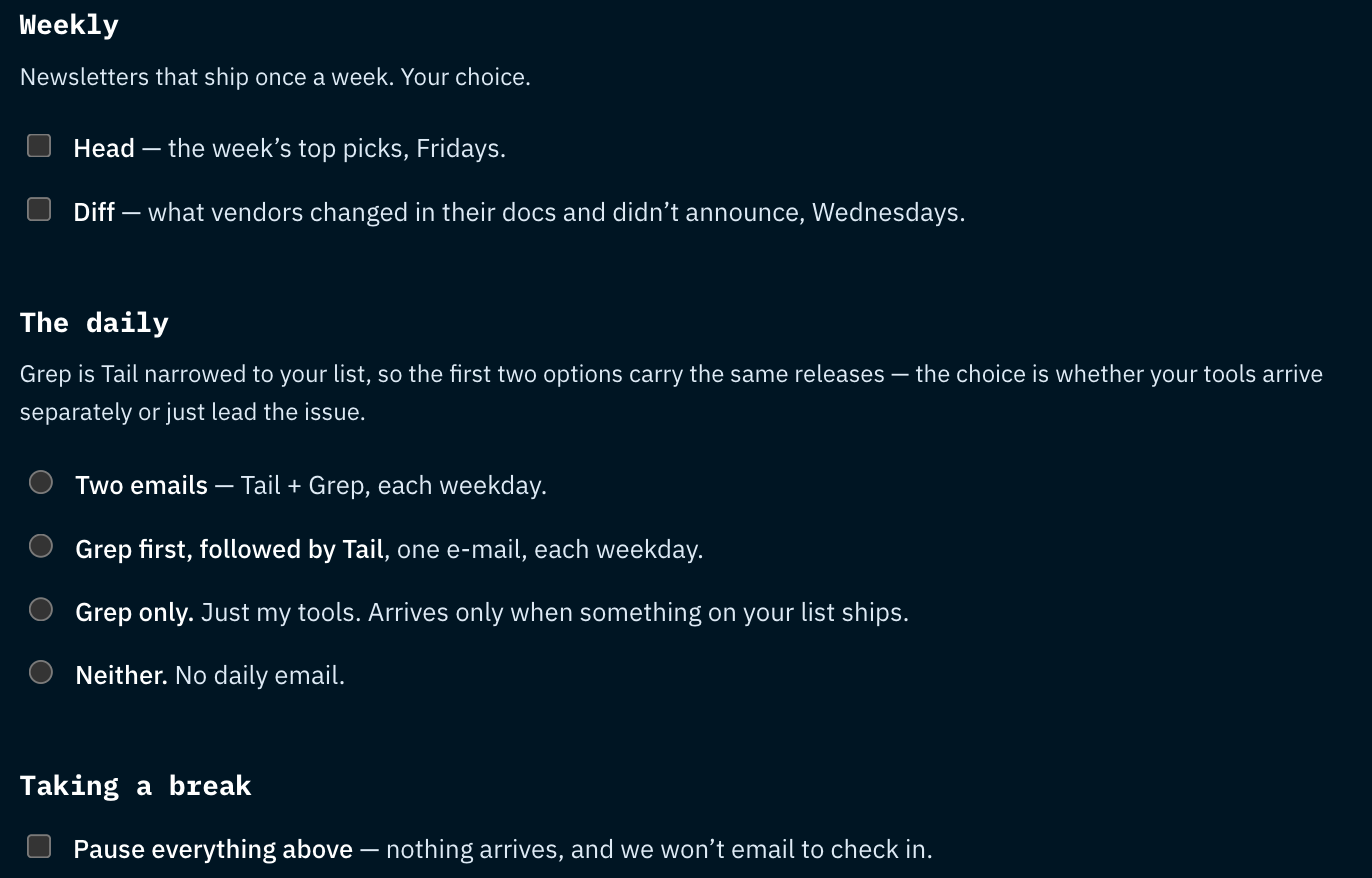
- “Manage billing” opens your billing settings in a new tab, so your account page stays where you left it.
- When billing asks you to confirm it’s you, it now says why: billing can cancel your plan and change your card, so a 30-day sign-in isn’t enough on its own.
- If your sign-in has expired, billing tells you that and points you at a fresh link — instead of asking you to try again, which would never have worked.
-
Pick an email edition on your account and the whole site repaints in it immediately — the swatch is a thumbnail, the page itself is now the preview.
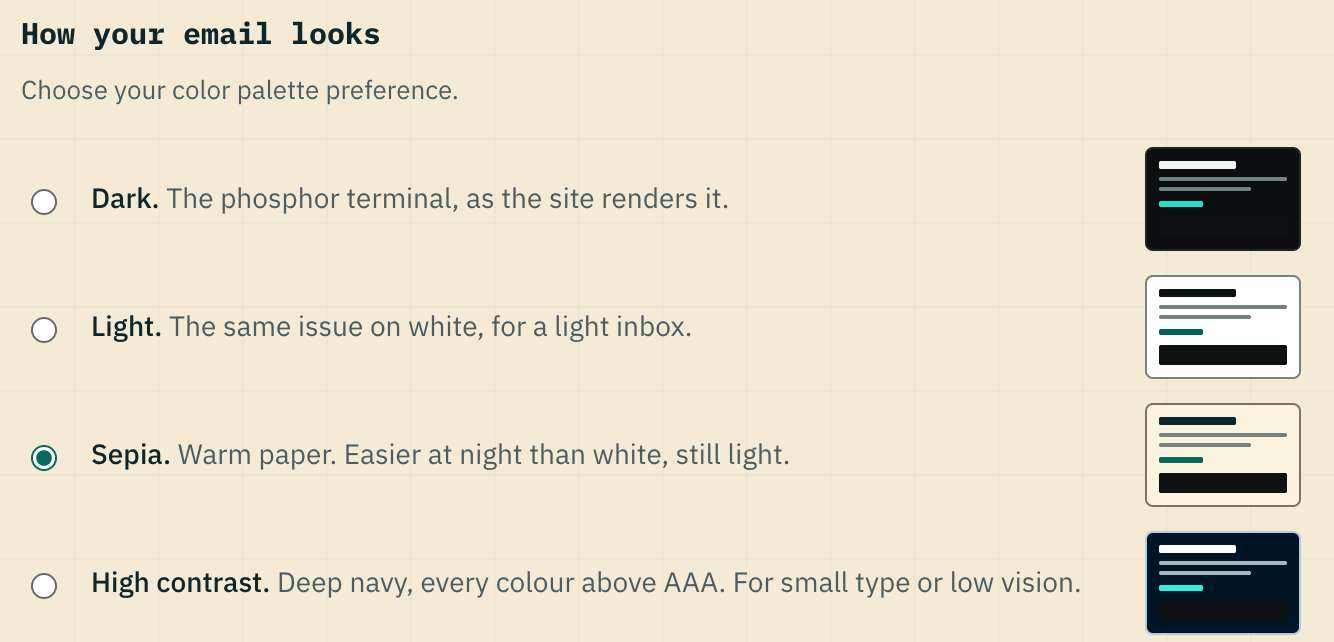
- The edition you've saved sets how the site looks when you sign in. Any theme you had ever picked in the tab bar used to block that permanently.
- Your account now says what order Grep arrives in: grouped by category, then by tool, the same as every issue — naming a tool by hand does not push it to the top.
- On About: what a paid plan adds now includes the data signals and analytics published nowhere else.
- Our vision, restated: every organization having the information it needs to adopt the cyber defenses that protect it.
- A new subscription starts delivering straight away — the first issue after you subscribe now reaches your inbox.
- Your watchlist no longer reports live tools as retired. Vendors that ship many products under one platform — Rapid7's Command Platform among them — were being read as a single name, so tools you had picked looked like they had gone away.
- The terminal blocks in your email are readable in every edition. Sepia and high contrast were putting dark grey text on a near-black card.
- Your account page shows the email edition you actually chose. Sepia and high contrast were both displaying as dark.
- “I’m taking a break” now stops every newsletter, including on a paid plan.
- Three more tools on the watchlist: Artemis Security, NVIDIA Object-Oriented Agents and VulnCheck Target Intelligence.
- Take the daily narrowed to the categories you work in, instead of the whole watchlist.
- See any Grep as a real issue before it arrives, built from your own settings — including which days it would have sent, and which are quiet.
- Send yourself a test issue on any plan, free included, in whichever colour palette you picked.
- Newsletters now arrive from issues@news.cybertoolchain.io — one address for all of them, your Greps included.
*
Aug 10, 2026
-
On the revenue chart under “What public vendors actually earn”, pick the companies you want to compare — one click each, starting with the three largest, up to eight lines at once.
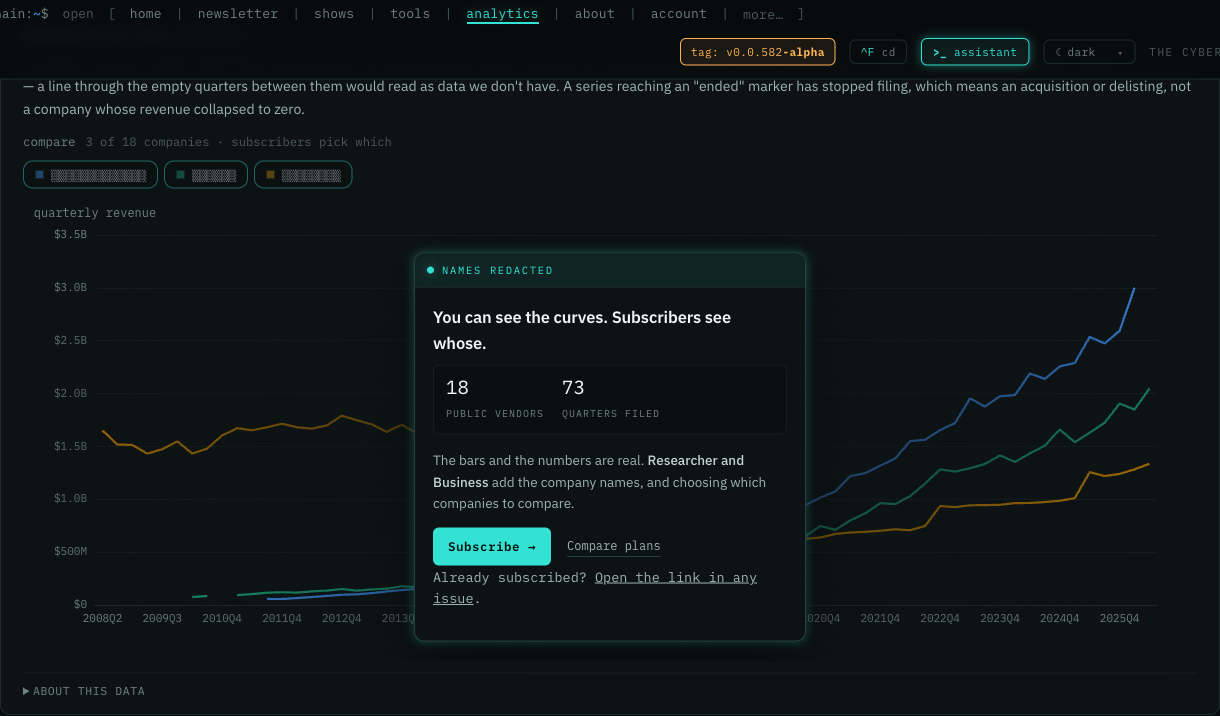
- See what new risks the public cybersecurity vendors started disclosing each year, drawn from every annual report they have filed since 2006.
- Every chart of public-vendor financials now says plainly what a subscription adds, with the counts behind it — 17 vendors on the Rule of 40, 18 vendors and 73 quarters of filed revenue.
*
Aug 9, 2026
-
Your account page now runs your whole subscription in one place: sign in and out without leaving it, choose which newsletters you get, pick the tools and whole categories your daily covers, and see what a plan would add before you buy — including which of those controls it unlocks.
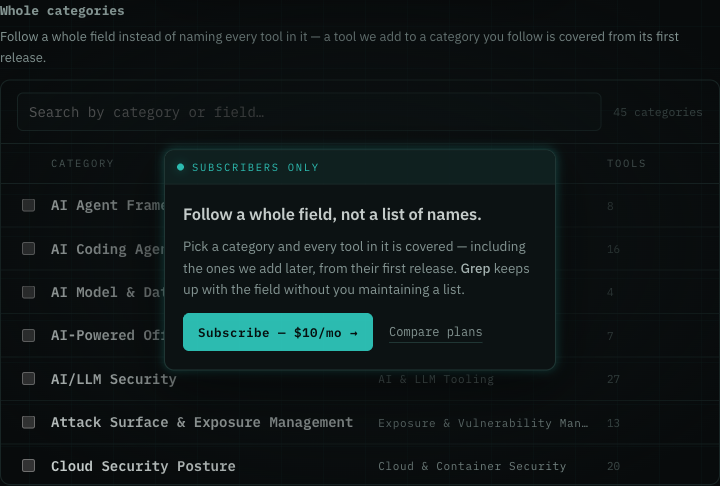
- Four looks for your email: dark, light, sepia and high contrast, each with a preview of the real thing.
- ⌘K finds your account under login, sign in, billing or unsubscribe — not just “account”.
-
You can subscribe to a paid plan now. Pick Practitioner or Researcher on the home page or the plans page and you go straight to checkout — no account first, no waitlist. Paddle handles the card as our merchant of record, and shows your country's price and tax before you commit.
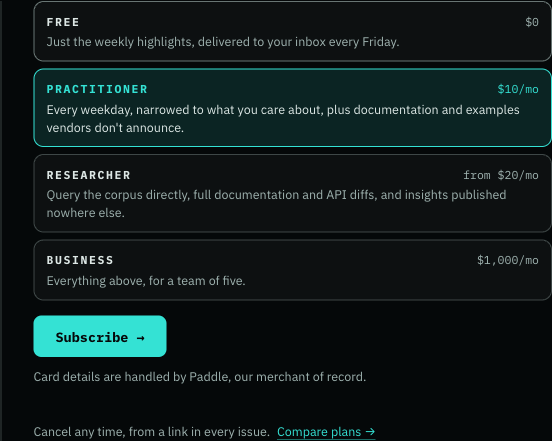
- Cancel any time from a link in every issue.
-
See what a subscription actually gets you. The samples page now shows a full-depth entry from a real issue — every capability it named, the breaking changes, and a command you can run — plus a side-by-side of what the analytics charts show with and without a plan.
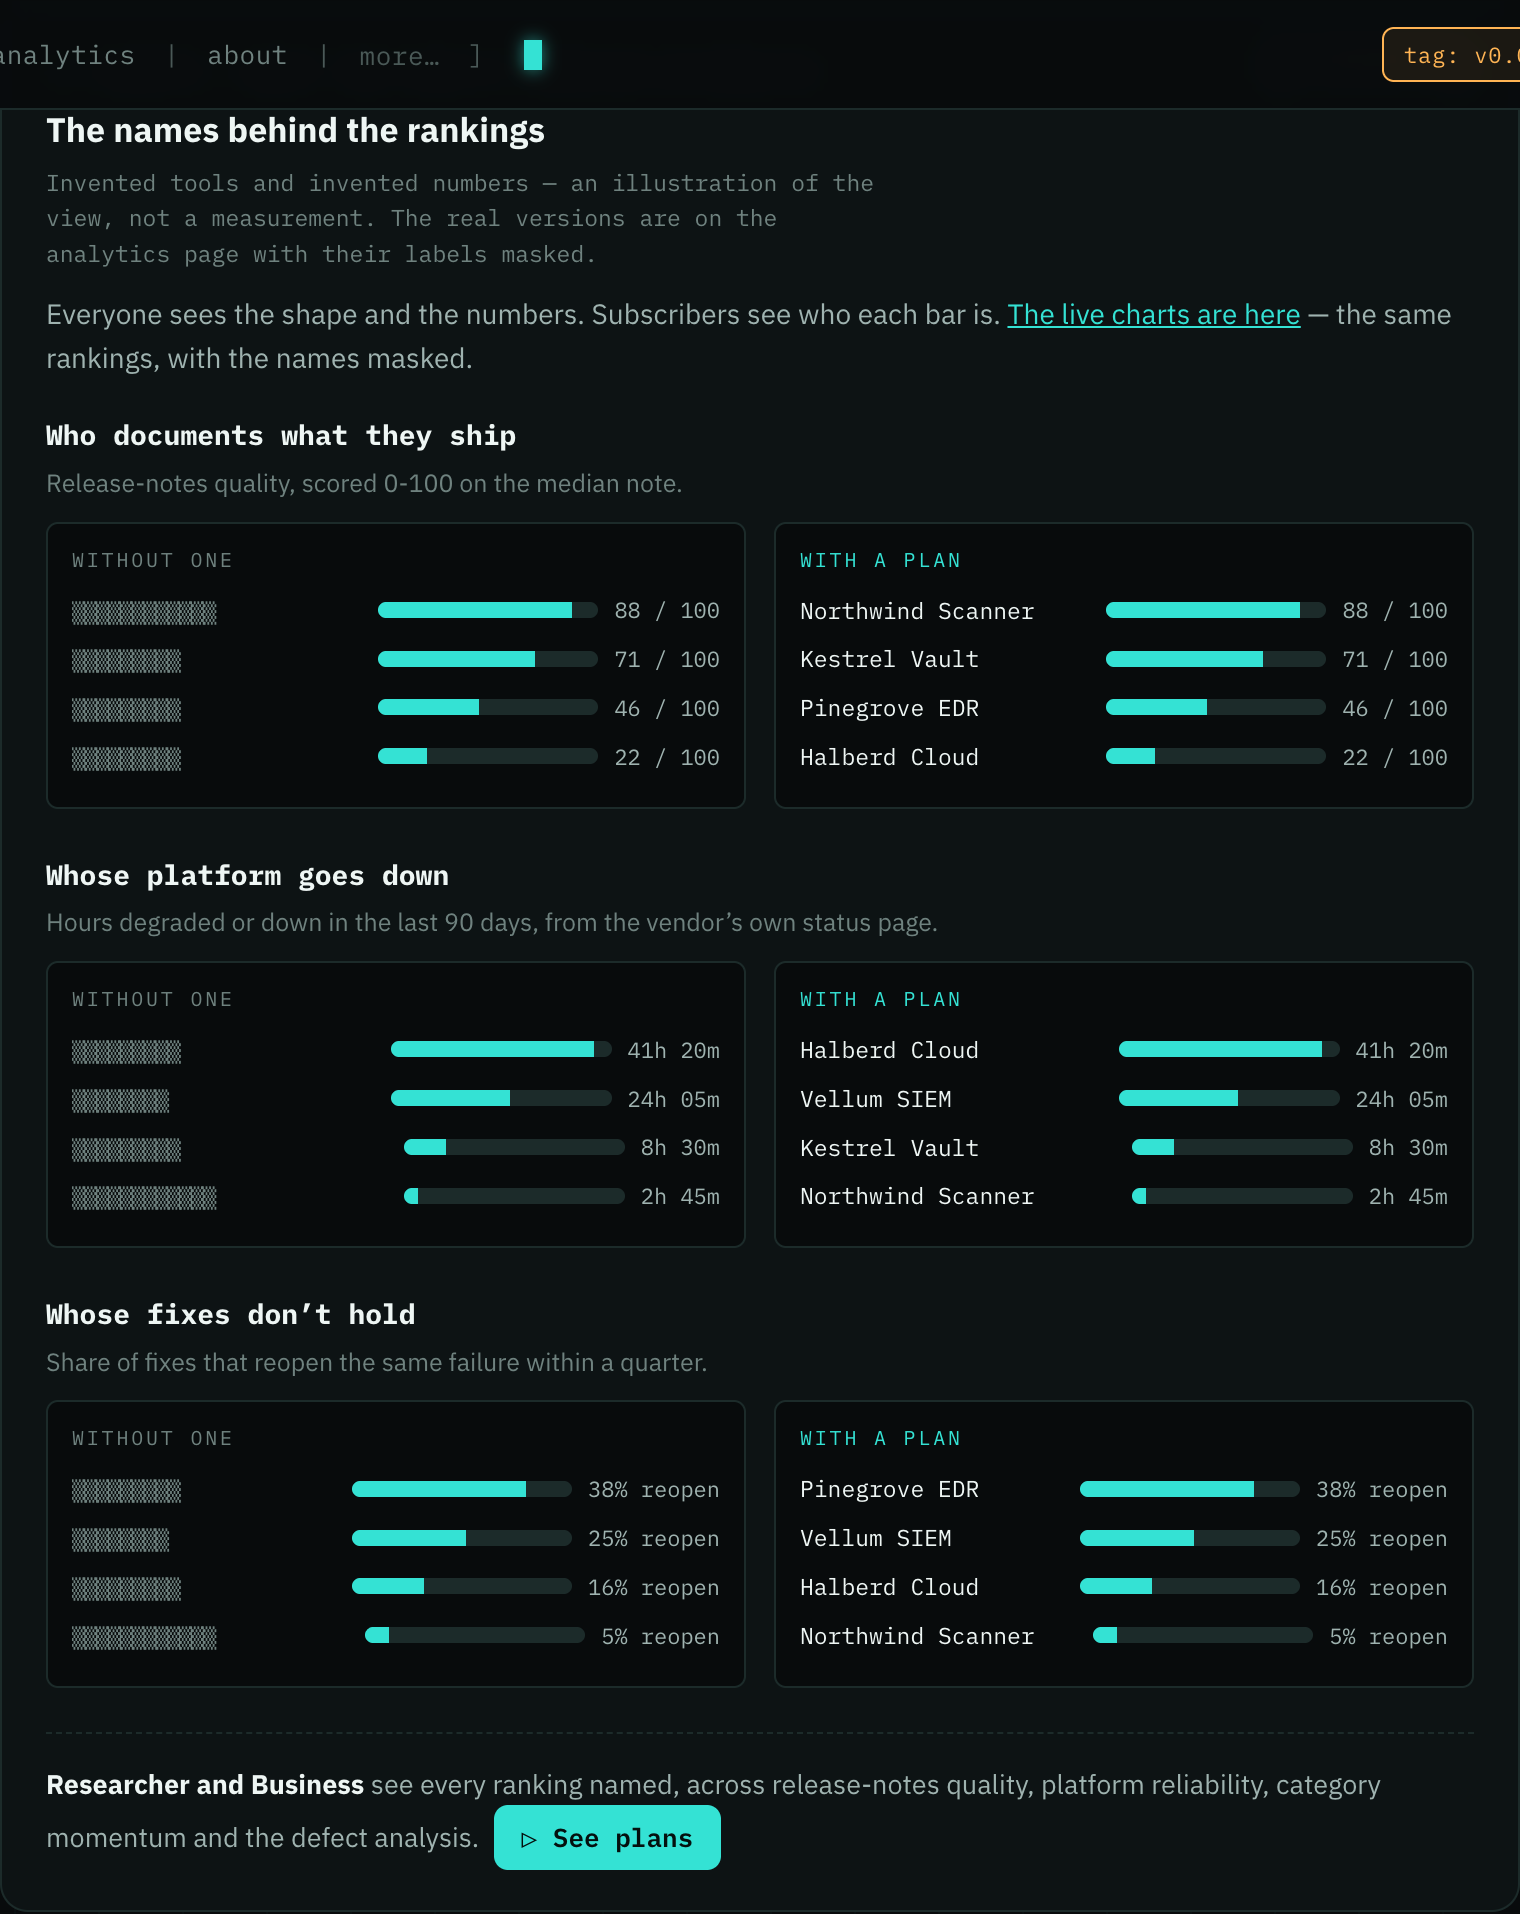
- Prices now show in your own currency. Pick USD, GBP, EUR or AUD on the plans page and see what you would actually be charged, not a US figure to convert yourself.
- The plans page says what you are missing rather than how it is hidden, with a link to a live redacted chart so you can check the claim before paying. Sections are easier to find, and the FAQ explains which charts withhold names and why.
- The issue picker offers Diff as a subscribe link instead of listing back issues, and every sample links to the full issue it came from.
- Compare the publicly traded cybersecurity vendors on growth, profitability and where they spend — three new charts on /analytics, built from 18 companies' SEC filings.
- Every figure names the filing and the exact tag it came from, so you can check any number against the original source document.
- Company names on the financial charts are included with Researcher and Business plans.
- Grep now says plainly how your picks combine: a named tool OR anything in a category you follow, in one issue, never two — and a category keeps covering tools we add to it later.
- Apple Pay is on its way to checkout, alongside PayPal and card.
- Plans no longer include a 14-day trial — subscriptions start straight away.
*
Aug 8, 2026
-
Screenshots and demo videos in the newsletter now render properly: a picture the vendor has since deleted is served from our own archived copy instead of leaving an empty box, and a demo video that a release page also published as a still image now appears once, as a player, rather than twice.
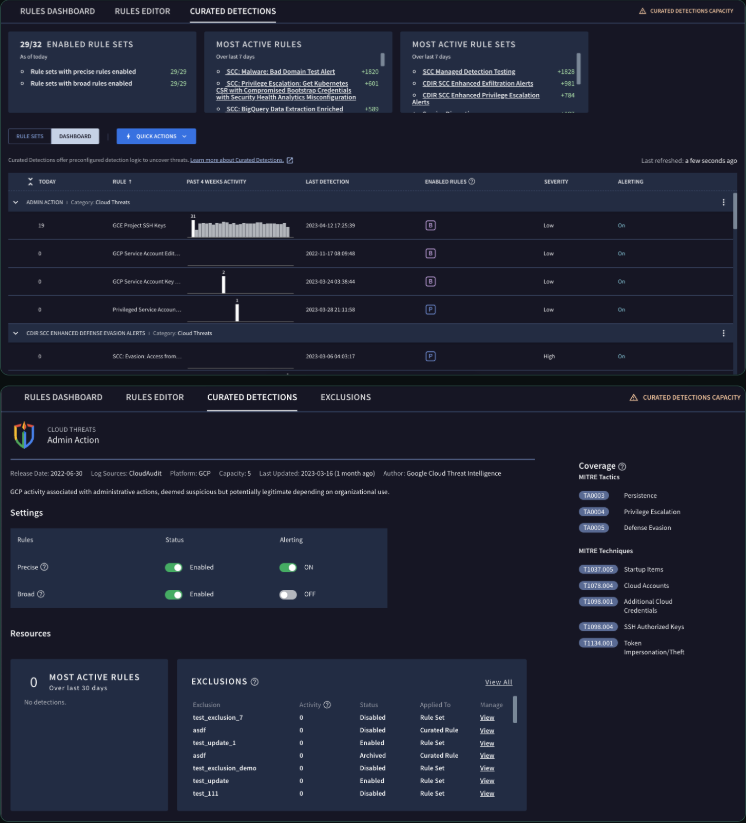
-
New on Analytics: “Where companies are investing” — what every vendor we track is hiring for, read weekly from their own job boards. Open roles by product area, over time, engineering versus go-to-market, and by region, across 70 companies and 6,925 open roles. Name any covered company to pin it to every chart, or name several to compare them side by side, with a share view so a small company stays readable next to a large one. Everyone sees the full shape and every number; Researcher and Business see the company names.
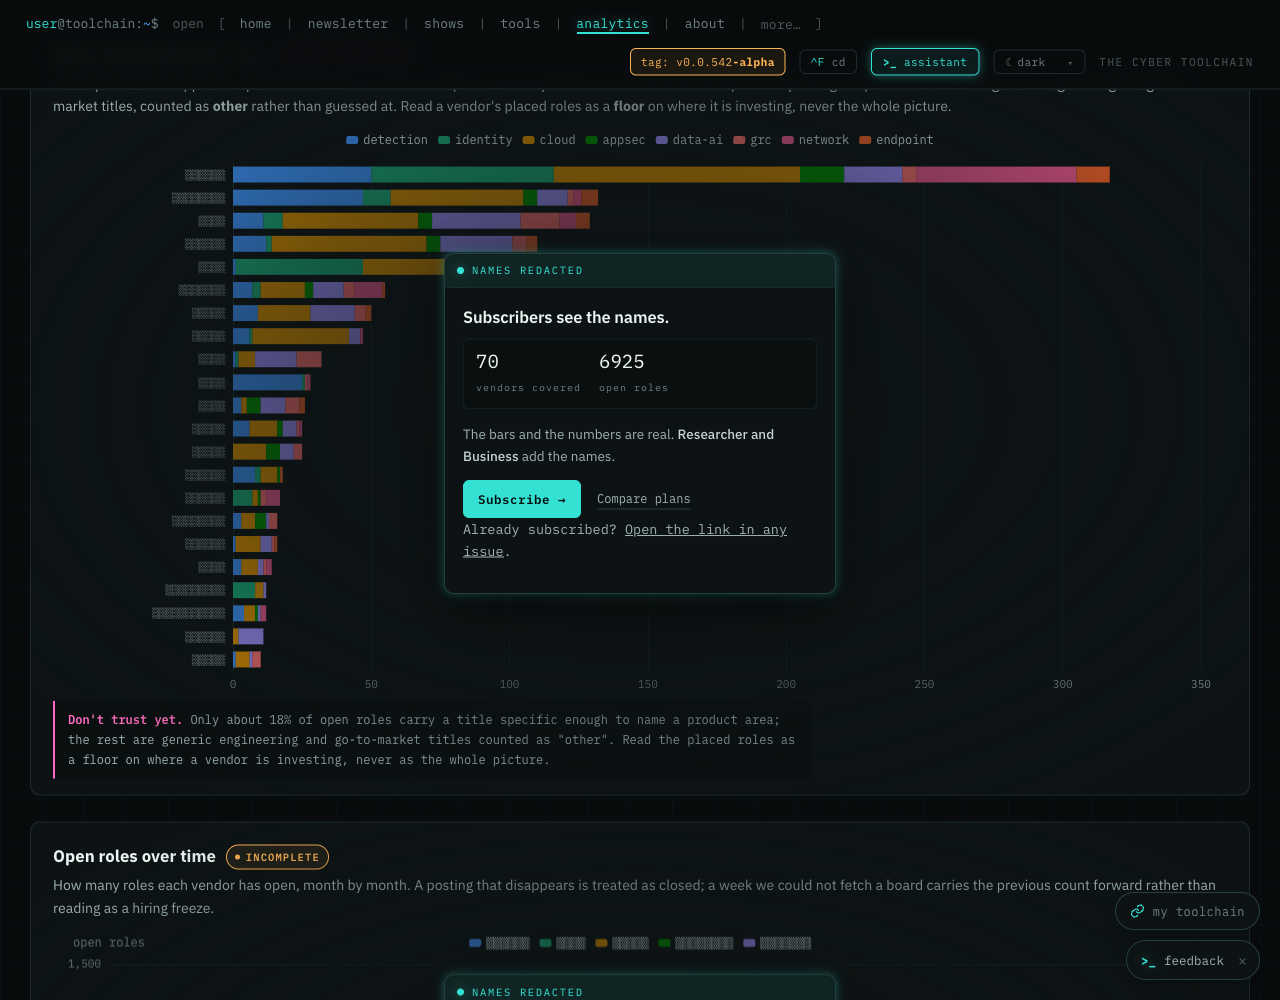
-
Analytics now shows what cyber tools actually break. Five new charts read every bug-fix line we can pull out of release notes: which failure kinds are most common across the market, where each tool's defects concentrate, how many distinct ways a tool fails, whether repair is crowding out new capability, and whose fixes keep reopening. Everyone sees the full shape and every number; Researcher and Business see the tool names.
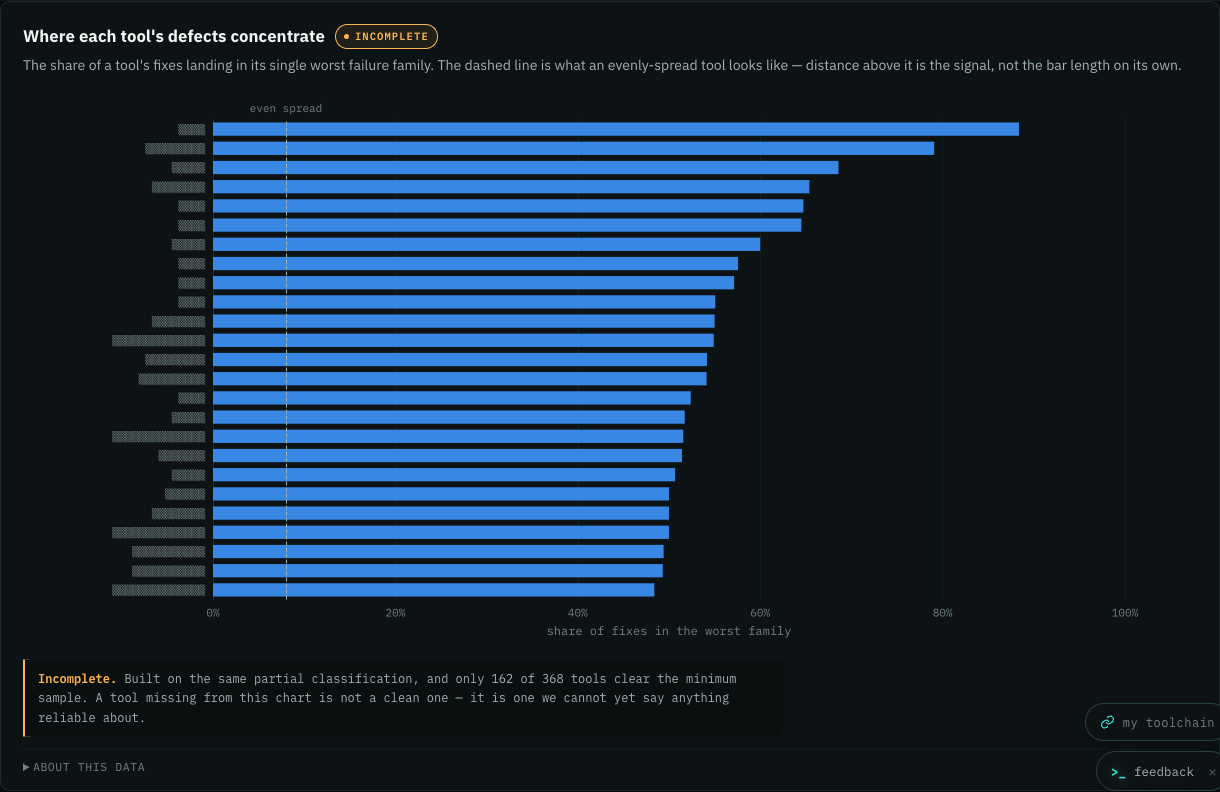
- Tools that never publish release notes now appear in the newsletter. Nmap, CAPEv2, deepsec and Adrian are the first — they ship continuously without cutting releases, so we read what changed in their code and write it up. Each entry links the exact set of changes it describes, and where a project hasn't tagged a version the entry says “changes since” a date, because the project never said it shipped anything.
- Fuller release notes for Codacy, Bright Security, Acsense, Hudson Rock, Furl, Daytona, Xygeni and Sophos ZTNA, which were showing headlines with the detail missing. Codacy's entry links now resolve instead of 404ing.
*
Aug 7, 2026
-
Release-notes quality, SaaS platform reliability and category momentum now name the tools behind each bar for Researcher and Business subscribers. Everyone still sees the full shape — every score, bar and downtime figure — with no account.
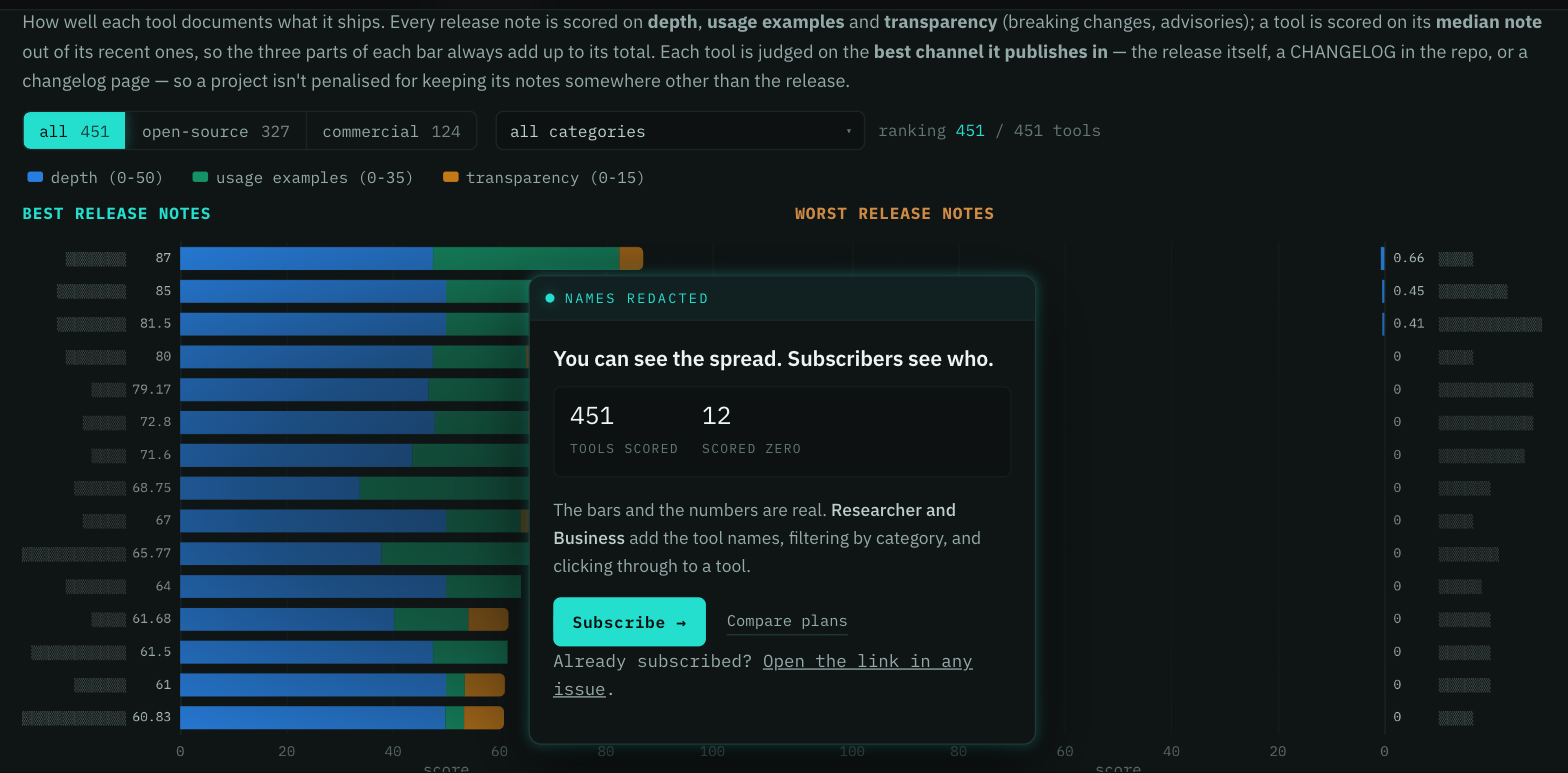
-
Newsletter issues read at one size on a phone. An entry describing a long API endpoint used to render in noticeably larger text than the entries around it, and pushed every page sideways so the right edge was cut off. Endpoints now wrap onto the next line, still highlighted, and nothing runs off the screen.
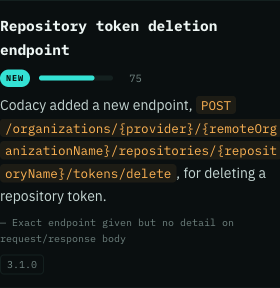
-
A feature's footnote says only what you can't get elsewhere. It used to repeat the three sub-scores already shown by the meter above it — three wrapped lines on a phone before the one line of critique. Source chips that were an internal hash like docs-af885d4d now read “product docs”.
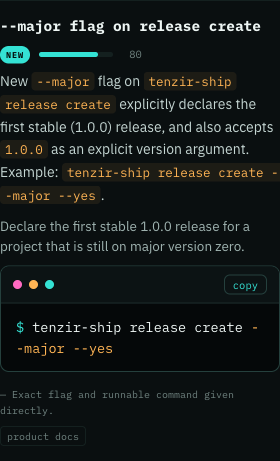
*
Aug 6, 2026
-
Subscribe to the free newsletter on Substack if that's where you already read. It sits under the signup form on the home page and in the free column on /plans. Signing up here still gets the full version — Substack renders issues as plain posts, with no per-tool links back into the site.
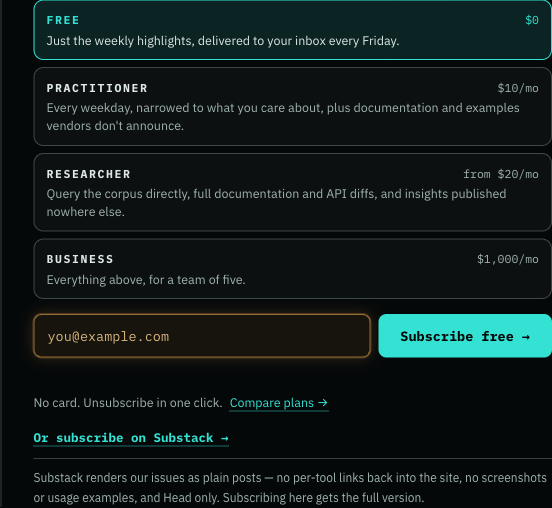
-
If a tool on your watchlist is renamed or retired, your account page now says so. Previously the pick just stopped matching and your issues quietly thinned out with no explanation. We never guess at a replacement name.

- The same update stops appearing two days running. A number of vendors publish their release notes as one long page, and any edit anywhere on it made the whole page look new — so yesterday's features were written up again today. Each issue is now checked against the two before it and prints only what you haven't read. We also went back through every issue in the archive and removed the repeats: 533 duplicate features and 42 duplicate summaries, across 26 issues since July 2.
*
Aug 5, 2026
-
Release labels read like dates, not database keys. Entries from vendor changelogs and product docs used to show an internal ID like changelog-20260731-79f7eb25; they now read “changelog · Jul 31, 2026” or “docs update”, across every past issue too.
-
Dates we can’t verify now say so. Most vendor changelog pages publish no date per entry, so we used to show the day we crawled it as if the vendor shipped that day. Those now read “seen Aug 4” with a note explaining why — on the tools table and every tool page.
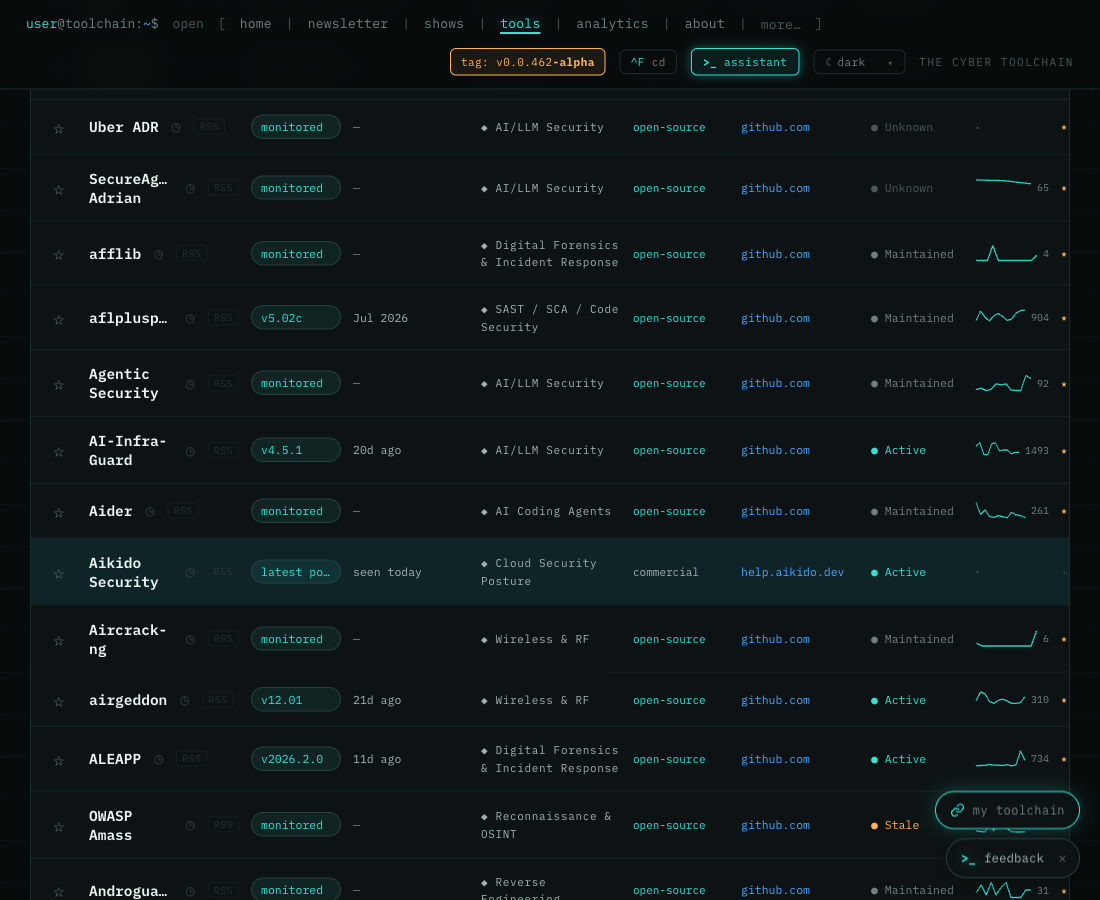
- Fast-moving tools stop losing releases. A project shipping more than ten releases between our runs — opencode, LangGraph, Gemini CLI — had the extras quietly dropped and never picked up again. We now read back as far as the window needs.
- Nine duplicate write-ups removed from past issues, where the same release had been summarized twice.
*
Aug 4, 2026
-
Choose the cyber tools your daily covers from a searchable table — filter by tool or vendor, follow a whole category, and see the grep your selection stands for as you build it.
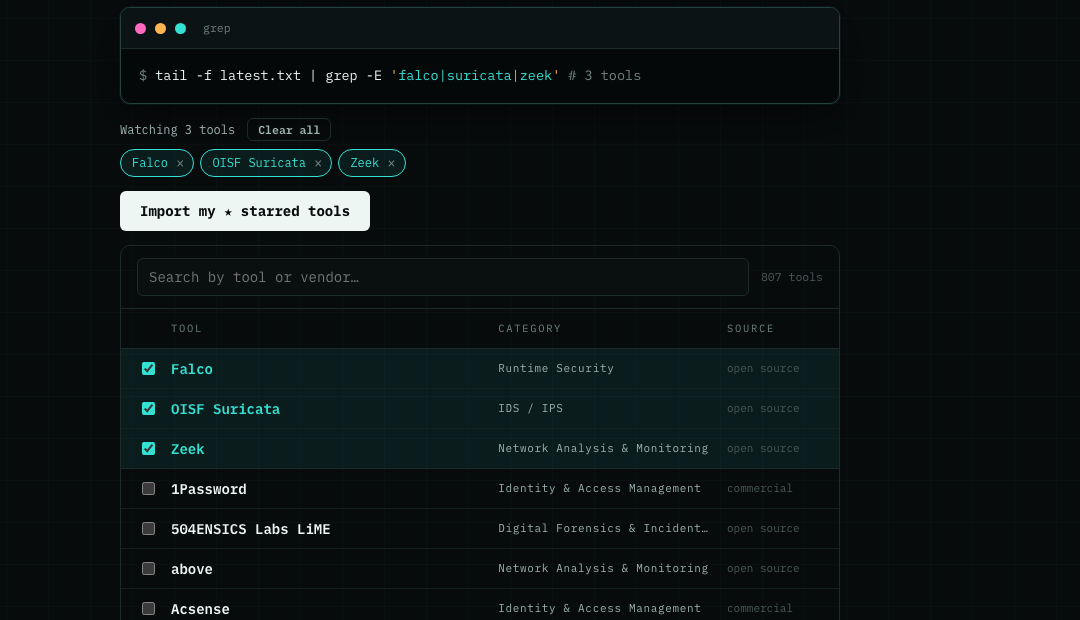
- Pick how the daily arrives: two emails (Tail + Grep), one email with your tools first, or Grep only.
- Read the newsletter in light or dark. Set it once in your account and every issue arrives that way.
- A thank-you page now confirms a new subscription and shows exactly what is active.
-
Pick how the site reads: dark, light, sepia or high contrast. Sepia is Solarized Light — warm paper for a long session. High contrast moves to a deep navy ground with white type and drops the glow for maximum readability, and if your system asks for more contrast the site now starts there. Choose from the theme button in the top bar or type the name into ⌘K — it follows you across the site.
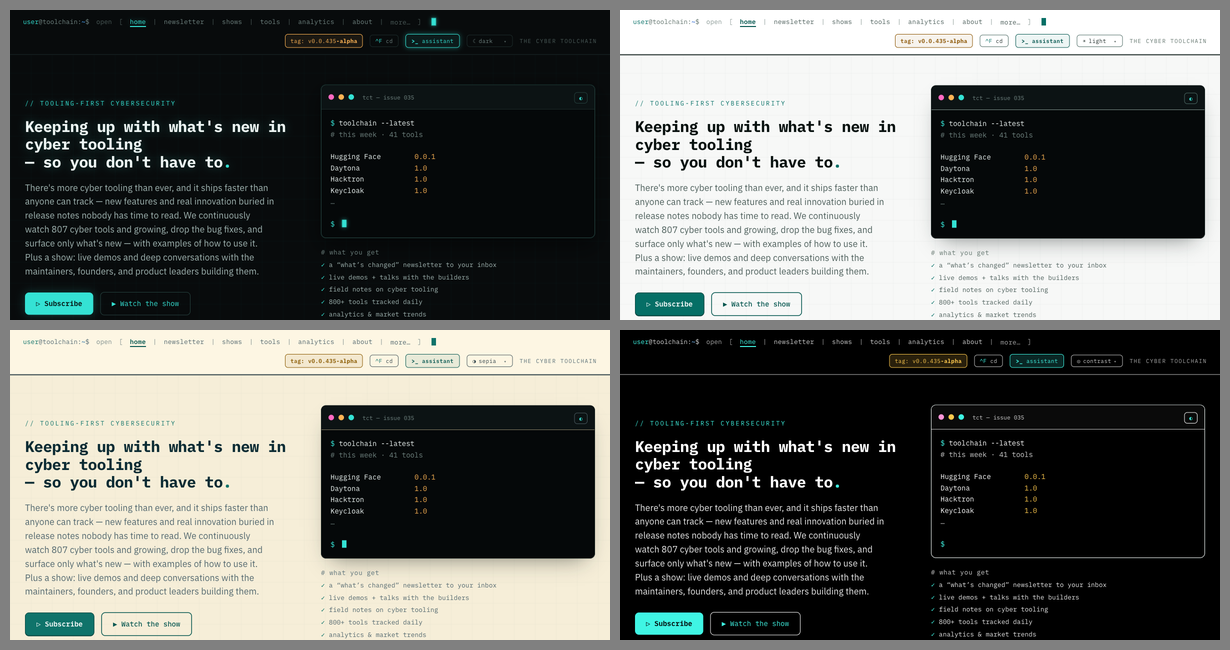
-
Windsurf is now tracked as Devin Desktop. Its old page stays put with the full release history and points you to the new name.
- Sophos release notes now land in the newsletter: 27 products, from Sophos Firewall and Intercept X to ZTNA and Central, each release listed on its own instead of one daily wall of text.
- Changelog entries that live on one long page now link straight to the release we described, instead of dropping you at the top of the vendor's changelog.
- Scrut Automation is now read from its real release notes, and RIG Security from its blog — both were pointed at pages that had stopped carrying releases.
- Aviatrix and Aviatrix CoPilot are now tracked. Both join the watchlist in network defense, so their controller and CoPilot releases show up in the newsletter and on the tools page — and the vendor's launch announcements get picked up from their newsroom too.
*
Aug 3, 2026
-
Search results now tell you what they are. Press ⌘K and matches group under Tools, Field Notes and Issues, each row tagged by type with its category on its own line — and the list renders in the site's terminal type instead of a fallback font.
-
The vision on the About page now stands out in amber rather than blending into the page around it.
-
The Subscribe button on the home page now has an arrow pointing it out, so the way to sign up is obvious on arrival.
-
Newsletter entries now lead with the code and config you can actually use: the exact API endpoint, flag, config key or file path a release introduced, quoted verbatim instead of paraphrased into “adds filter rules”. Two named surfaces are never merged into one line, so a documented endpoint no longer disappears into the feature beside it.
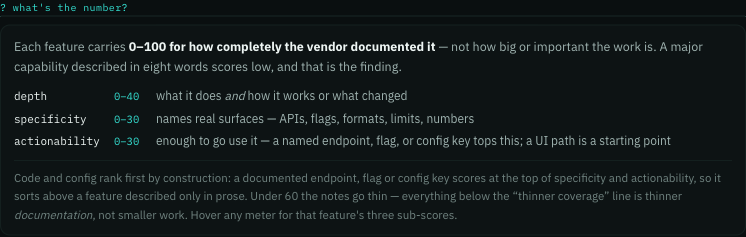
- We were also throwing away most of some vendors’ changelogs. Six tracked products were being summarised from their headline alone — one Hacktron entry was built from 65 bytes of a 3,250-byte page — which made well-documented releases look thin. Those pages are now read in full; that entry went from 6 features to 21.
- Fixed a tool description that read “I don’t have access to external URLs…” — an AI refusal published as if it were the product summary. Descriptions that fail now show nothing at all rather than something wrong.
-
The site now opens in dark mode. Prefer light? A one-time nudge points at the switch on your first visit.
-
Head is free by email — every Head issue now says so up top, with a one-click sign-up.

-
The plans page now shows, per newsletter, what you can read on the site and what arrives in your inbox — so what a plan adds is visible before you compare prices.
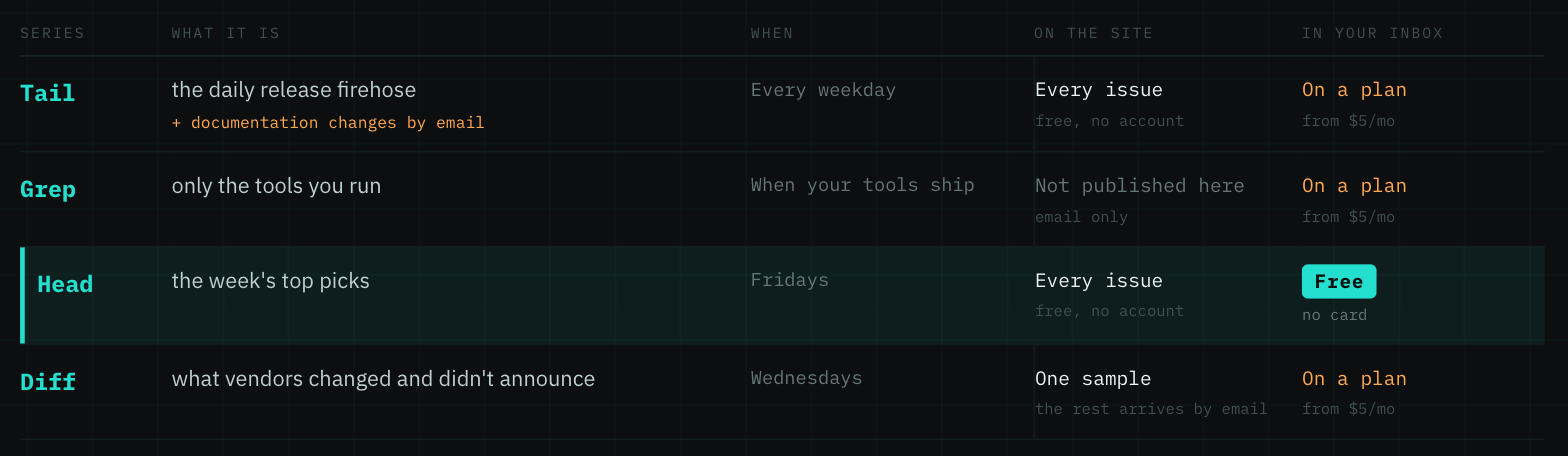
-
Hover the score on any release feature to see how it was graded — depth, specificity, actionability — and a new key explains what the number measures: how completely the vendor documented it, not how big the work is.
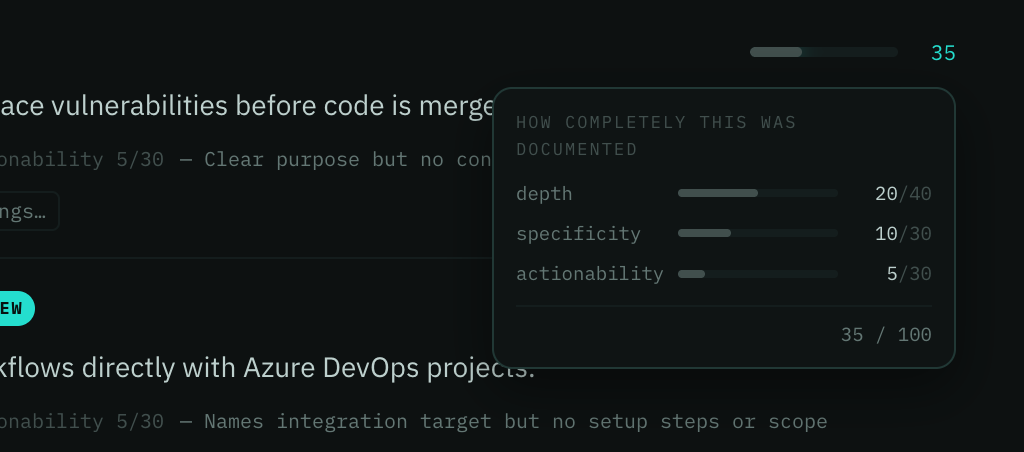
- Every newsletter issue now carries the subscribe pitch, with an x if you would rather not see it again.
-
Open any endpoint on a tool's API page to see what it takes and what it returns — parameters, request body, response shape, and the vendor's own example call.
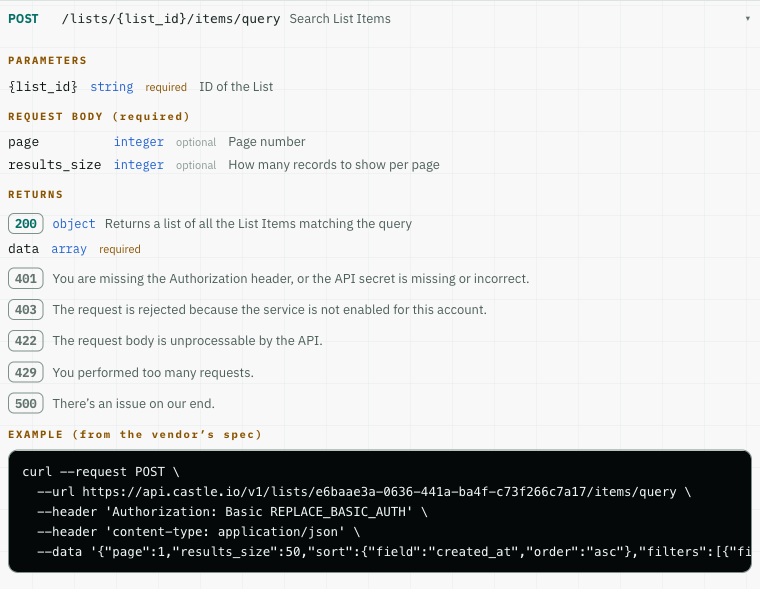
- API pages now group endpoints by capability area, with the vendor's own description of each — so you can tell at a glance whether an API does anything you need.
- When we find a tool's API for the first time, the newsletter now says what it covers instead of just how many endpoints it has.
-
Contact us at info@cybertoolchain.com — one official address for questions, press, and partnerships, replacing the old personal one. Newsletter replies land there too.
-
The terms, privacy policy, and refund policy are now published at /terms, /privacy and /refunds — linked from every page footer.
- Your preferences are covered in writing: the tools you choose to monitor are never published, aggregated, or sold, and one email gets everything we hold about you deleted.
- Refunds are 30 days, no questions asked, on every plan.
-
Compare what each plan gets you at /plans — the four newsletters now have names: Tail (the daily release firehose), Grep (only the tools you run), Head (Friday's top picks), and Diff (what vendors changed and didn't announce).
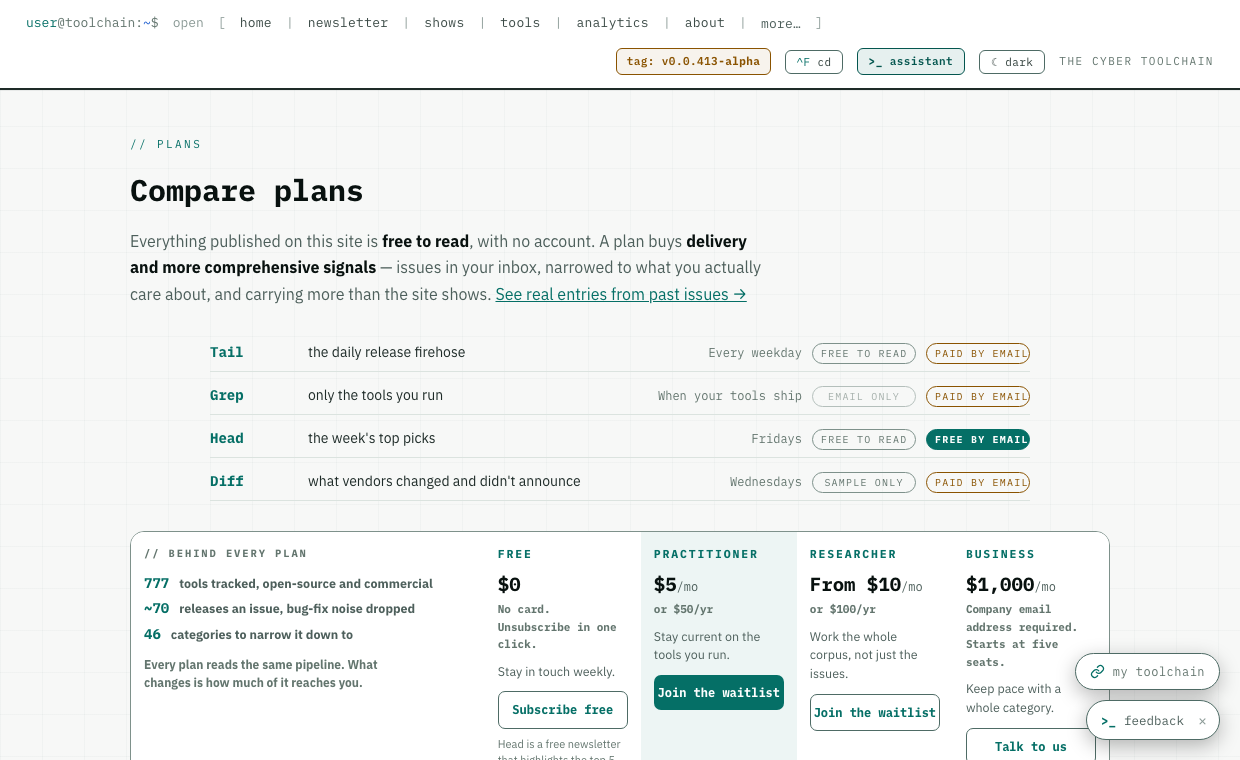
- See real entries from past issues at /samples before deciding anything.
- Head stays free by email. Everything published on the site is still free to read, with no account.
*
Aug 2, 2026
-
A tool's recorded commands now say what they do. “Redact secrets from logs and stdout” instead of “the --redact option” — taken from the tool's own help, across 300 runs. Tool pages also open on these examples now, ahead of the option list and the release history.
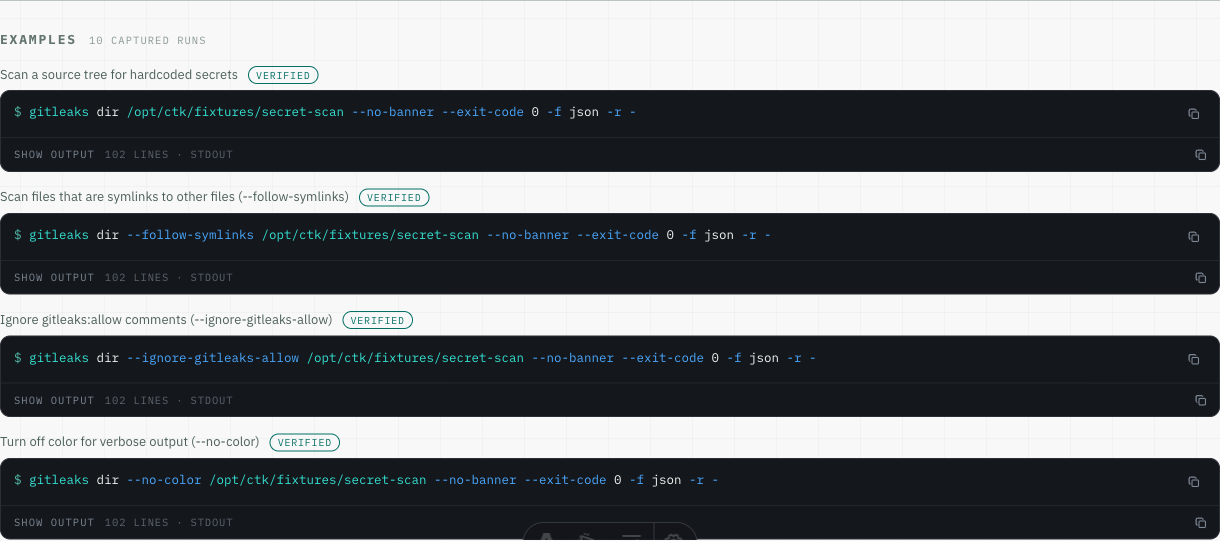
-
From a tool's card, jump straight to the commands we actually ran. The commands list now ends with a link to that tool's captured runs — shown only where there are some.
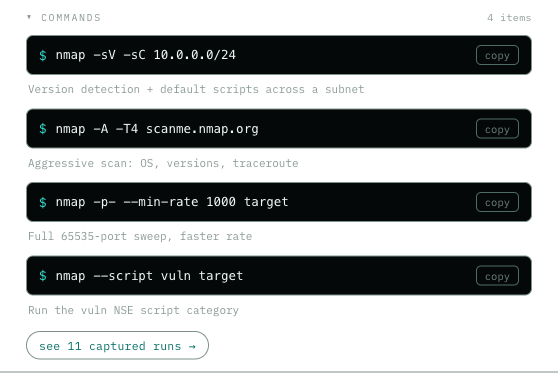
-
Light mode got a redesign. It now reads like a printed manual rather than a dimmed version of the dark theme: white stock, ink-black type, and edges you can actually see on panels, buttons, chips and the menu — including the tools table, the tool pages and the newsletter.
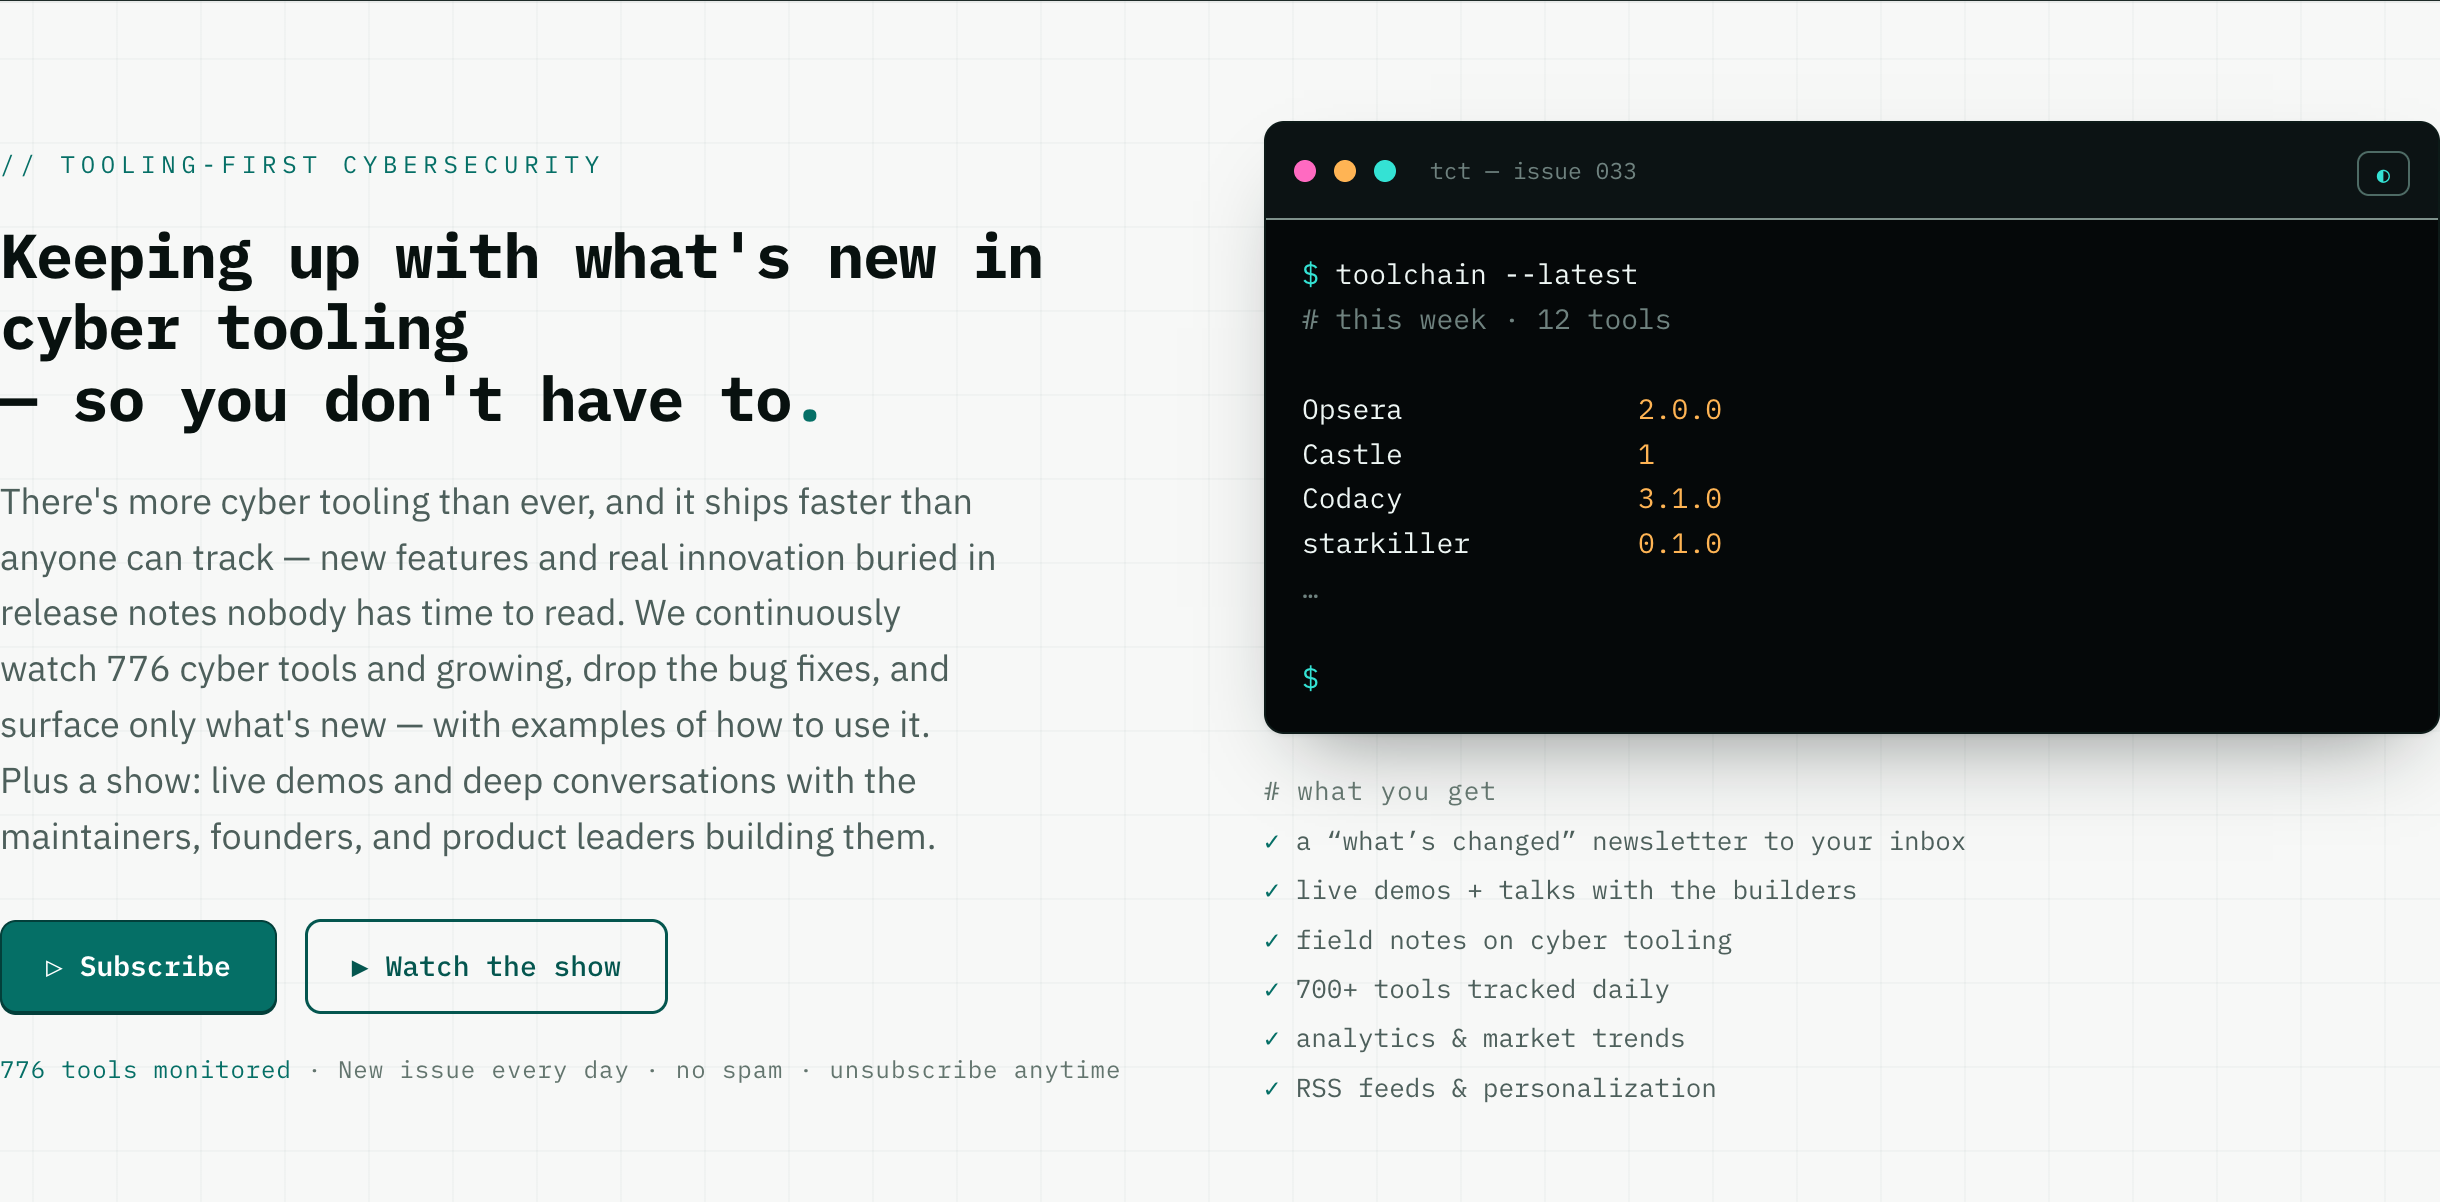
- Set the watchlist columns to the widths you want. Drag the divider between any two column headings and the layout is remembered next time; a reset link puts it back.
- A tool's recorded commands now live in one place. The code-analysis page links to the tool page that carries them — with its example picker and flag history — instead of showing a second, plainer copy of the same runs.
-
Every recorded command on a tool page can now explain itself — click Explain it and you get what the run was pointed at and what came back, in plain English, written from that run's own output and checked against it.
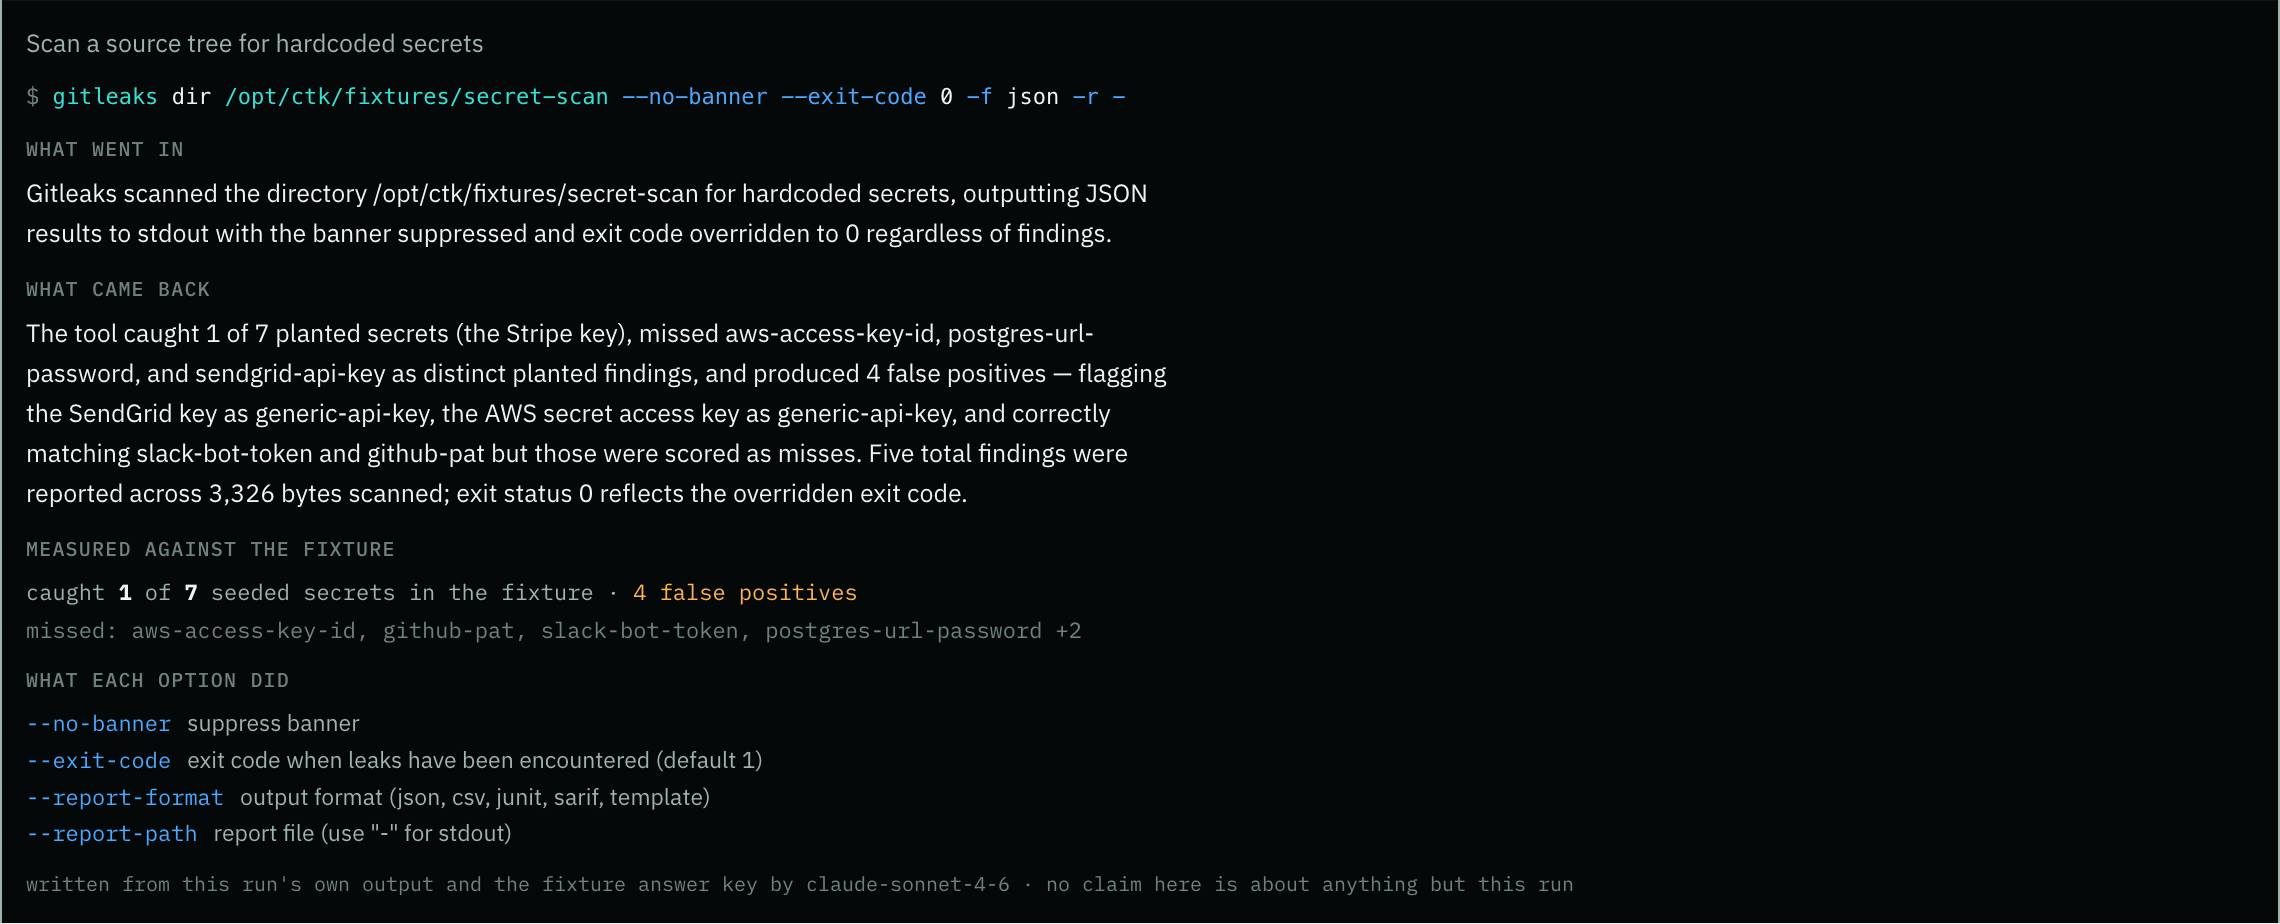
-
Copy a command or the output it produced straight from the terminal it sits in — a small icon on each window's title bar, instead of a button taking up a line of its own.

-
The homepage now tracks the languages of choice for cyber tooling — the tools we watch by primary language, cumulative by the year each project started.
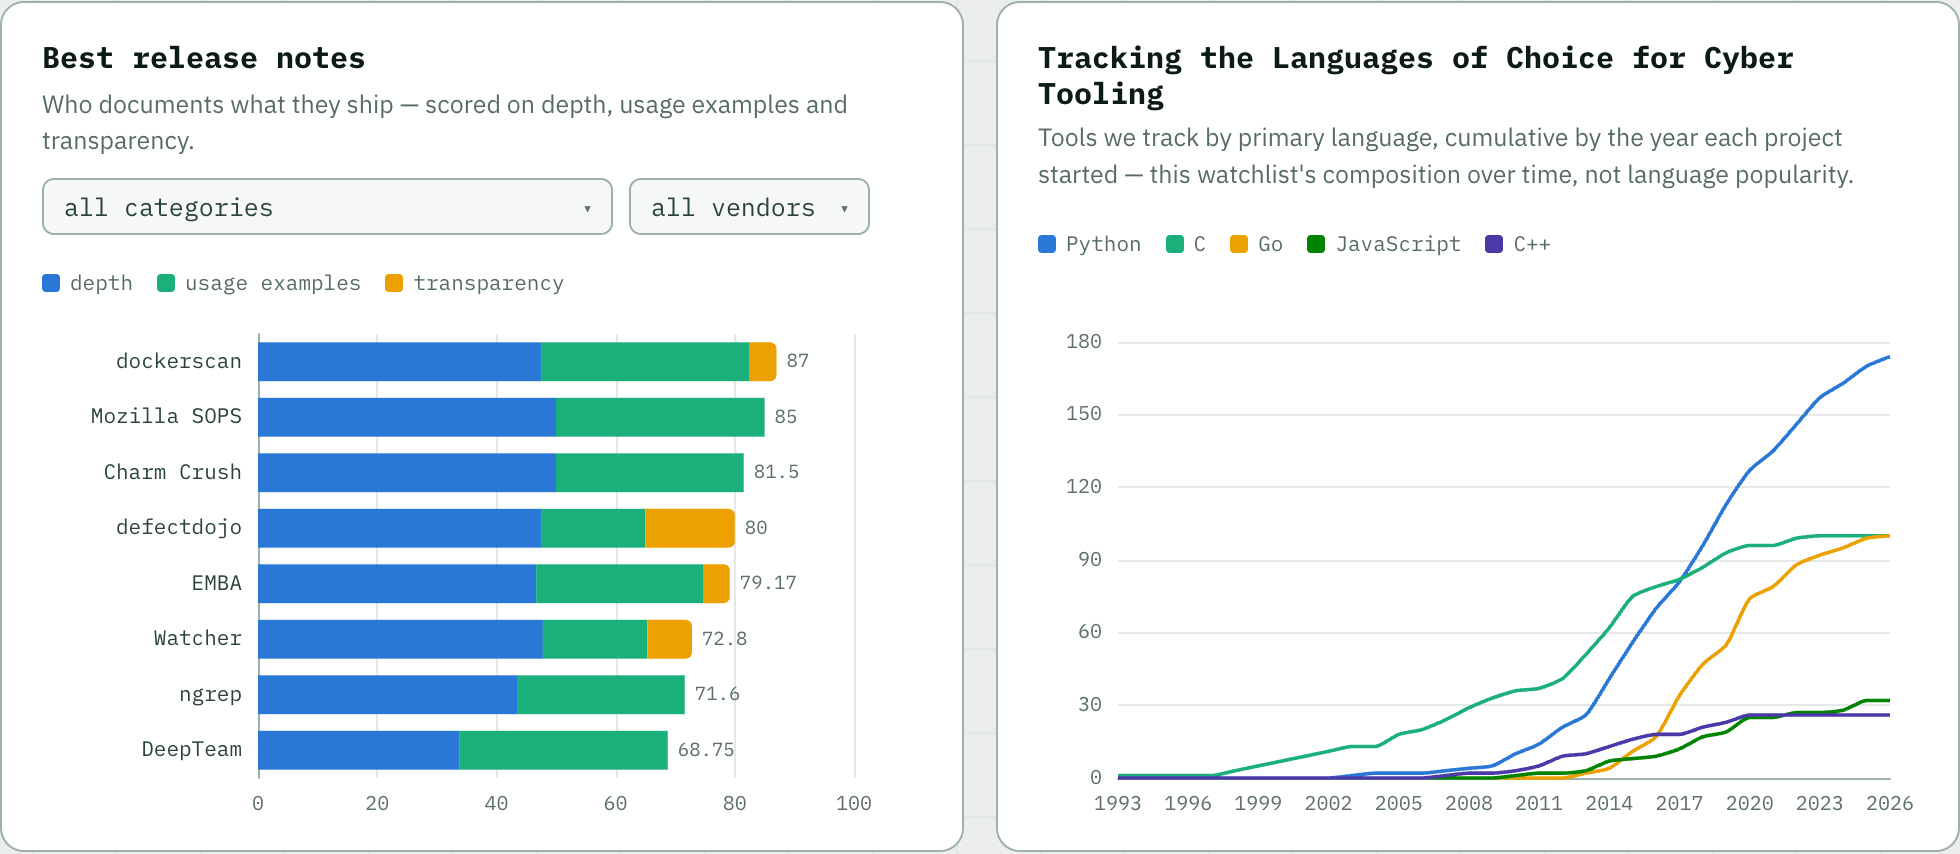
- Pages now use the width of your screen, so the tool table, option grids and charts stop rendering in a narrow ribbon down the middle.
- The section bar on a tool page reads as a menu now, so jumping to examples, code or dependencies is easier to spot.
-
Every tool page now opens on what the tool can actually do — its command-line options grouped by what they act on, searchable, and clickable into a command you can copy.
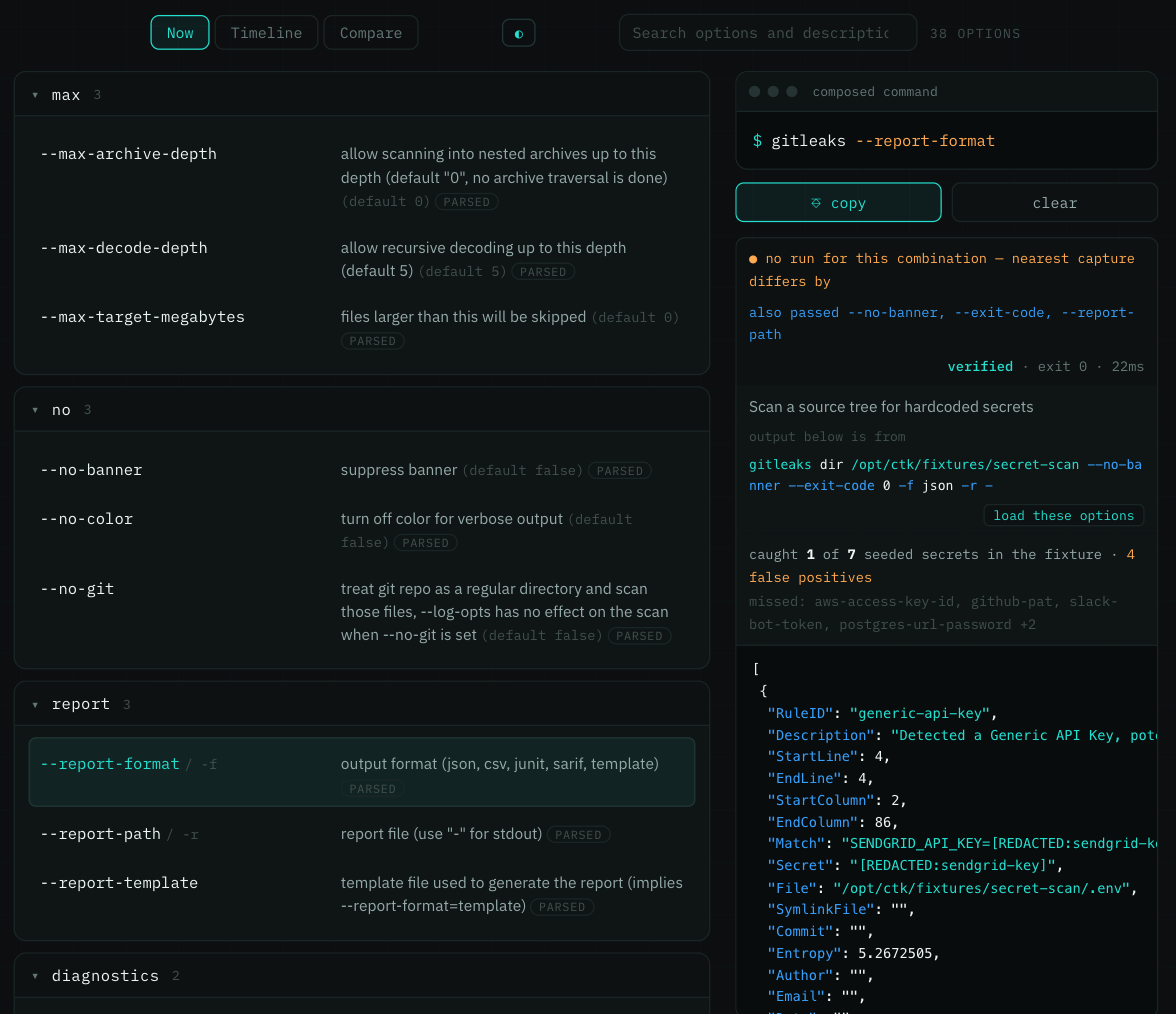
-
On a tool's Timeline you can now jump straight to a version from a dropdown, instead of scrubbing or stepping through 40 releases to find it.
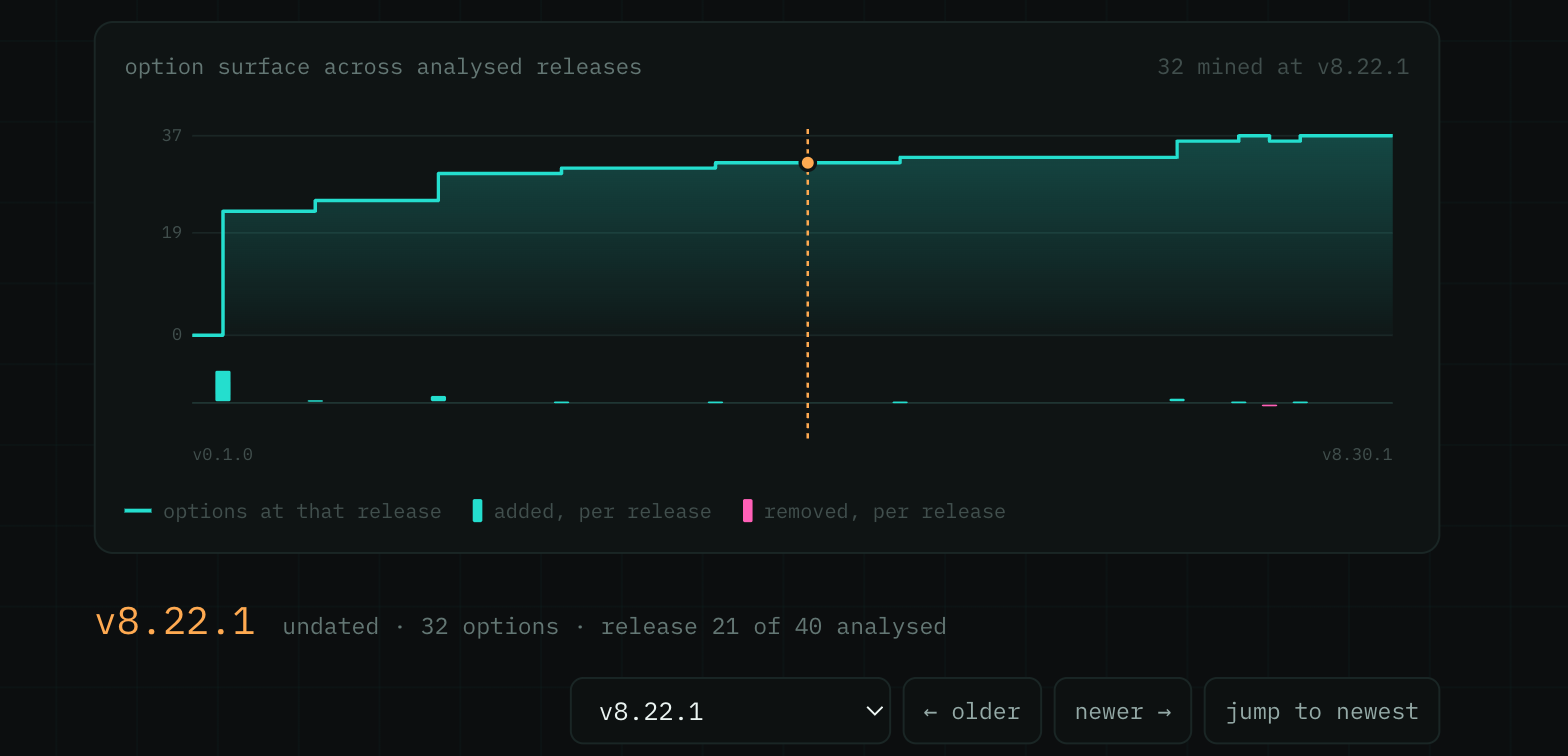
- Pick options and the page shows what that command really printed when we ran it: the exact run when one exists, the nearest real run when it doesn't, and a plain 'nothing to show' when neither. Output is never simulated.
- Two new views on the same section — Timeline scrubs the option list back to any analysed release, and Compare tells you what you gain, lose and see reworded between any two versions.
- A specific comparison is now linkable, and every section of a tool page is one click away from a nav bar that follows you down the page.
- Dragging either end of the Compare range now works — previously only clicking did.
- A tool with no releases yet now tells you why: the last release in the project's own history, and the day it went on the watchlist.
- The tool card's SBOM button is now “code analysis” — it always opened the whole page: languages, AI-authorship evidence and dependencies, not just the SBOM. The “copy url” button is gone.
*
Aug 1, 2026
-
Every tool page now shows its command-line history again — how many options the tool has today, and the flags added, removed and reworded at each release. It had been silently blank since late July; the data behind it is refreshed and now covers 535 tools, with captured example commands and their real output alongside.
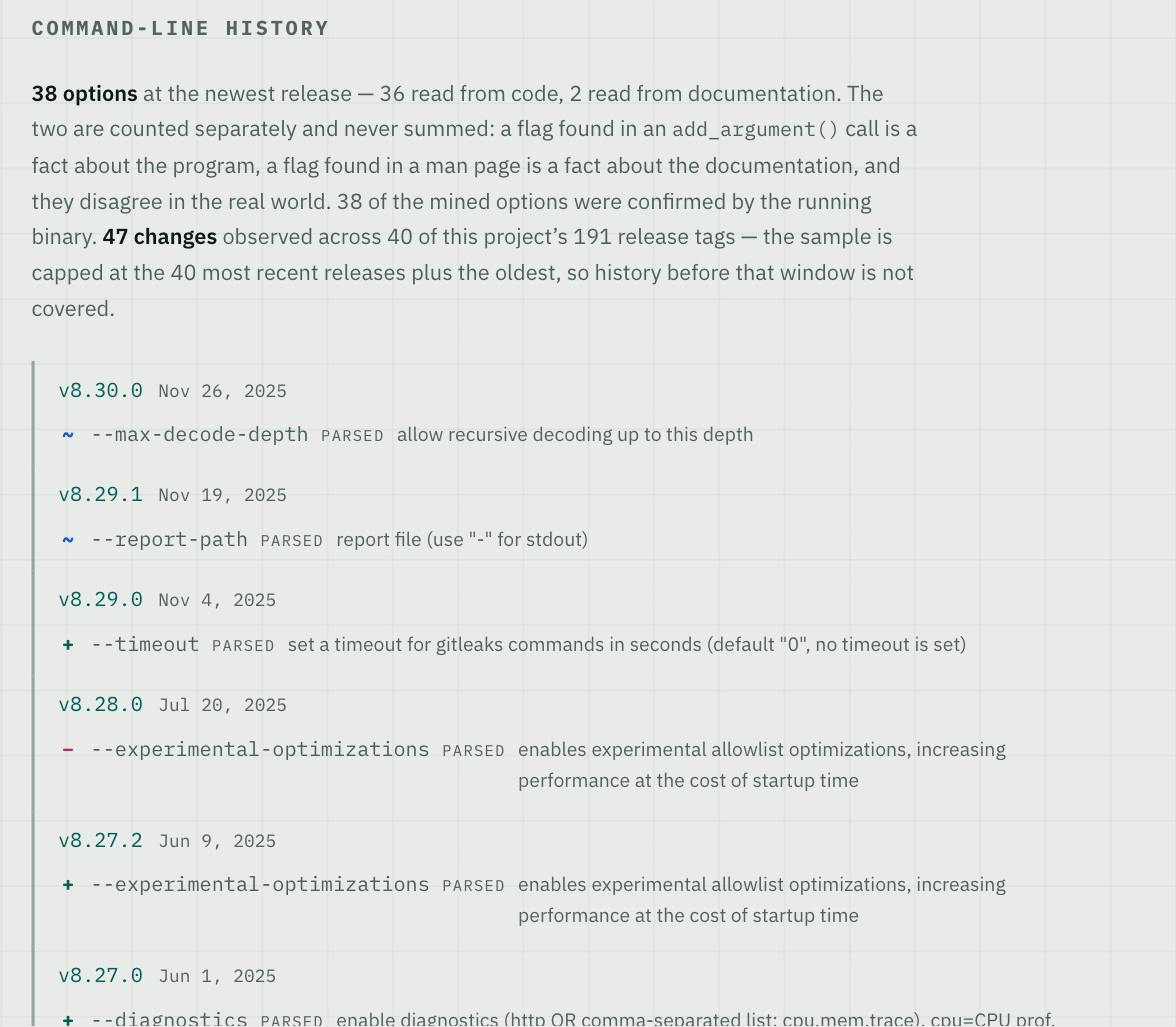
-
Eight long-form articles are now on the site at /articles — field notes on cyber tooling, product craft, and the work behind building and buying security products. Every piece is free with no paywall or signup: filter the archive by topic, follow longer reads with a contents rail and progress bar, and find any of them from the ⌘K search.
-
The newsletter filter bar is less cluttered — the Linux / Mac / Windows / BSD buttons are gone. Most tools ship for every platform, so the row rarely narrowed an issue while crowding the license, category and tool-name filters you actually use. Old ?os= share links still work; they now just show the full issue.
-
The analytics page is straighter with you about what it doesn't know yet: the programmable-surface chart now explains that it's empty because we have a first snapshot of every tracked API but nothing yet to compare it against — not because the data is broken.
- This Week's Highlights won't feature the same tool two weeks running. A tool that makes the list sits out the next issue, however much it ships — so the shortlist keeps showing you something new instead of tracking whichever vendors publish most often.
- API changes now appear in the daily newsletter as their own entries — endpoints added, changed or removed — whether or not the tool shipped a release that day. When a tool starts publishing an API at all, we say so too.
- Endpoints newly marked deprecated are called out separately from breaking changes. A deprecated endpoint still works, but the flag is usually the only warning you get before it disappears — TheHive alone already has eight.
- We now track APIs for 153 cyber tools, up from 130, including per-product APIs for multi-product vendors: Rapid7's InsightVM, InsightIDR, InsightConnect and InsightAppSec are tracked separately rather than lumped under the platform.
- Each tool's API page marks deprecated endpoints in place — next to the endpoint you were about to use — with a count in the header.
*
Jul 31, 2026
-
Pick your terminal colour theme from any tool's command-line page, not just the home page. Cyber, Amber, Matrix and Dracula recolour every terminal on the site, and your choice follows you between pages.

-
Every chart on Analytics now tells you how much to trust it — each one is marked solid, incomplete, or don't trust yet, and anything below solid says underneath it exactly what to distrust.
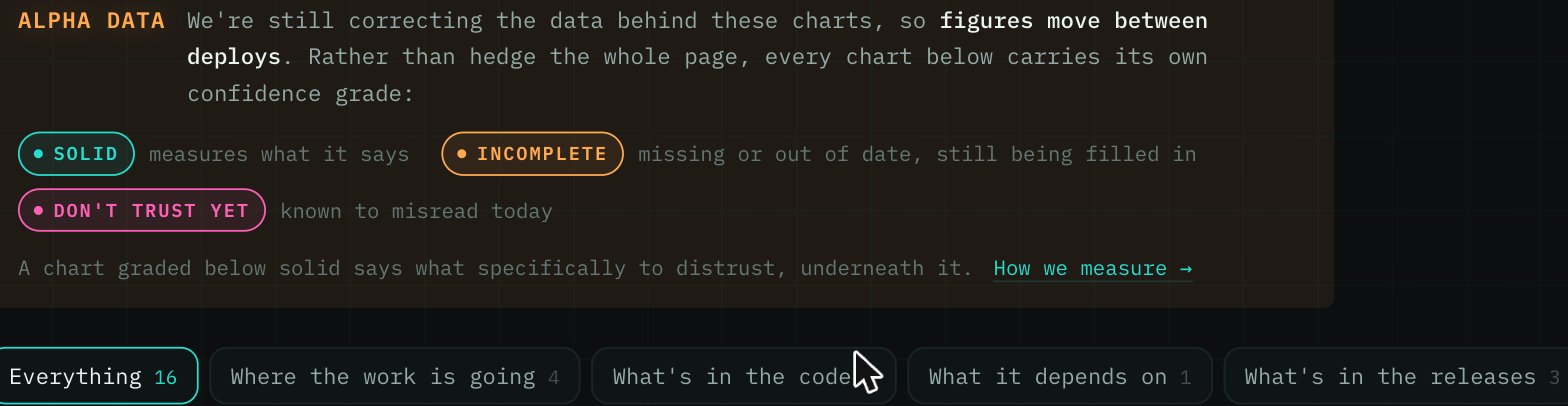
- Two charts are marked don't trust yet while we fix them: SaaS platform reliability over-counts downtime for vendors that publish per-region status components, and Programmable-surface velocity is empty until its history is stored durably.
*
Jul 29, 2026
-
Cloudflare now sits under a new Infrastructure > Internet Services category instead of Web Application Security. It runs internet infrastructure rather than selling a security product, so filing it next to the scanners it competes with overstated what it is — and it left CDN, DNS and edge providers with nowhere to be found as a group. Click the CATEGORY heading and pick Internet Services.

- Two tools joined the watchlist: OpenAI Codex Security, an LLM-driven code scanner shipping as a CLI and TypeScript SDK, and Knostic, which finds where Copilot- and Glean-class assistants overshare data and enforces need-to-know controls on what an LLM will answer.
- Promptfoo and nono moved to AI/LLM Security. LLM red-teaming and AI-agent sandboxing were filed under general application security and runtime security, where neither was easy to find.
- OpenSSH's history is no longer blank: it reads a 1999 start date and 3,928 stars, with a commit-activity trend. curl, OpenSSL, tcpdump and mdbtools gained the same — their commit histories had never been captured at all, so tcpdump also now dates to 1999.
- Progress ShareFile is no longer tracked. It never published a release channel we could read.
*
Jul 28, 2026
-
Search the whole tools table from one box: type what a tool does — kubernetes, ransomware, secrets — and the page matches on name, vendor, category, source and description at once, so you find calico and Checkov for “kubernetes” even though neither says it in its name. Several words narrow the list; the search combines with the column filters and is shareable as a link.
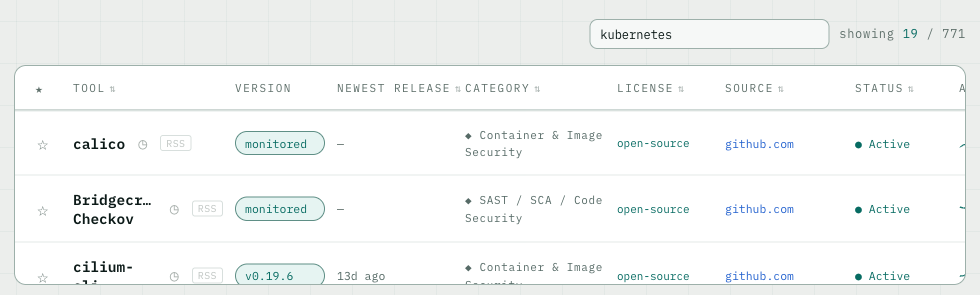
- Scrolling over an open tool card no longer drags the page behind it — the page stays put until you close the card.
*
Jul 27, 2026
-
See what tools actually do: tool pages now show real, captured command-line output — genuine runs in an isolated sandbox — each labeled "Tested against" so you know exactly what a command ran against (e.g. a deliberately-vulnerable DVWA target).
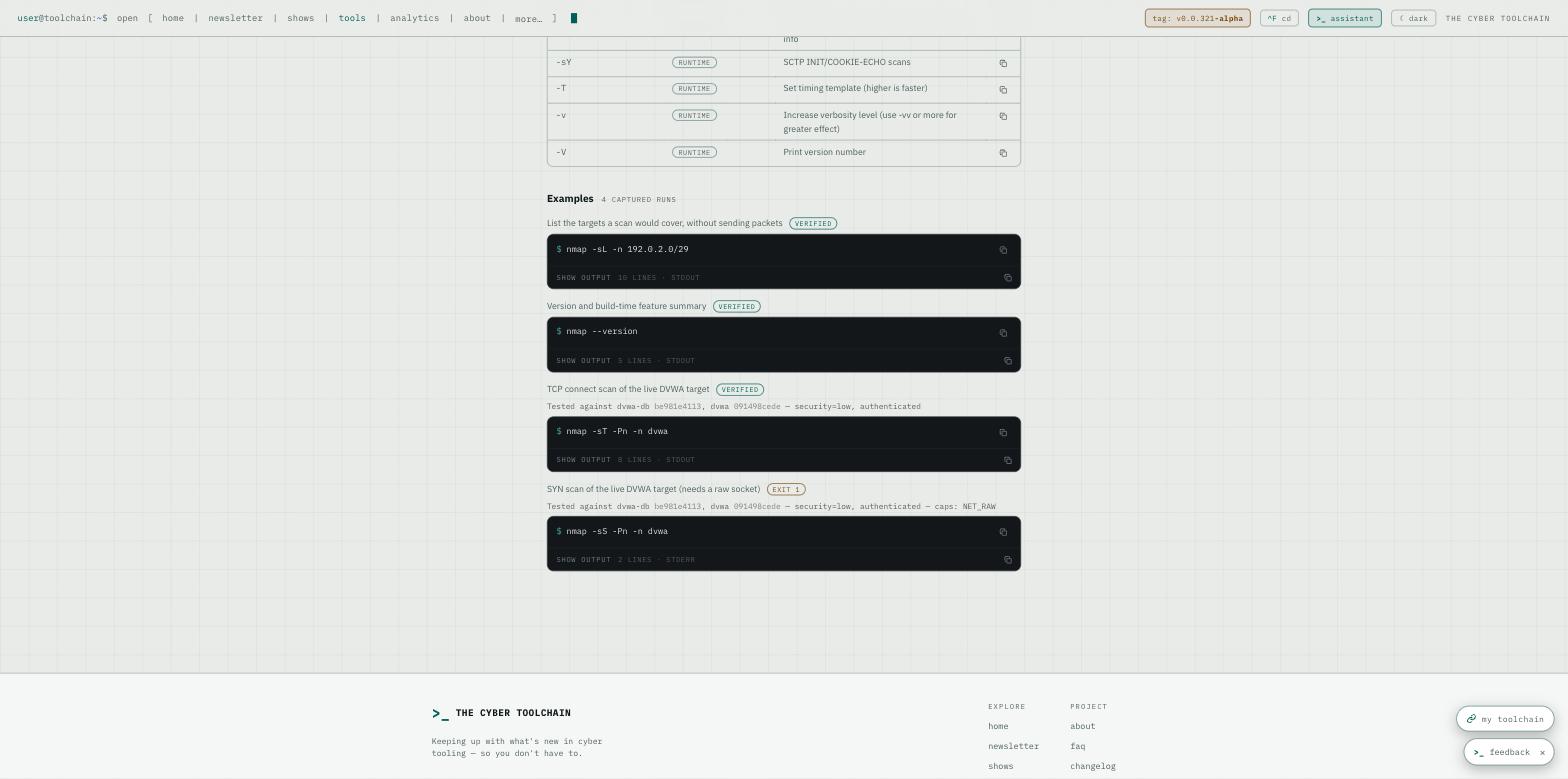
- Copy anything in one click — a command, its output, or any command-line option as a ready-to-run command (e.g. gitleaks version).
- Security scanners now carry a measured accuracy score — how many planted findings they caught versus missed, scored against a known answer key.
*
Jul 26, 2026
-
The ISSUE picker now lists the five most recent issues of each newsletter rather than every issue ever published — 13 entries instead of 31. The full archive is still one click away under all issues.
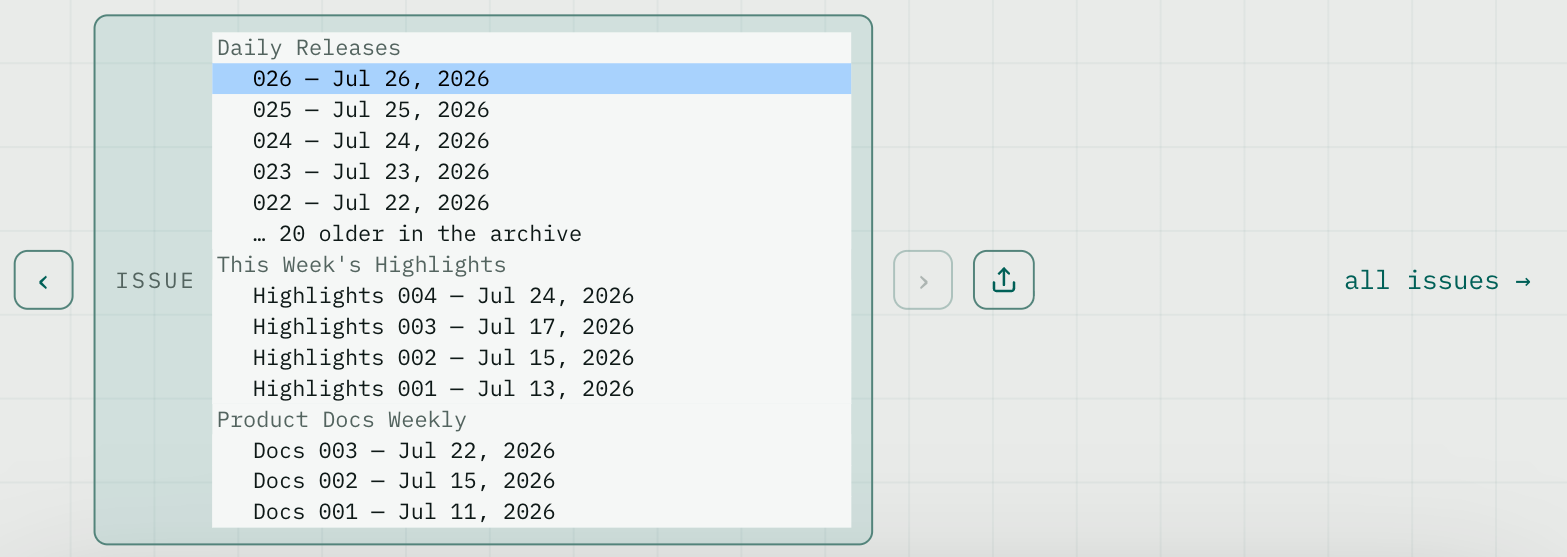
- Seven tools added to the watchlist: NVIDIA Nemotron, Hugging Face, vMLX, Ghostty, Landlock, Knocknoc and Termius — with a new AI Model & Data Infrastructure category for the model and dataset platforms.
- Tailscale releases now appear in the newsletter. Every one of their GitHub releases just says "refer to the changelog", so nothing ever made it through; we now read the changelog itself.
*
Jul 25, 2026
-
New Supply chain page: see which packages the cyber toolchain shares — requests is a direct dependency of 76 of 522 tools — and which tools declare each one.
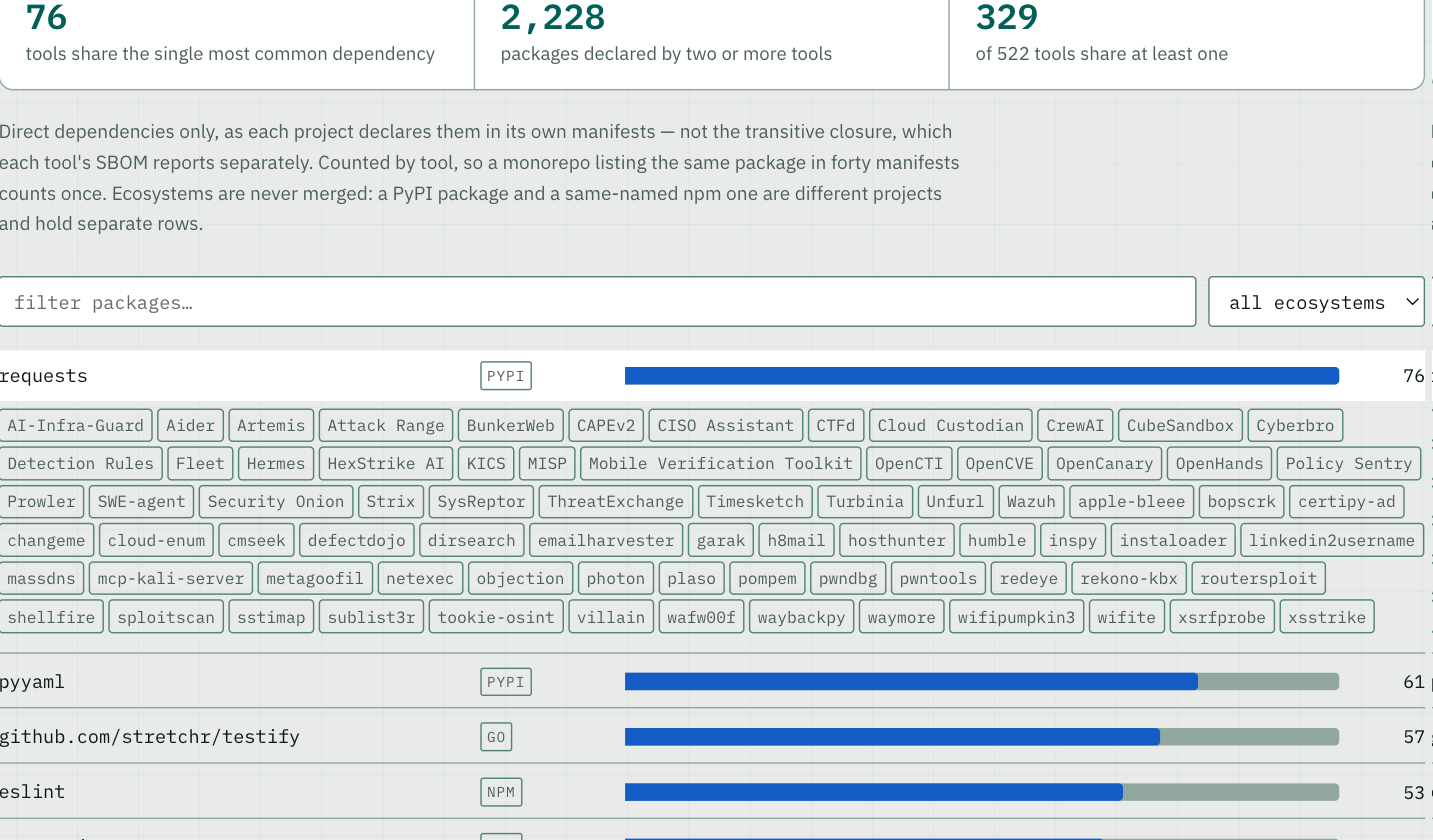
- Every tool page now shows what it relies on most: the packages the rest of the project depends on, and what connects to any one of them.
- Download the full SBOM for any tool, and see the CI actions it pins even when it has no package dependencies.
- Analytics can be filtered by question — where the work is going, what's in the code, what it depends on — instead of scrolling sixteen charts.
*
Jul 24, 2026
-
Renamed the weekly share buttons to say what they show — “Top 5” for the week's five highlights and “Top Pick” for the single standout — instead of the image shape (Square/Portrait).

*
Jul 23, 2026
-
The changelog page now opens with a week-by-week activity chart — see how much we're building and how much of it ships to you, tracked straight from our git history and this changelog.
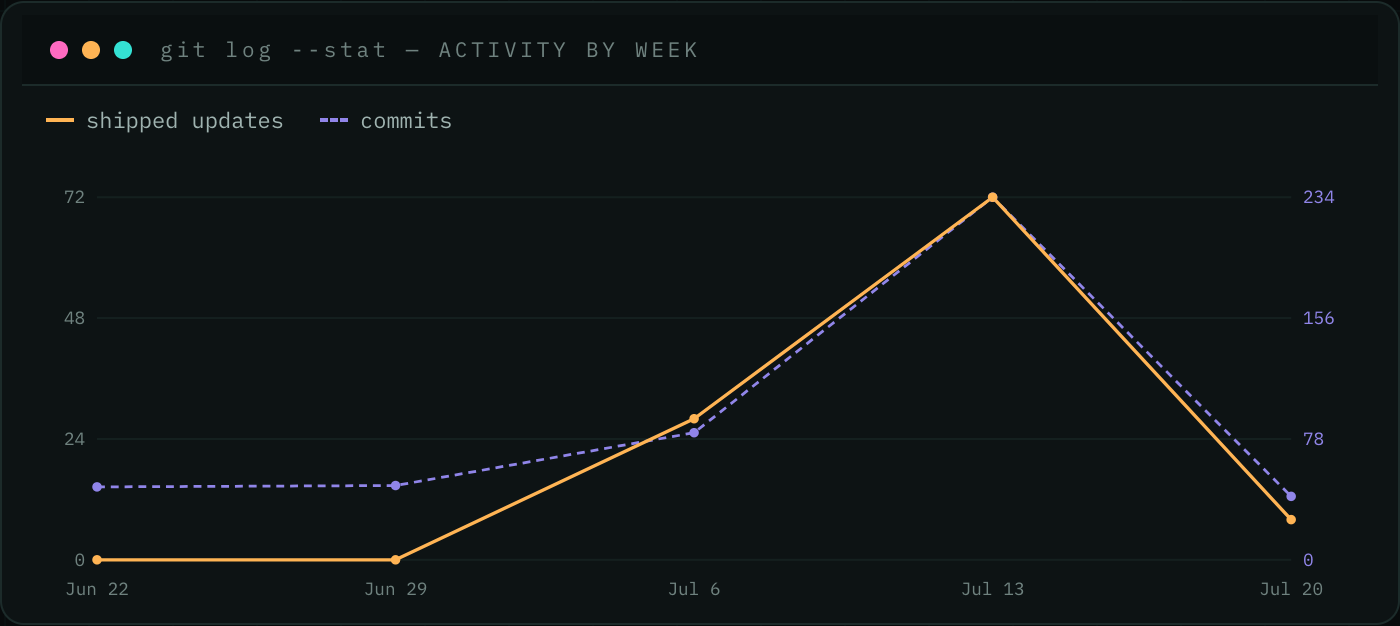
*
Jul 22, 2026
- We now track around 700 cyber tools and vendors, widening the newsletter's view of what's shipping across the market.
- Added 40 commercial products that publish release notes — including ZeroTier, Ory, Pomerium, Codacy, DeepSource, Panorays, Risk Ledger, CybelAngel, SecurityTrails, Bright Security and RunReveal — so their updates now flow into the newsletter and the Tools page.
- Added open-source tools including mitmproxy and the MITRE ATT&CK dataset, plus tcpreplay, jwt-hack, dockerscan and Frida.
*
Jul 21, 2026
- Screenshots and demo GIFs in newsletter entries now load reliably — some previously showed as broken image placeholders.
- See at a glance where each newsletter update came from: every entry now carries clickable NOTES / BLOG / CHANGELOG / CODE / DOCS pills that link straight to the original source.
- Newsletter links now open in a new tab so you keep your place in the issue, and the “sources” tooltip stays open long enough to click through.
*
Jul 20, 2026
-
Share any tracked tool as an image — open a tool on the Tools page and download a clean card with its GitHub stars, release count, and a 12-month release-cadence chart, one click from the ▽ share button.
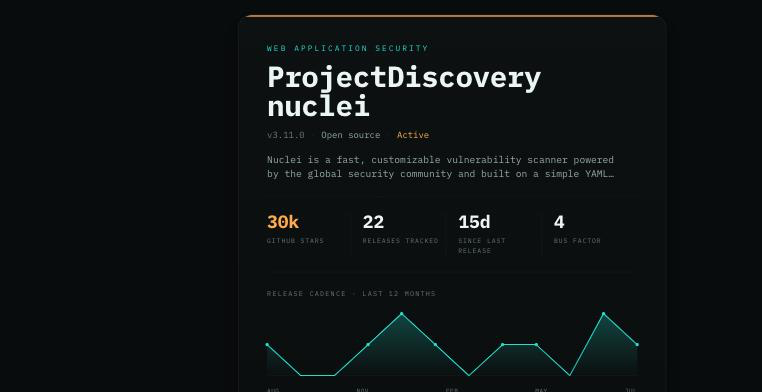
- Share the week's highlights too — on any This Week's Highlights issue and on the home page, download a ready-to-post image of the week's picks: square for a feed post or portrait for a story.
*
Jul 19, 2026
-
New Analytics chart — SaaS platform reliability: see which commercial security platforms (and their specific products) go down the most, built from each vendor's own public status page. Rank the last 90 days by downtime, incident count, or uptime %, and drill from a platform to the individual product.
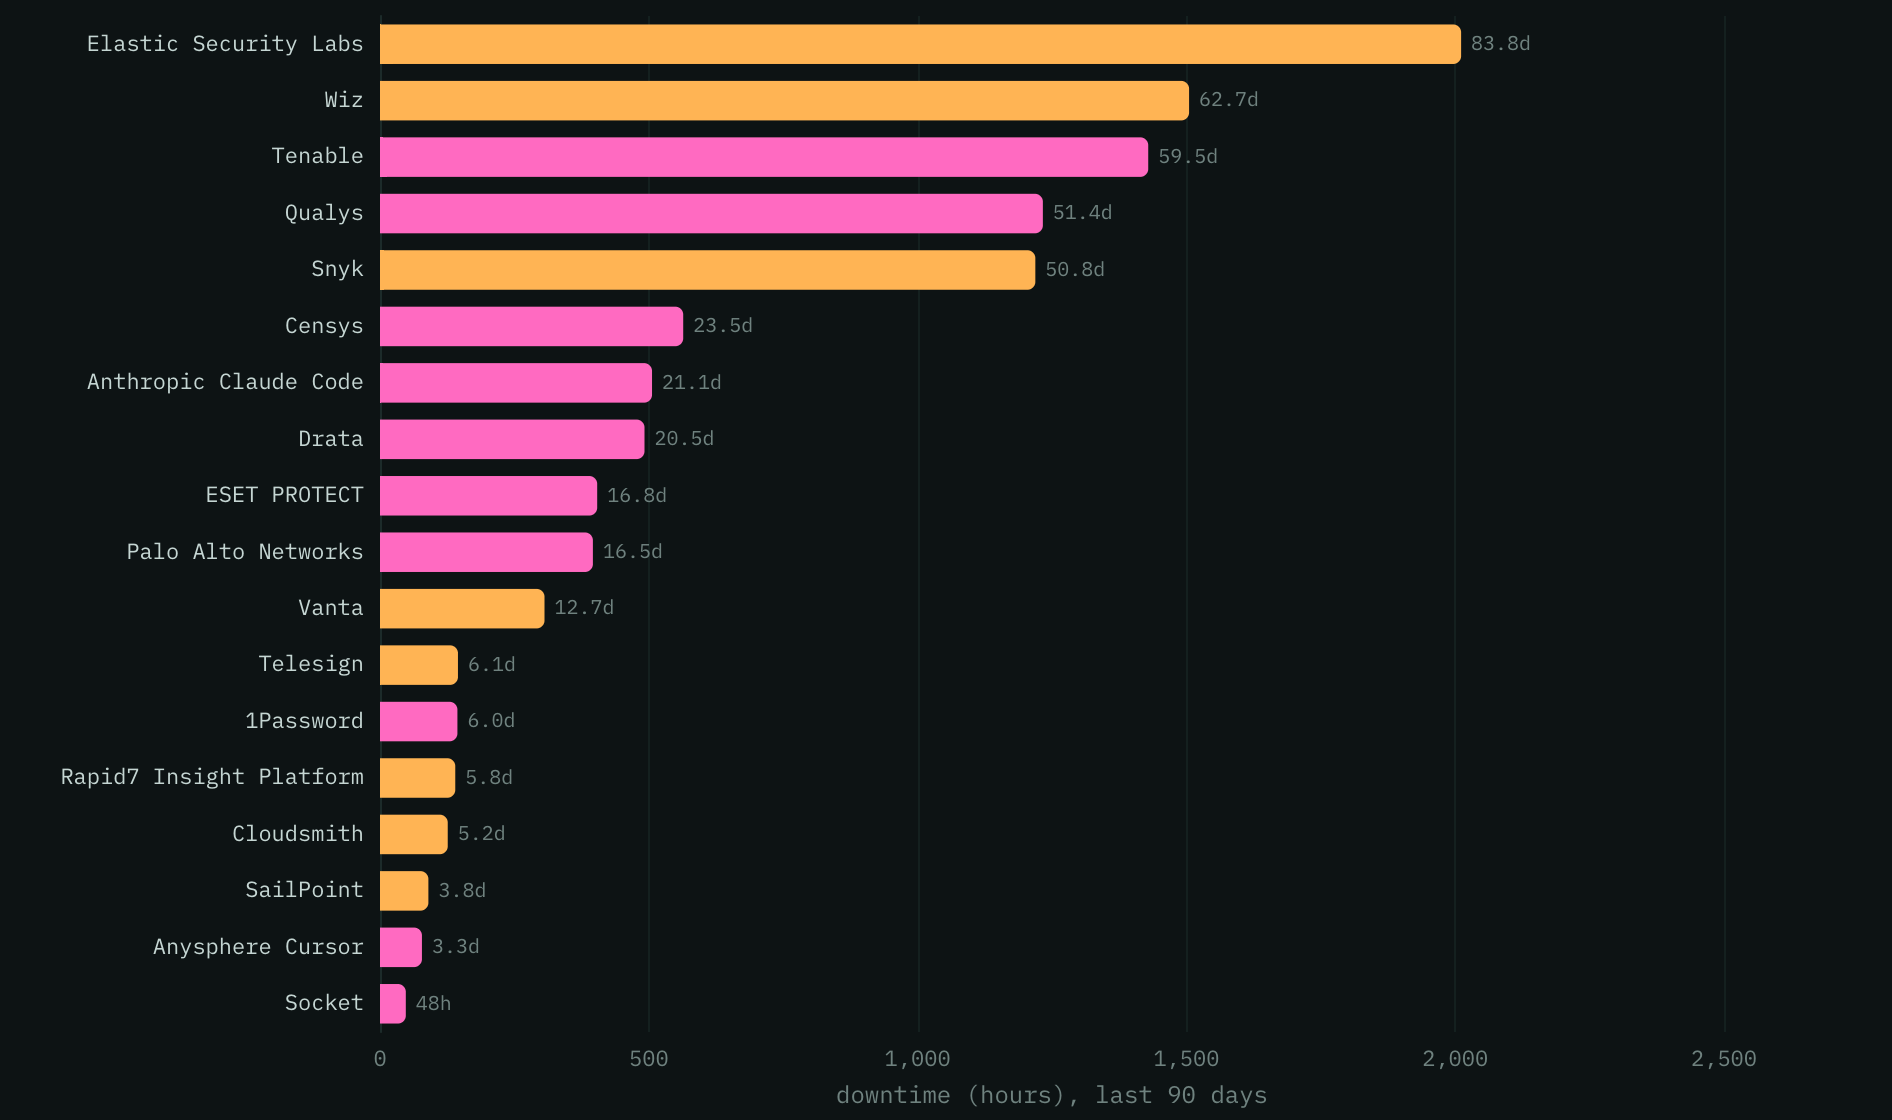
- Analytics charts are now interactive: click a tool name to open its full profile right on the page, or click a category to jump to the Tools page filtered to it.
- The Tools page has two new sortable columns — Activity (a sparkline of each tool's recent commit history) and Popularity (GitHub stars) — so you can rank the whole watchlist by what's most actively developed or most popular.
- Tool profiles now list each tool's API and MCP server surfaces alongside its other data sources, and Trivy's and Semgrep's MCP tool sets are now tracked and browsable.
- Filter the Tools watchlist by clicking any column heading — name, category, license, source, or status — and your filtered view now saves to the page URL, so you can bookmark or share it and it survives a reload.
- The Tools license filter now separates open-source, commercial, and unclassified tools instead of folding the unknowns in with commercial.
- The Tools page now works on mobile.
- Analytics charts are now screen-reader accessible, and show a clear message instead of a blank space if a chart can't load.
*
Jul 18, 2026
-
See which other tools share the same maintainers — open any tool's detail card and expand Connections for a map of the projects whose contributors overlap with it, with thicker links meaning more shared people. Project-level only; no individuals are named.
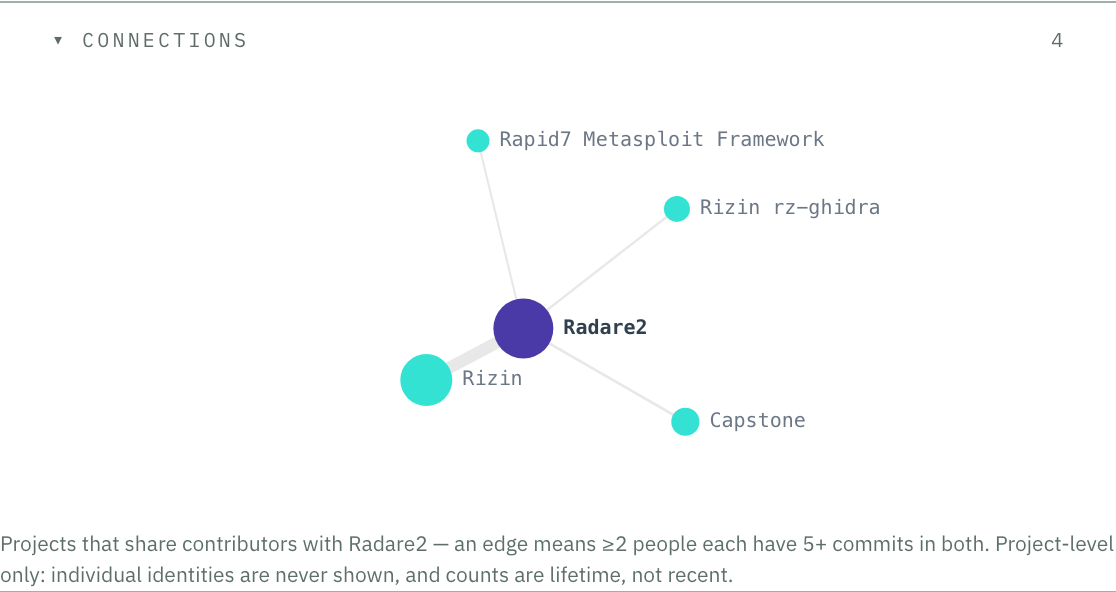
-
Compare how long a tool has been in development against its peers — the new Lifespan section in each tool's detail card charts its start-to-latest-activity span next to others in the same category, so you can see at a glance what's a veteran, what's new, and what's gone quiet.
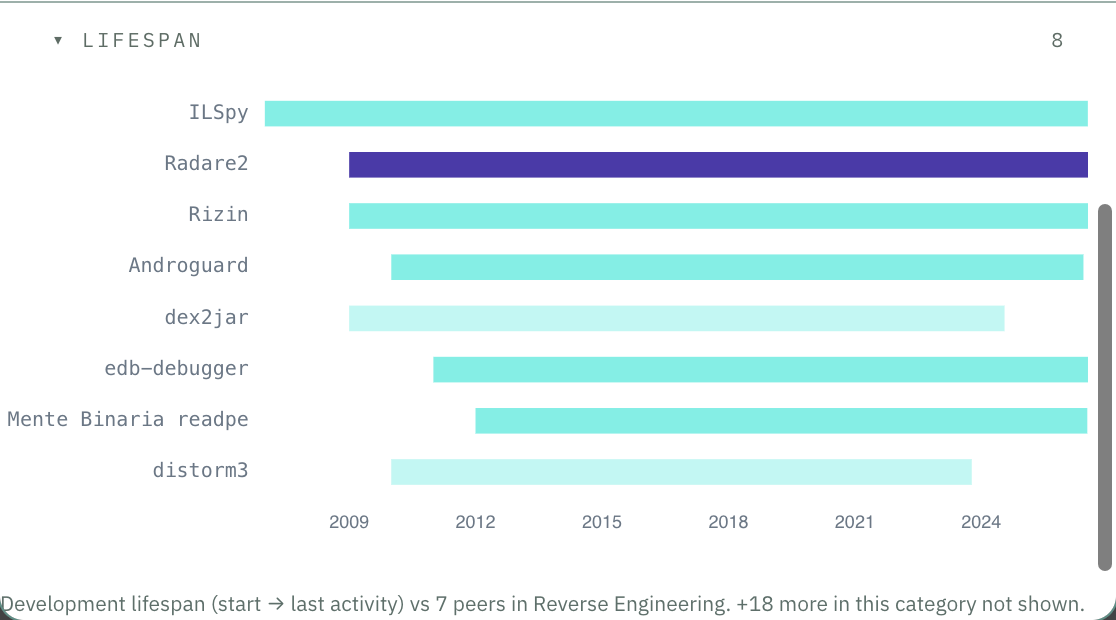
-
See the APIs each tool exposes — open any tool's detail card and click APIs to browse its live endpoint catalog (grouped by path, with method badges). When a tool adds or removes API endpoints, that shows up as its own item in the daily newsletter, with removals flagged as breaking.
- The tools table now has API and MCP columns: a check shows whether a tool exposes an HTTP API or ships an MCP server and links straight to its docs; a highlighted check means we track that surface and diff it over time, linking to the tool's catalog. Filter or sort either column — e.g. show only tools with a tracked API.
- AI-security tools now have their own categories in the tools filter — AI/LLM Security (guardrails, LLM/agent scanners, red-teaming) and AI-Powered Offensive Security (autonomous pentest/exploitation agents) — so you can slice the watchlist to just the AI-security space.
- The site now opens in light theme for first-time visitors; your saved preference — light or dark — is always respected.
*
Jul 17, 2026
-
Tool cards now mine each tool's README for a description and runnable command examples — filling hundreds of cards that were blank because the tool has no repo blurb or never shipped a release with examples. 285 tools gained example commands and 440 gained descriptions or examples in all; commands taken from the README are tagged ‘from README’, and curated or release-note examples still take precedence.
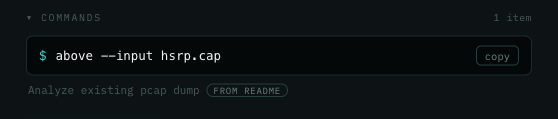
-
Tool cards now show a Project Start year for far more tools — resolved from the strongest signal we hold (repo creation, first commit, a curated launch year, or the earliest changelog / release / doc we've recorded), and hovering the year tells you which. The information panel's ‘Source’ is now labeled ‘Primary Source’ to set it apart from the tool's Data Sources list.
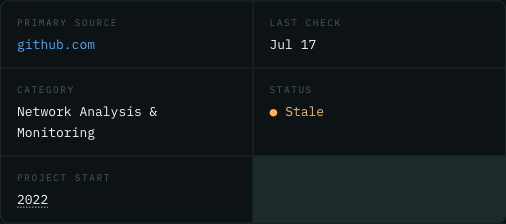
-
New Analytics chart — Features vs defects by category: where each kind of cyber tooling spends its effort, new capability (feat:) vs firefighting (fix:), from a year of commit history. Cloud, runtime and cloud-security tools are the most feature-driven; endpoint, threat-intel and reverse-engineering skew heavily toward fixes. Each row shows how much of its history was classifiable, and low-confidence categories are greyed.
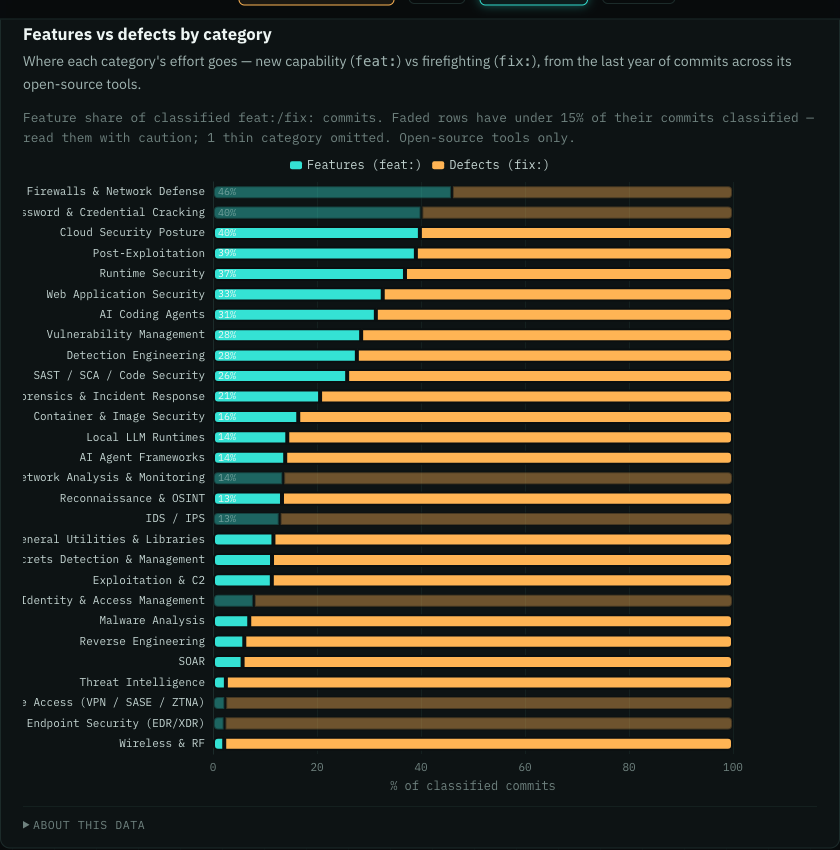
-
This Week's Highlights now leads each pick with its most valuable release — a brand-new product launch ahead of new features, ahead of routine updates — instead of whatever simply shipped most recently. Every release is labeled NEW TOOL, NEW FEATURE, or NOTABLE UPDATE so you can tell at a glance what kind of update it is.
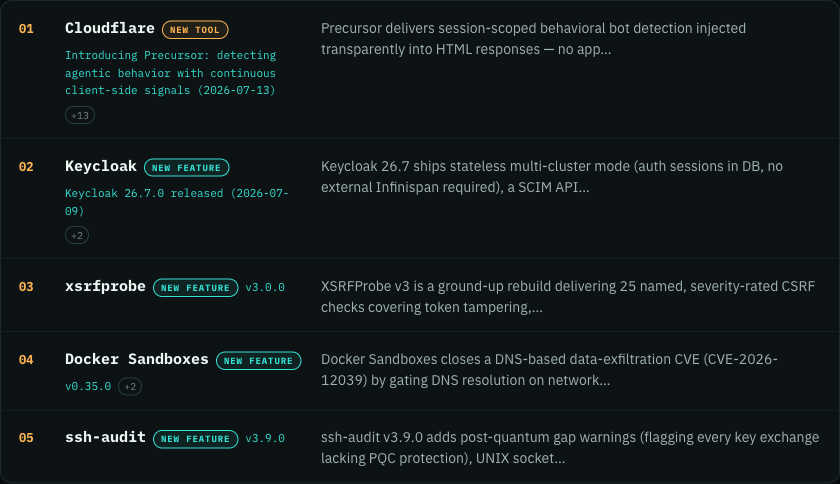
- New Analytics chart — Development lifespan by category: how long tools stay in active development, open-source vs commercial (open-source tools average ~7 years, commercial ~12). Each tool's detail card now also shows its project start year and maintenance status.
- Maintenance status on the Tools page is now accurate for the whole watchlist — hundreds of actively-developed tools that read “unknown” (Nmap, Metasploit, Suricata, and more) now correctly show active / maintained / stale based on real commit activity, not just the tools that recently shipped a release.
- Added Capital One VulnHunter — an agentic AI tool that runs attacker-first vulnerability analysis on source code — to the watchlist.
*
Jul 16, 2026
-
Product Docs Weekly now leads each update with a clean summary and an expandable list of exactly what changed — open any change to read the new documentation right in place.
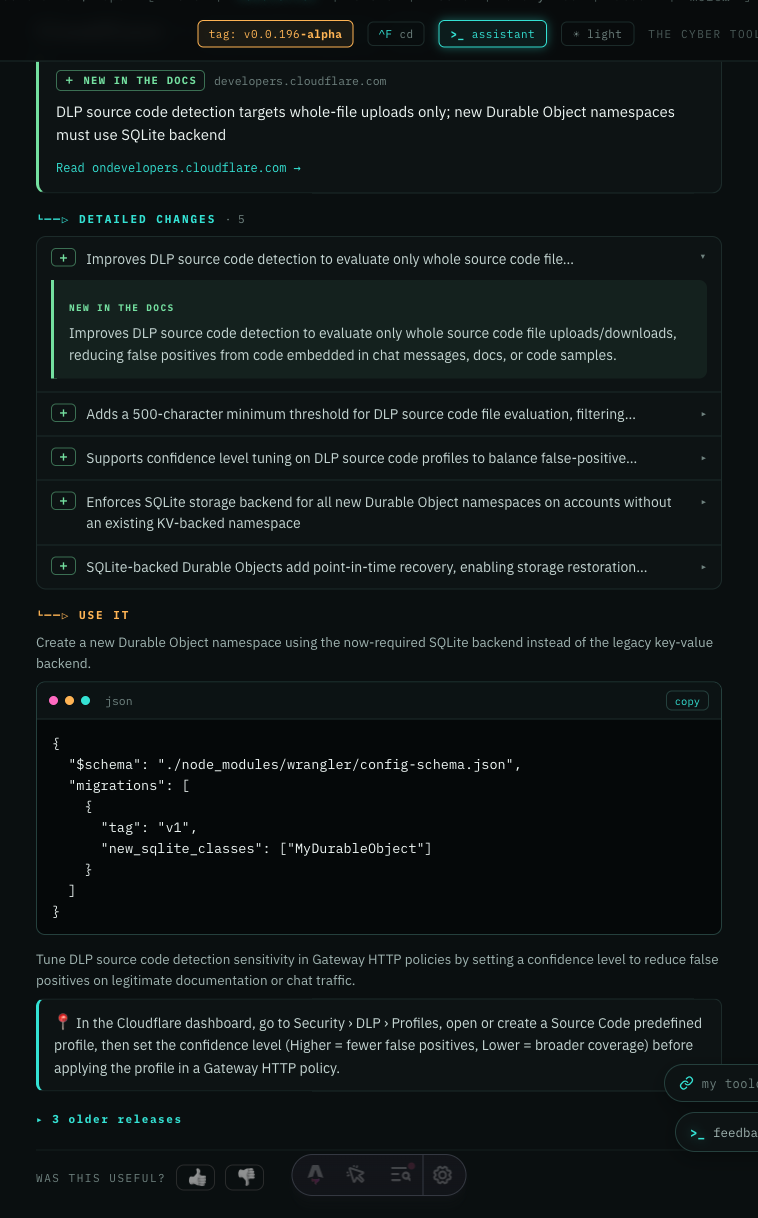
- We now track each product's full documentation tree, not just its front page — so newly-published pages and deeper feature-page changes surface in the weekly too.
- Added 24 open-source tools to the watchlist — spanning digital forensics (Fox-IT Dissect, Google GRR, DFIR ORC), detection engineering (Elastic & Splunk content), IaC & app security (Bridgecrew Checkov, Checkmarx KICS), offensive security (pwntools, BeEF, Mythic, Commix), and network defense (OpenSnitch, RITA, testssl.sh). Find them on the Tools page — new releases from each will start flowing into the newsletter.
*
Jul 15, 2026
- Tools now show the vendor behind them — Aqua Security Trivy, Rapid7 Metasploit Framework, NVIDIA NemoClaw — across the newsletter, the Tools page, and the Analytics charts, so you can tell at a glance who ships what. Search still matches either the vendor or the product name.
- New Feeds page — subscribe by RSS or OPML to the full newsletter, a single series (releases, highlights, or product docs), any tool category, or every tool we track. Open it from search (⌘K → "feeds").
- Every tool now has a copyable RSS feed link, in the tools table and in each tool's detail view, so you can follow just the tools you run.
- The My Toolchain and feedback buttons now give an occasional gentle nudge, so they're easier to spot. It settles down the moment you use them — and stays still if you prefer reduced motion.
*
Jul 14, 2026
-
Open any tool on the Tools page and you'll find more runnable example commands. On top of the ones we curate by hand, every open-source tool now shows real commands pulled straight from its own release notes — around 90 tools now have a copyable Commands section, and it grows automatically as new releases ship.
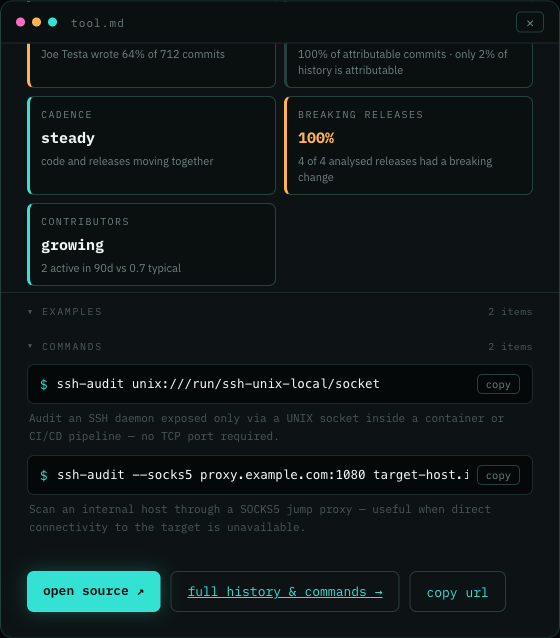
- The Tools page is rebuilt around its columns. Click any heading to filter by it — click TOOL and type "rapid7" to see only Rapid7's products, click CATEGORY and pick from the list, click LICENSE for open-source or commercial. Filters combine and show as chips you can click away, and the arrows beside each heading sort. Six controls above the table are gone. New: a "newest release" column telling you when each tool last shipped.
- The copy-link button now actually copies. It was reporting "copied" whether or not anything reached your clipboard.
- Tool cards scroll again — they'd grown taller than the window, putting the bottom out of reach.
- Paste your install list straight into the My Toolchain panel to detect the tools you run — no more bouncing to another page. It also finds tools it previously couldn't, like Semgrep.
- Releases with long feature lists now collapse after five items, so one busy release can't bury the rest of the issue.
- Product Docs Weekly moves to Wednesdays, and reads product documentation only — changelogs belong to the daily issue, which now also reads them when a release ships with empty notes.
- Charts on the Analytics page no longer cut off their own labels. Category names like "vulnerability-management" were being clipped to "ulnerability-management", axis titles were sliced by the edge of the canvas, and the contributor map's legend was buried under the graph. All four affected charts now fit their content.
-
New on Analytics: the contributor map — the cyber toolchain drawn by its people rather than its code. Two tools are linked when they share the maintainers who build them, and the clusters are real: Capstone sits underneath both Radare2 and Rizin (which share 227 contributors — Rizin is a fork, and the bench never split), the ProjectDiscovery suite clusters together, Metasploit is a hub. A shared maintainer is not a dependency, but it does show you which projects would wobble together. We know exactly who these people are and have chosen not to name them: the map shows tools, never individuals.
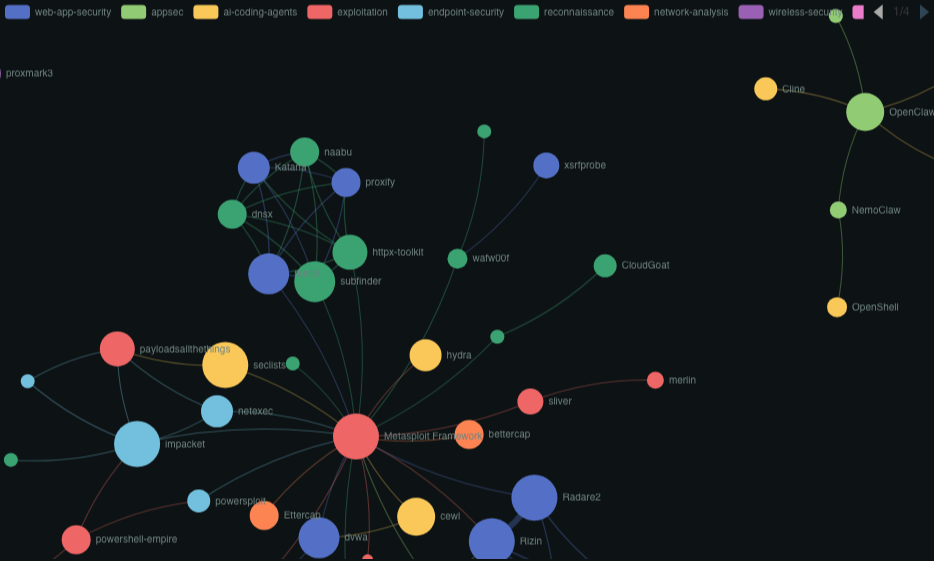
-
Every tool now shows seven derived signals — who actually builds it, who funds it, and whether it's safe to adopt. Open any tool for its bus factor (sudo: one person wrote 98% of 15,070 commits), its top contributor org by commit-email domain (Falco: Sysdig), whether it's building or coasting, how often its releases break you, whether it documents before or after shipping, whether its contributor base is growing, and its mix of new features vs firefighting. Every number states the evidence it rests on — and where the evidence is too thin, we say nothing rather than guess.
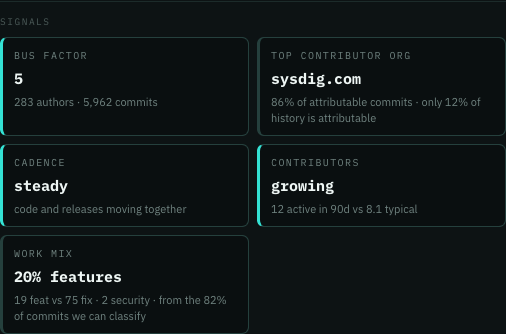
- Upgrade digests now reach back two years instead of five months. We summarized 3,916 historical releases, so pinning an older version actually works: pin Cline at v3.82.0 and it tells you you're 40 releases behind with 5 breaking changes — where before it would simply have said it had no record that far back.
-
My Toolchain now shows what shipped for your tools, not just how many. Expand the panel to read the releases themselves — version, how long ago, and an amber warning when an upgrade would break you. Each one links straight to the release.
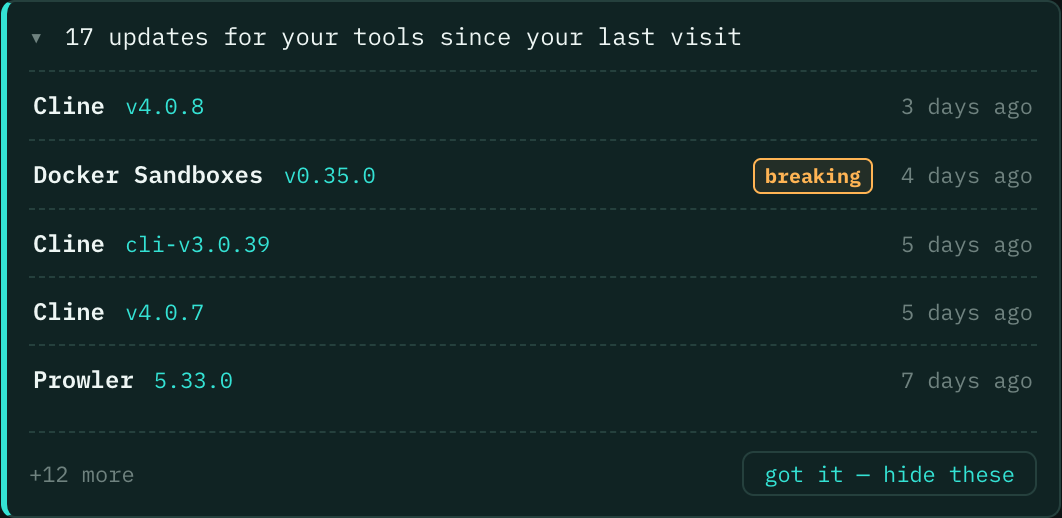
-
Every tool now shows its whole tracked life. The Tools page gains a "tracked" column — the first signal we ever saw through to the most recent — and clicking a tool charts three streams of activity across that span: release notes, changelog entries, and code commits. Falco, for instance, runs from Jan 2016 to today. GitHub only reports the last 52 weeks of commit activity, so the code line is drawn as a gap before that window rather than a flat zero.
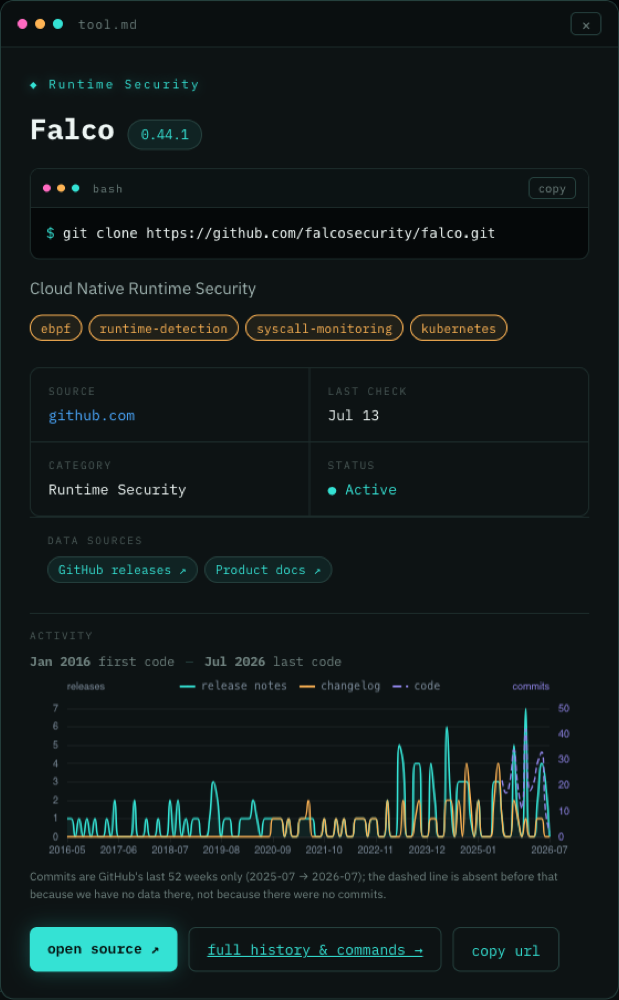
-
The commercial-vendor note under the shipping-velocity chart no longer runs on for 259 vendors. It now leads with the caveat that matters — vendors publish no uniform release feed, so their shipping is tracked as a docs-change proxy — with the vendor roster tucked behind a disclosure.

- Releases across the archive now show what breaks when you upgrade. We re-analysed every release note we hold: 58 releases carry a breaking change — Cisco Duo dropping Ubuntu LTS support, DigiCert changing certificate validity settings, nuclei requiring signed templates. Where we haven't checked a release, the upgrade digest says so rather than implying an all-clear.
- You can only dismiss the My Toolchain update list once you've opened it — no more clearing updates you were never shown.
- Releases we never analysed for breaking changes are now labelled "not checked" in that list, so a clean-looking release really is one we checked.
- Haven't used the My Toolchain panel before? It now shows the last 30 days rather than everything we've ever published for your tools.
*
Jul 13, 2026
-
Pin the version of a tool you actually run, and the site tells you exactly what you'd gain by upgrading — and what would break. Star a tool, pin your version in the My Toolchain panel, and every release since then is rolled into one answer.
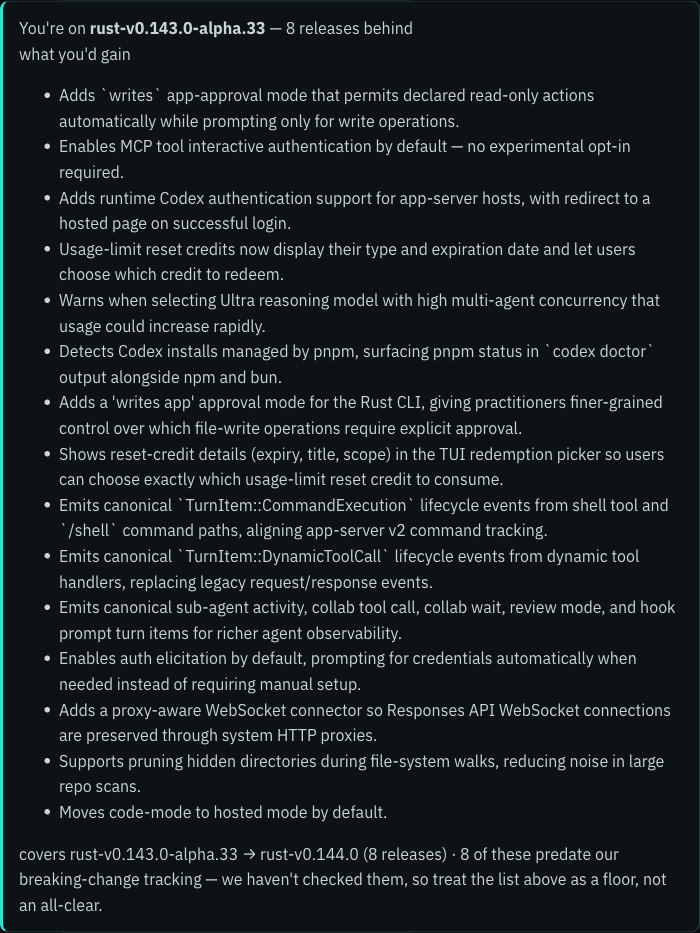
-
New on Analytics: which categories are speeding up or slowing down, and which tools have gone quiet against their own release rhythm — measured per tool, so an annual release cycle isn't mistaken for silence.
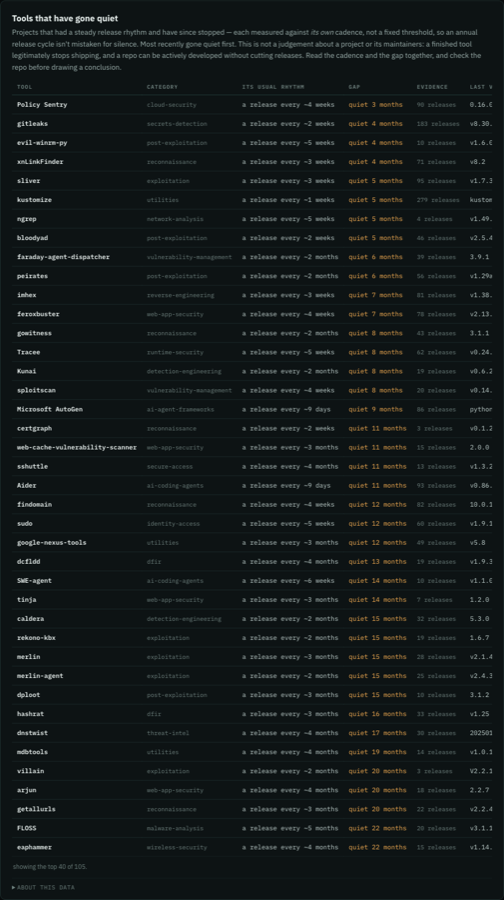
- Releases now call out breaking changes separately from features, so what an upgrade will cost you is no longer buried in a list of what it gives you.
- Follow just the tools you run: every tool now has its own RSS feed, and the My Toolchain panel exports your whole set as an OPML file any feed reader can import.
- "My feed" has moved into the My Toolchain panel — the same view of what's new for your tools, with one less item in the menu.
-
Every tool page now shows its license and its full category name — open-source tools were previously missing the license tag entirely, and categories showed as raw codes like "DFIR".
-
The Shows page now says plainly that the first episode is still in production, instead of listing placeholder episodes that were never real.
- A tool's detail popup on the Tools page now shows its real maintenance status — it previously said "active" for every tool, even stale ones.
- Tools we recently renamed (Cloudflare, Snyk, Wiz, CrowdStrike and 29 others) show their full release history again, and each now appears once in the table instead of twice.
- The release-notes quality bars now add up to the score they're labelled with, so the best and worst rankings read correctly. Each tool is scored on its median note — a real note, so depth, examples and transparency always sum to the total.
- RSS: the weekly Highlights issues now link to their own issue instead of colliding with Issue 001.
- Corrected across the site: there are three newsletters (not two), the main one is daily (not weekly), and the FAQ now describes what "active", "maintained" and "stale" actually measure.
-
Filter the best and worst release-notes charts on the home page by category and by open-source vs commercial — narrow to SIEM, EDR or any other category and see who actually documents what they ship.
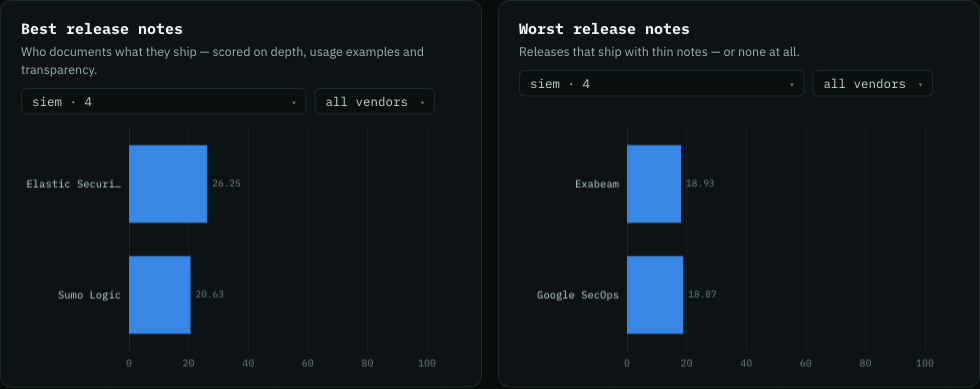
-
New on Analytics: which tools write the best release notes — and the worst. Every release note is scored on depth, worked usage examples, and transparency (breaking changes, advisories); a tool ranks on the median of its recent notes.
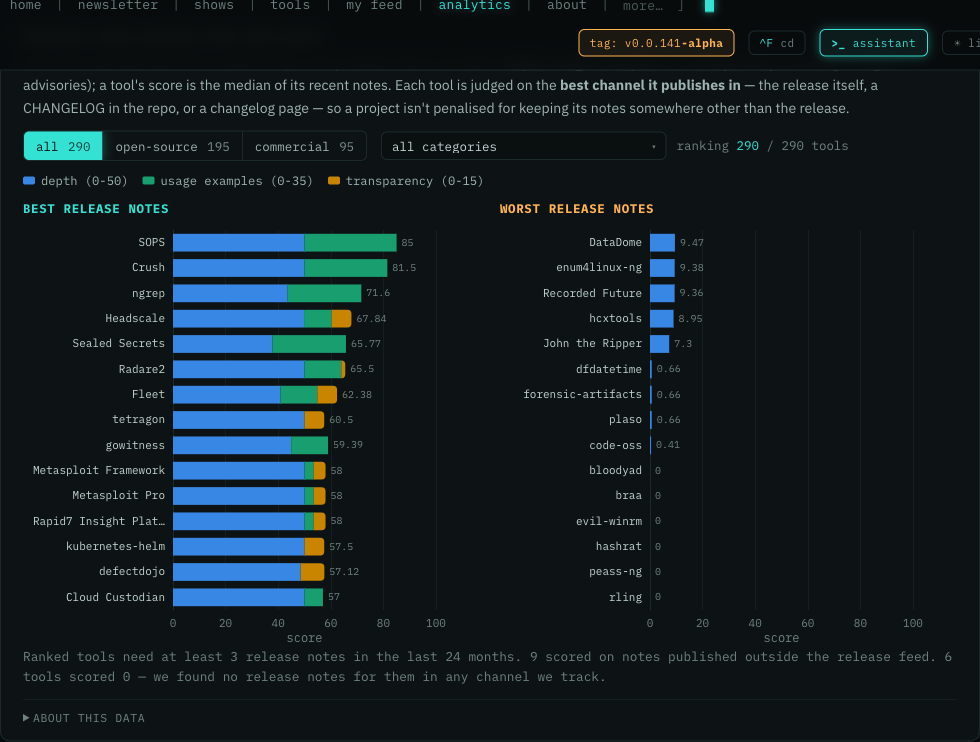
- Tools are judged on the best channel they document releases in — the release itself, a CHANGELOG in the repo, or a changelog page — so a project isn't penalised for keeping its notes somewhere other than the release.
- Tool names now read as products, not feeds: "Acunetix 360 On-Demand Changelog" is simply "Acunetix 360".
- Now tracking Metasploit Pro alongside the open-source Framework.
- Sort the tools list — by name, by most recently updated, or by newest release.
-
My Toolchain: save the cyber tools you actually run, and the site starts working for you. Add them by search, by ★ on the tools page, or by pasting your install list — then see only what shipped for your tools in my feed, and narrow any issue to them. Open it from the chainlink button in the corner of any page.
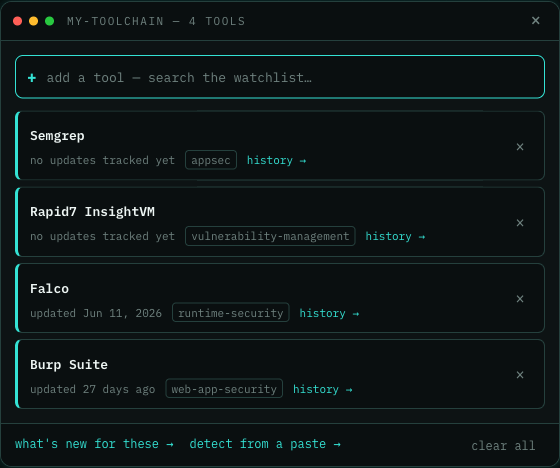
- Search by product or by vendor, anywhere on the site. "Cortex XDR" finds the product; "Palo Alto" finds all eight of them. Individual products — Rapid7 InsightVM, Wiz Defend, Zscaler Internet Access — are now tools you can follow in their own right, each with its own update history.
-
Filter the newsletter by open-source or commercial and get the real split — the commercial filter was showing an empty list even though most tools in an issue are commercial. Issue 014 now reads 23 open-source, 81 commercial.

-
New: This Week's Highlights — a weekly issue picking the best tooling updates that shipped, judged on how deep the capability is and how different it is from everything else that week. Each pick argues its case, and you can tell us whether we got it right.
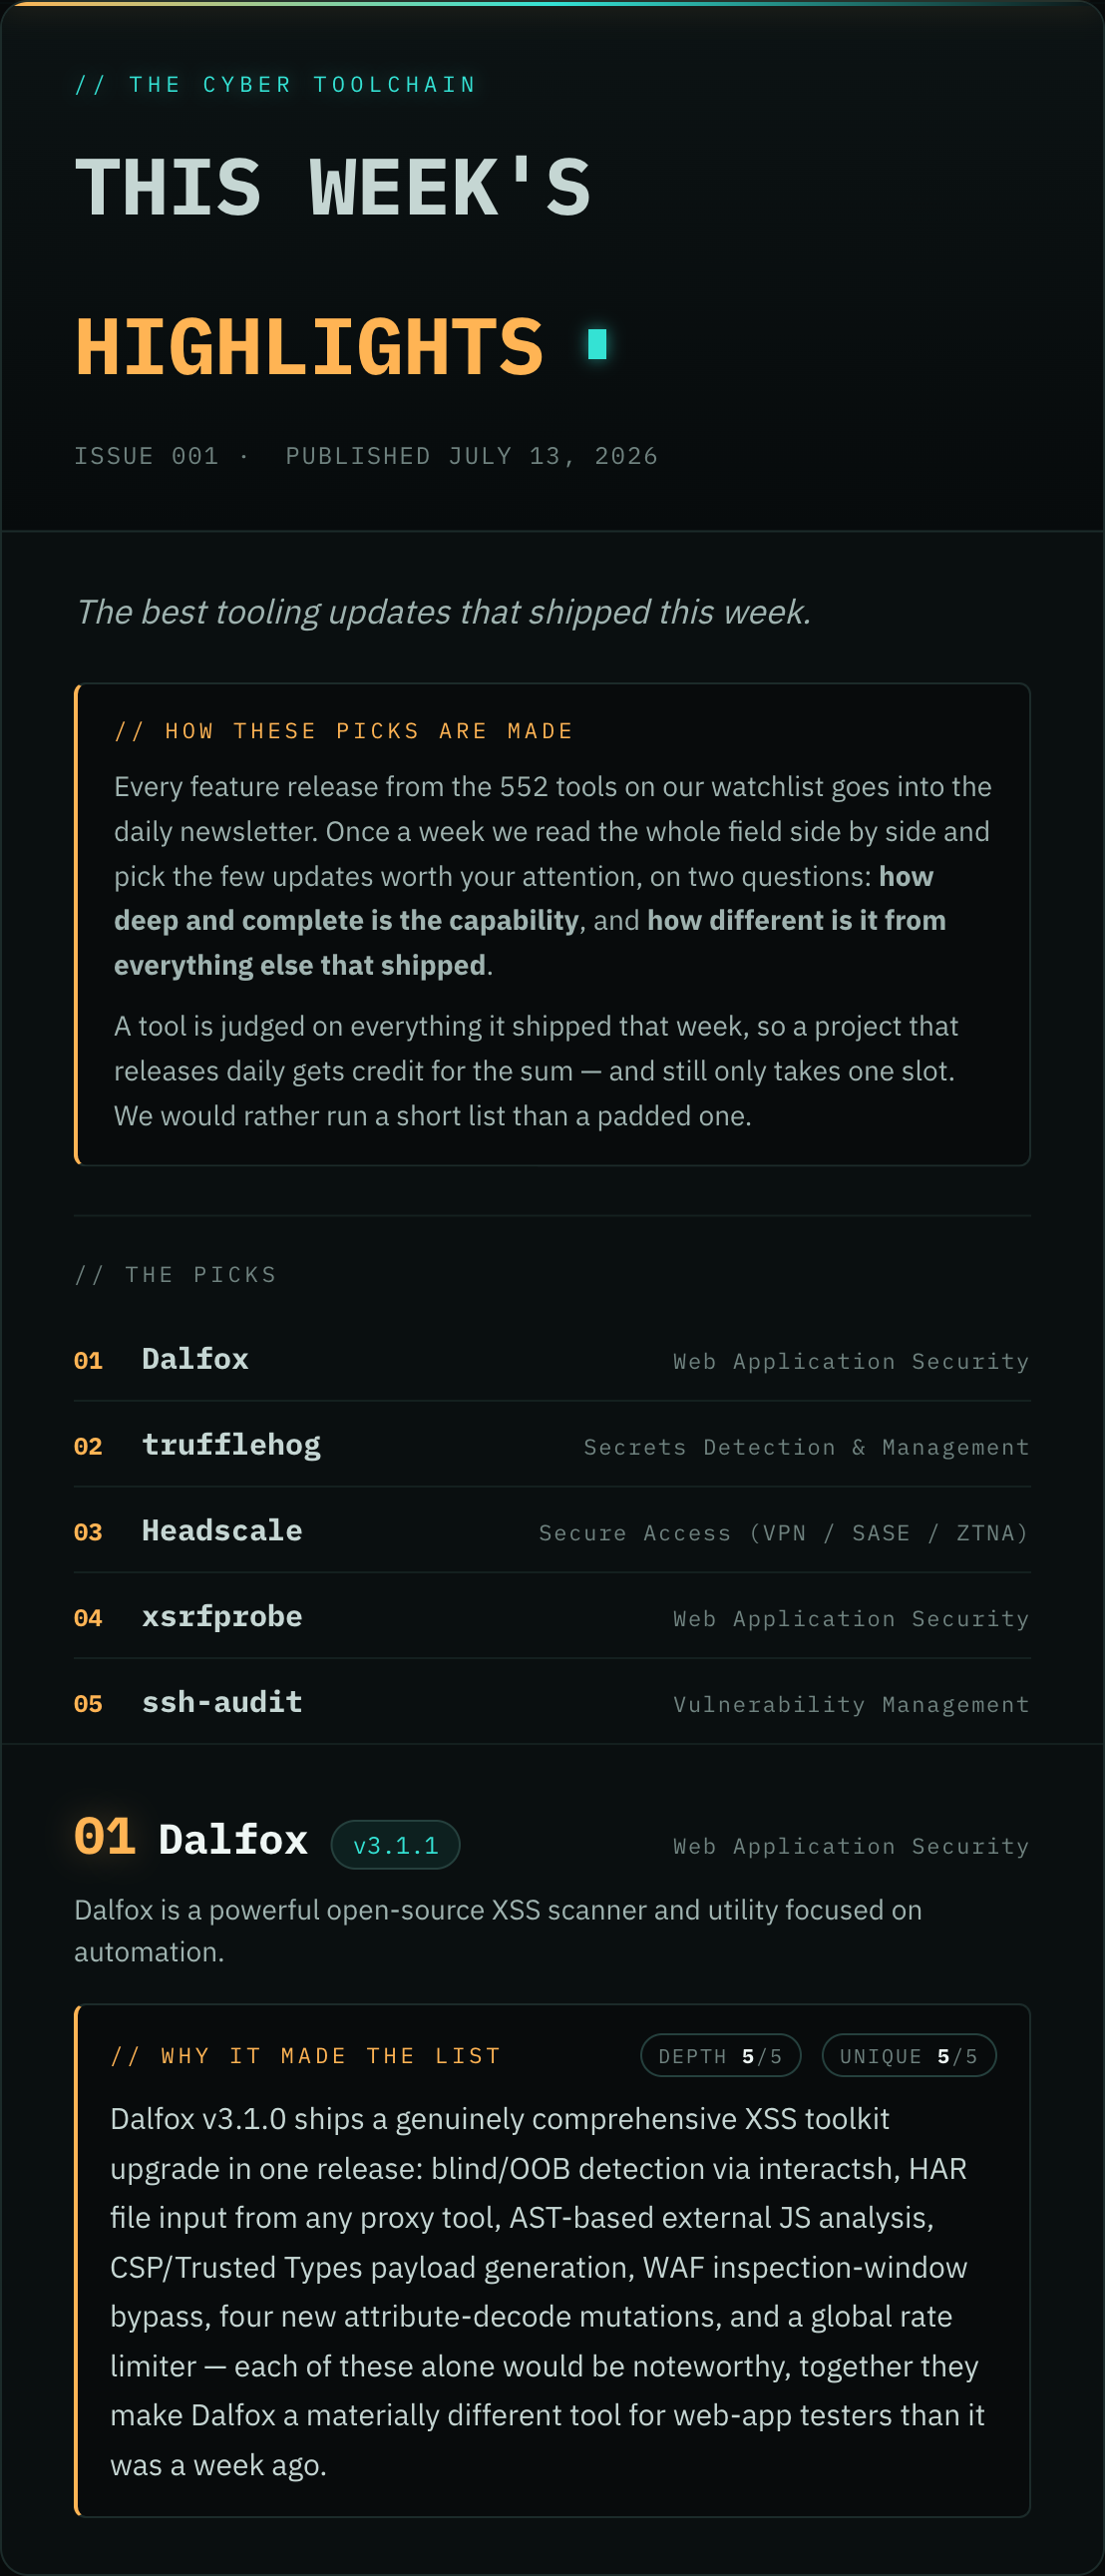
- The home page now leads with the week's five highlights, so you can see what shipped without opening the issue.
- Tool descriptions and release summaries no longer carry emoji decoration pulled in from GitHub.
- The FAQ now explains all three newsletters — Daily Releases, This Week's Highlights, and Product Docs Weekly — plus how the tools watchlist, my toolchain, and the feeds work.
- New "How it's made" section in the FAQ: where the entries come from, what role AI plays in writing them, and why you never see bug fixes in an issue.
*
Jul 12, 2026
-
Pick your terminal's color — click the ◐ icon in the hero terminal's titlebar to swap between Cyber, Amber, Matrix, and Dracula palettes. Your choice is remembered and applies everywhere a terminal appears: the homepage, the tools page, and every newsletter entry.
- Big visual updates to the site now come with a screenshot right here in the changelog, so you can see exactly what changed instead of just reading about it.
- Each newsletter now opens with a short note on how the issue was made. The standard issue is built from release notes on GitHub and GitLab, vendor release pages, project blogs and feeds, and the source code behind the tag — with bug-fix-only releases dropped. Product Docs Weekly is built by diffing product documentation and changelogs week over week, where features often land without any announcement. You can see where the entries came from before you read them.
- Moving between issues now works the way you'd expect: ‹ steps back to the previous issue, › only becomes clickable when there's a newer one, and neither will drop you into the other newsletter mid-series. The issue picker groups the standard newsletter and Product Docs Weekly separately, so two issues both numbered 001 are no longer mistaken for each other.
- The analytics charts are easier to read. Picking a category or theme is now a dropdown instead of a legend you had to page through with arrows — all 28 categories are reachable, and the color key wraps below the control instead of sitting on top of the chart's axis labels. The shipping velocity leaderboard also gained a "top 10" view.
- Every page now has a feedback button in the bottom-right corner — tell us what's broken, what's missing, or which tool we should be watching. It drops you straight into a chat with the assistant, ready for your message, and you can dismiss it with the × if you'd rather not see it. There's also a 'send feedback' link in the footer.
- The home page leads with a clearer promise: we track what's new in cyber tooling so you don't have to. The hero now spells out exactly what you get — the new features from every cyber tool we watch, bug fixes stripped out, each with the command to run it.
- Clearer, more consistent wording across the site: the home page now leads with "Keeping up with what's new in cyber tooling — so you don't have to," and we say "cyber tools" everywhere — hero, newsletter, archive, and the feeds — instead of switching between phrasings. The hero headline is also slightly smaller so the promise reads as one clean line.
- The tools page now filters by license. An open-source / commercial / all toggle sits alongside the activity filter, so you can narrow the watchlist to just the open-source projects or just the commercial products — matching the filter the newsletter already had. It combines with the category, activity, and name filters, and the filtered view is shareable: the license shows up in the URL.
- Click a tool on the Tools page and you now see the tool, not a dash. The popup leads with the command to clone it — one click to copy — plus a screenshot of the tool pulled from its latest release notes when we have one. Its capability tags now stand out as amber pills, and commercial products correctly say "visit website" instead of "open source".
- Tools with a tracked release history now show a ◷ icon in the table that jumps straight to that tool's release timeline and commands. Tools we're only watching, with no releases yet, no longer offer a history link that led to a dead page.
*
Jul 11, 2026
- The home page now leads with live analytics — a shipping-velocity leaderboard and a feature-themes chart from release notes, right below the hero. Click either chart (or its heading) to open the full, filterable version on the analytics page.
*
Jul 10, 2026
- New analytics page — see who ships fastest, where release activity is trending by category, what release notes talk about, and how actively maintained each corner of the toolchain is, built from the full GitHub release history (20,000+ releases) of every tool we monitor.
- Filter the shipping-velocity leaderboard by category and by open-source vs commercial to compare the tools you care about.
- Every analytics chart includes an 'about this data' panel documenting sources, sample sizes, and caveats — so you know exactly what you're looking at.
- Category filters on the Tools and Newsletter pages are now grouped by domain — Offensive, Cloud & Container, Detection & Response, Governance/Risk/Compliance, and more — with clear full-name labels, so you can jump to the area you care about faster.
- The newsletter is now organized into two-level domain → category sections so related tools sit together and each issue is easier to scan; the Tools page adds an optional 'group by domain' view.
- Every tool now shows capability tags (e.g. kerberos, ebpf, soc2) on its card, so you can tell at a glance what it does.
- We're tracking more of the stack: GRC & compliance-automation tools (Vanta, Drata, Sprinto, Cypago, SecurityScorecard, and more), Docker tooling (Compose, Sandboxes, CLI), and the Pi coding agent.
*
Jul 8, 2026
- New changelog page — every site update is now documented here so you can see what changed and when.
- An alpha tag now sits in the top bar: the site is early and evolving fast, and clicking the tag brings you to this page.
- The homepage terminal now shows a … when the week shipped more tool releases than fit in the widget.
- The Watch-the-show button now says what it is: coming soon.
- Contact email updated — reach us at jon@jonschipp.com for questions, press, and partnerships.
- You can now see the full size of our watchlist — 391 tools monitored — right on the home page and the tools page.
- Vendor updates are now split by product. A single company’s release notes (Rapid7, Tenable, CrowdStrike, Microsoft…) now appear as separate entries under each product’s market category — e.g. Rapid7 InsightVM under Vulnerability Management and InsightCloudSec under CNAPP — instead of one lumped entry.
- Every entry now shows its sources. Hover the ⓘ icon on any update to see where it came from — source code, release notes, product docs, or a vendor blog.
- More vendors on the watchlist: added Tenable, Zscaler, Palo Alto Networks, Qualys, and Microsoft Sysinternals.