pwndbg is an open-source, MIT-licensed plug-in for GDB and LLDB that replaces the default command set with features aimed at exploit developers, reverse engineers, and hardware hackers who find vanilla debugger output unusable for that work. It runs as a Python module loaded into GDB, or as a REPL for LLDB, so it fits directly into an existing command-line debugging workflow rather than replacing it. Its README places it against past and present projects like gdbinit, PEDA, GEF, and bata24/GEF, arguing that those are hard to extend and shipped as unwieldy single files, whereas pwndbg aims for a cleaner, more maintainable implementation covering both userspace and Linux kernel debugging. With 364 contributors, 845 commits in the past year, and a release 22 days ago, it is under active development.
GDB and LLDB plug-in that enhances debugging for reverse-engineers and exploit developers with low-level utilities.
Where in memory does this exploit's payload land, and is the layout what I expect?
maps the process's memory regions and renders a hexdump or visualization of any range, collapsing repeated bytes so a pattern or overwrite stands out
Why did my program just die, and was it a memory-safety violation or something else?
surfaces a dedicated panel on stop showing the last signal the debuggee received, alongside registers and stack in one context view
What is the kernel doing with memory while I step through a driver or exploit?
traces allocator activity live, showing which task requested or freed a chunk, and lets me inspect page tables and file descriptors for a given kernel task
Can I pull real symbol and type information for a stripped or third-party binary I'm debugging?
fetches matching debug symbols automatically from a hosted server for common distributions when none are present locally
Does my target still work the same way after I patch a few instructions in it?
lets me write patches across multiple architectures directly in memory and inspect the resulting disassembly in place
102 capabilities
across 7 areas
· 4 backed by code, an API document or a real run
Built from pwndbg's releases, docs, README and our own runs.
“Seen” marks the month we first spotted a release the vendor didn't date.
Group names and tags are our labels.
pwndbg covers 1 of the 3 runtime security capabilities we track.
What pwndbg offers you
Command-line interface52
Python scripting support2
Scripting language support2
Scripting API1
Show
No capabilities match.
+Memory Inspection and Navigation5 capabilitiespwndbg gives users detailed visibility into how a process uses memory, from raw pointer dereferencing to virtual memory layout and WinDbg-style dumps. These capabilities form the core of day-to-day debugging and exploit development sessions.▸
+Telescope memory displayshippedRecursively follows and displays chains of pointers in memory so the user can see what a value ultimately points to.6 releases · 1 other source · first seen Sep 2016▸
release
Adds set telescope-pad-leading-zeroes on to zero-pad pointer-aligned integers to pointer width in telescope output.
2026.07.29 · Jul 2026
· source
· release history
Adds telescope --frame option to display stack frame information
2024.02.14 · Feb 2024
· source
· release history
Adds --reverse flag to telescope command to view memory before a provided address
2022.08.30 · Aug 2022
· source
· release history
Telescope command gains skip_count_label option to add a label showing the number of skipped lines
2021.06.22 · Jun 2021
· source
· release history
Telescope command gains min_repeating_values config to skip short runs of repeated values
2021.06.22 · Jun 2021
· source
· release history
Inspect memory locations preceding the current instruction pointer in telescope view$ telescope --reverse $pc
2022.08.30 · Aug 2022
· source
+Virtual memory map (vmmap)shippedShows all virtual memory regions for a running process along with their permissions and backing files.6 releases · first seen Jul 2018▸
Also counts toward: Command-line interface
release
Page table scanning now reads /proc/pid/mem by default for significantly faster vmmap operations.
2026.07.29 · Jul 2026
· source
· release history
Adds set vmmap-cache to persist vmmap across stops on macOS.
2026.07.29 · Jul 2026
· source
· release history
Improves embedded systems debugging with better vmmap detection and enhanced vmmap_add and vmmap_load commands.
2025.01.20 · Jan 2025
· source
· release history
Adds vmmap -C <N> <filter> to display N pages before and after a filtered vmmap entry.
2025.01.20 · Jan 2025
· source
· release history
Adds vmmap QEMU kernel support for x86/x64/risc-v by parsing memory info mem output
2019.12.09 · Dec 2019
· source
· release history
Add manual memory page manipulation via vmmap_add and vmmap_load commands for bare metal debugging.
2018.07.29 · Jul 2018
· source
· release history
+GDB print integrationshippedShows values in hexadecimal by default when using GDB's print command.4 releases · first seen Jul 2018▸
Also counts toward: Command-line interface
release
Extends regs to display SIMD registers (e.g. regs xmm0) and decode individual flags-register bits (e.g. regs eflags).
2026.10.22 · Oct 2026
· source
· release history
GDB's print command now displays values in hex by default.
2026.07.29 · Jul 2026
· source
· release history
Add $rebase(address) expression function allowing rebase logic in breakpoints and other expressions.
2018.07.29 · Jul 2018
· source
· release history
Add piebase command to rebase a given address for a specific executable.
2018.07.29 · Jul 2018
· source
· release history
+Memory mapping and protection (mmap/mprotect)shippedLets the user create or change memory mappings and their permissions directly from the debugger prompt.3 releases · first seen Jul 2020▸
Also counts toward: Command-line interface
release
Adds --quiet and --force flags to the mmap/mprotect commands.
2026.07.29 · Jul 2026
· source
· release history
Adds mmap ... and mprotect ... commands to invoke syscalls in the debugged program
2024.02.14 · Feb 2024
· source
· release history
+WinDbg-style memory display commandsshippedDisplays memory contents in WinDbg-compatible formats, making it easier for users familiar with that environment.1 release · first seen Jul 2026▸
release
Adds an optional count/length parameter to the windbg-style dds/dps/dqs/kd commands.
2026.07.29 · Jul 2026
· source
· release history
+Heap Analysis6 capabilitiespwndbg supports deep inspection of heap allocator internals across multiple libc implementations, covering both user-space and kernel allocators. This lets users trace allocation behaviour, spot corruption, and understand heap layout during exploitation research.▸
+glibc heap inspectionshippedWalks and displays glibc heap structures including chunks, tcache bins, and fastbins so the user can understand current heap state.8 releases · 1 other source · first seen Feb 2017▸
Also counts toward: Command-line interface
release
8 total
The resolve-heap-via-heuristic configuration key is deprecated and has no effect — pwndbg now always tries symbols first and then heuristics regardless of this setting.
2026.10.22 · Oct 2026
· source
· release history
glibc 2.43 heap support and tcache large chunks since glibc 2.42
2026.07.29 · Jul 2026
· source
· release history
Adds heap --count <N> and address range limits (heap <start> <end>) to walk only a requested portion of the heap.
2026.07.29 · Jul 2026
· source
· release history
Adds glibc 2.43 heap inspection support, including tcache large chunks since glibc 2.42.
2026.07.29 · Jul 2026
· source
· release history
Adds safe-linking support for heap analysis when debug symbols are loaded in glibc detection
2022.01.05 · Jan 2022
· source
· release history
Add tcache command providing support for ptmalloc's thread cache.
2018.07.29 · Jul 2018
· source
· release history
example
Visualize heap chunks at a specific address to analyze memory corruption.$ vis_heap_chunks 0x602000
2018.07.29 · Jul 2018
· source
+Kernel slab allocator inspectionshippedDisplays kernel slab cache information including how many objects are in use versus available in each cache.6 releases · 2 other sources · first seen Sep 2016▸
Also counts toward: Command-line interface
release
Updates slab info to display per-CPU sheaves and per-node barns for Linux 7.0+.
2026.10.22 · Oct 2026
· source
· release history
slab_contains now shows inuse/total object count on its own line.
2026.07.29 · Jul 2026
· source
· release history
Adds initial support for the IBM s390x architecture.
2025.05.30 · May 2025
· source
· release history
Added slab contains <addr> [<addrs...>] command to inspect Linux kernel heap (when debugging kernel)
2023.07.17 · Jul 2023
· source
· release history
Adds kbase, kchecksec, and slab kernel debugging commands to get the kernel base address, check kernel security settings, and list kernel slabs
2023.03.19 · Mar 2023
· source
· release history
Removes input-radix and output-radix configuration options; defaulting to hexadecimal for both instead.
2016.09.22 · Sep 2016
· source
· release history
example
Quickly identify the glibc version of a running target to look up gadgets or known heap behaviors.$ libcinfo
2025.04.13 · Apr 2025
· source
Inspect kernel heap slabs for a specific address.$ (gdb) slab contains 0xffffffff82040000
2023.07.17 · Jul 2023
· source
+Heap allocation trackingshippedTracks malloc and free calls in a live process and annotates each event with the call site so the user can follow allocation patterns.4 releases · 2 other sources · first seen Jul 2026▸
Also counts toward: Command-line interface
release
Adds track-heap enable -r to report heap event offsets relative to the mapping instead of absolute addresses.
2026.07.29 · Jul 2026
· source
· release history
track-heap enable -r to report offsets relative to the mapping
2026.07.29 · Jul 2026
· source
· release history
track-heap enable --where to annotate allocation events with call sites
2026.07.29 · Jul 2026
· source
· release history
Adds track-heap enable --where to annotate each heap allocation event with its nearest program symbol call site.
2026.07.29 · Jul 2026
· source
· release history
example
Trace call sites for every heap allocation to identify leak sources.$ track-heap enable --where
2026.07.29 · Jul 2026
· source
Track heap allocations in a running process and annotate every malloc/free event with the nearest symbol that triggered it.$ track-heap enable --where
2026.07.29 · Jul 2026
· source
+mallocng heap inspectionverifiedVisualises musl mallocng allocator internals including meta areas and slot layout within groups.2 releases · 4 other sources · first seen Jul 2018▸
release
The mallocng-dump, mallocng-vis, jemalloc-heap, jemalloc-extent-info, knft-list-tables (and similar dash-separated) commands are replaced by subcommands: use mallocng dump, mallocng vis, jemalloc heap, jemalloc extent-info, knft list-tables etc. instead.
2026.07.29 · Jul 2026
· source
· release history
Add breakrva command to set a breakpoint at an offset relative to the base address of a given executable.
2018.07.29 · Jul 2018
· source
· release history
command line
metaarea — Print out a mallocng meta_area object at the given address.
2026.07.29 · Jul 2026
· command-line history
slots — Dump information about a mallocng slot, given its start address.
2026.07.29 · Jul 2026
· command-line history
slotu — Dump information about a mallocng slot, given its user address.
2026.07.29 · Jul 2026
· command-line history
+glibc exit handler inspectionshippedLists all registered glibc exit handlers and decodes their mangled function pointers so the user can see what will run at process exit.2 releases · 2 other sources · first seen Jul 2026▸
Also counts toward: Command-line interface
release
Adds exithandlers command (alias exitfuncs) to list registered glibc exit handlers by walking __exit_funcs and tls_dtor_list, demangling PTR_MANGLEd function pointers, and printing the pointer_guard cookie.
2026.07.29 · Jul 2026
· source
· release history
exithandlers (alias exitfuncs) to inspect glibc exit handlers and demangle pointers
2026.07.29 · Jul 2026
· source
· release history
Inspect registered glibc exit handlers during exploitation to identify hijack opportunities and see the pointer_guard cookie.$ exithandlers
2026.07.29 · Jul 2026
· source
+musl libc detection and inspectionshippedDetects musl libc in statically linked binaries and exposes its allocator structures for inspection.2 releases · first seen Jul 2026▸
release
Adds Android Bionic libc detection, surfaced via the libc / libcinfo command showing libc and loader mappings.
2026.10.22 · Oct 2026
· source
· release history
Detects musl libc in statically linked binaries.
2026.07.29 · Jul 2026
· source
· release history
+Code and Execution Analysis6 capabilitiespwndbg provides disassembly, syscall tracing, and pattern-based crash analysis to help users understand what code is executing and why it crashes. These capabilities cover both normal debugging workflows and targeted exploit offset discovery.▸
+Disassembly viewshippedShows disassembled instructions around the current instruction pointer with markers for breakpoints and unresolved branches.14 releases · 4 other sources · first seen Jul 2018▸
release
14 total
Pwndbg no longer refuses to start on unknown architectures — falls back to the underlying debugger's disassembler with reduced context and no emulation.
2026.10.22 · Oct 2026
· source
· release history
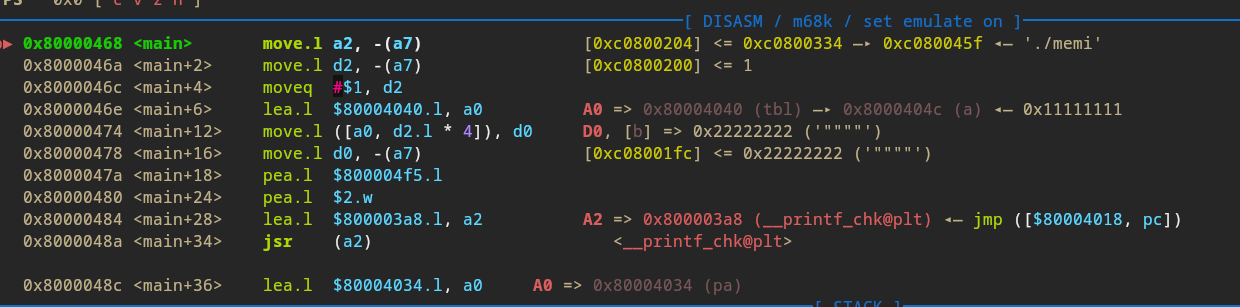
Adds m68k architecture support including Capstone disassembly, Unicorn emulation, branch target resolution, and instruction annotations.
2026.10.22 · Oct 2026
· source
· release history
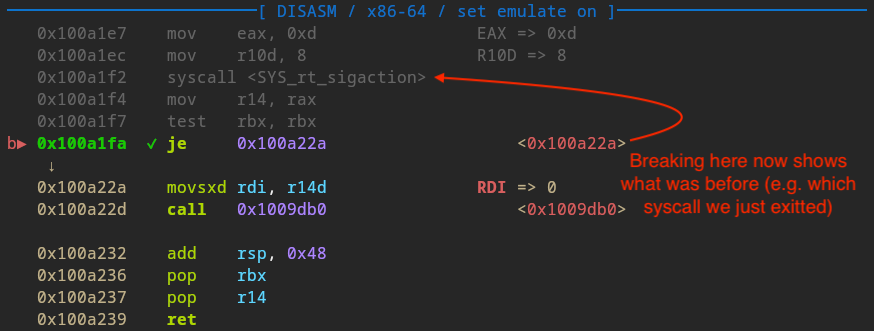
Adds backwards disassembly capability in context views and the nearpc command to inspect instructions before the current PC.
2026.09.15 · Sep 2026
· source
· release history
Expands nearpc -f/--function to work without debugging symbols, making it a full replacement for GDB's/LLDB's disass command with branch visualization, branch targets, and operand annotations.
2026.09.15 · Sep 2026
· source
· release history
Adds backwards disassembly in context disasm and nearpc, showing instructions before $PC when stopping at a breakpoint or after a syscall.
2026.09.15 · Sep 2026
· source
· release history
Enables emulation when debugging x64 kernels, unlocking emulated instruction flow and concrete operand display in the disassembly system.
2026.09.15 · Sep 2026
· source
· release history
example
Disassemble the entire current function even if no debug symbols are present, replacing standard GDB/LLDB disassembly with richer output.$ nearpc -f
2026.09.15 · Sep 2026
· source
Disassemble an entire function at once to review its full control flow with branch visualization.$ nearpc -f main
2026.02.18 · Feb 2026
· source
Configure pwndbg to dump the current context pane output to a specific pseudo-terminal device for external logging or analysis.$ set context-output /dev/pts/2
2019.12.09 · Dec 2019
· source
View source code context with the file path included.$ context code
2019.01.25 · Jan 2019
· source
+Syscall inspection and steppingverifiedLooks up syscall numbers by name or number and can step execution forward until a chosen syscall is reached.4 releases · 3 other sources · first seen Jul 2018▸
Also counts toward: Command-line interface
release
Extends stepsyscall to step until a given syscall name or a condition expression, e.g. stepsyscall write or stepsyscall -c '$rdi==0'.
2026.07.29 · Jul 2026
· source
· release history
Adds the xuntil command to execute until a specified address or condition is reached
2019.12.09 · Dec 2019
· source
· release history
next_syscall is renamed to nextsyscall.
2018.07.29 · Jul 2018
· source
· release history
Add stepsyscall command to step execution until a system call is entered.
2018.07.29 · Jul 2018
· source
· release history
command line
syscall — Syscall number (e.g., 1, 0x3c) or name (e.g., write, exit)
2026.07.29 · Jul 2026
· command-line history
example
Step execution forward until a specific syscall is reached, useful for quickly reaching an interesting I/O or exec call.$ stepsyscall write
2026.07.29 · Jul 2026
· source
Execute the target program until it reaches a specific memory address, useful for skipping to complex logic or function returns.$ xuntil 0x401234
2019.12.09 · Dec 2019
· source
+eBPF program debuggingshippedAllows the user to set breakpoints at the start of JIT-compiled eBPF programs during a kernel debugging session.3 releases · first seen Jul 2020▸
Shared capability: eBPF-based runtime detection
release
Adds support for breaking at the start of a JIT-compiled eBPF program.
2026.07.29 · Jul 2026
· source
· release history
Breakpoint at the start of JIT-compiled eBPF programs
2026.07.29 · Jul 2026
· source
· release history
ctx-watch renamed to ctx-unwatch for unwatching expressions; use ctx-unwatch instead.
2020.07.23 · Jul 2020
· source
· release history
+Cyclic pattern generationshippedGenerates de Bruijn cyclic patterns so the user can determine the exact offset to a crash-controlling value.1 release · first seen Jul 2026▸
Also counts toward: Command-line interface
release
The cyclic command now generates a de Bruijn sequence consistent with pwn cyclic from pwntools; previously generated sequences will differ.
2026.07.29 · Jul 2026
· source
· release history
+ELF parsingshippedParses ELF binaries on any supported architecture using a bundled library so the user does not need an external readelf tool.1 release · first seen Jul 2026▸
release
Replaces the system readelf with pyelftools for ELF parsing across all architectures without requiring an external tool.
2026.07.29 · Jul 2026
· source
· release history
+RISC-V architecture supportshippedDisassembles RISC-V instructions, including bit-manipulation extension opcodes, for users working on that architecture.1 release · first seen Jul 2026▸
release
Enables RISC-V B extension disassembling.
2026.07.29 · Jul 2026
· source
· release history
+Kernel Debugging5 capabilitiespwndbg extends GDB with commands tailored to Linux kernel debugging, covering task inspection, address translation, slab allocators, per-CPU variables, and data type layout. Users can work with kernel internals without needing full debug symbol coverage.▸
+Kernel task introspectionshippedInspects kernel task properties such as stack, seccomp filters, signal handlers, and namespaces by PID without requiring debug symbols.2 releases · 1 other source · first seen Jul 2026▸
Also counts toward: Command-line interface
release
Adds four new Linux kernel task introspection commands without requiring typeinfo: kstack [pid], kseccomp [pid], ksighand [pid], and knamespace [pid].
2026.07.29 · Jul 2026
· source
· release history
kstack, kseccomp, ksighand, knamespace commands for kernel task introspection without typeinfo
2026.07.29 · Jul 2026
· source
· release history
example
Inspect the seccomp filter of a kernel task by PID when debugging a kernel with qemu-system.$ kseccomp 1234
2026.07.29 · Jul 2026
· source
+Virtual/physical address conversionshippedConverts between virtual and physical addresses inside GDB expressions so the user can work with both address spaces during kernel sessions.2 releases · first seen Jul 2026▸
release
Expands v2p, p2v, and pageinfo commands to display full page info including vaddr, paddr, and page.
2026.09.15 · Sep 2026
· source
· release history
Adds v2p and p2v GDB function helpers to convert between virtual and physical addresses inside expressions.
2026.07.29 · Jul 2026
· source
· release history
+Kernel data type display (dt)shippedDisplays the layout of kernel and binary data types including bitfields, nested structs, and flexible array members.1 release · 1 other source · first seen Feb 2025▸
release
Extends dt command to properly handle bitfields (with sub-byte offsets like +0x0000.1), nested struct offsets, and flexible array members.
2026.07.29 · Jul 2026
· source
· release history
example
Load struct definitions from a project header so cymbol can resolve custom types without a debug build.$ cymbol -f /path/to/structs.h
2025.02.19 · Feb 2025
· source
+Kernel image retrievalshippedDownloads kernel images needed for debugging, fetching multiple images in parallel to save time.1 release · first seen Jul 2026▸
release
Kernel image downloads are now parallelized for faster retrieval.
2026.07.29 · Jul 2026
· source
· release history
+Per-CPU variable resolutionshippedResolves per-CPU variables inside GDB expressions so the user can read or break on CPU-local kernel data.1 release · first seen Jul 2026▸
release
Adds percpu GDB function to resolve per-CPU variables inside print/break expressions during kernel debugging.
2026.07.29 · Jul 2026
· source
· release history
+Process and System Information1 capabilitypwndbg surfaces enriched process-level information beyond what stock GDB provides, including file descriptors, socket relationships, and pipe endpoints. This gives users a fuller picture of what a target process is doing and how it relates to the system.▸
+Process information (procinfo)shippedShows detailed process information including file descriptors enriched with socket peer and pipe endpoint data.4 releases · 1 other source · first seen Feb 2024▸
Also counts toward: Command-line interface
release
Adds stack-vis command to visualize stack frames of the current thread, similar to how vis-heap-chunks visualizes heap chunks.︀︄︇︀︅︉︀︅︀︀︃︀︀︅︅︀︅︊︀︄︆︀︃︄
2026.09.15 · Sep 2026
· source
· release history
Enriches procinfo file descriptor output with netlink socket protocol/portid/groups, unix-domain socket peer process, and pipe peers with read/write end information.
2026.07.29 · Jul 2026
· source
· release history
Adds kfile [pid] [-fd [fd]] command to display file descriptors accessible by the current or a given kernel task
2026.02.18 · Feb 2026
· source
· release history
Adds -A <N> and -B <N> flags to vmmap to show adjacent memory entries
2024.02.14 · Feb 2024
· source
· release history
example
Visualize the stack layout of the current thread to inspect local variables and saved registers.$ stack-vis
2026.09.15 · Sep 2026
· source
+Debugger Environment and Tooling2 capabilitiespwndbg supports multiple debugger backends and provides usability features such as themes, LLDB compatibility, and pwntools integration. These capabilities shape the overall working environment rather than any single analysis task.▸
+LLDB backend supportshippedLets the user run pwndbg under LLDB as an alternative backend, including command history and Enter-to-repeat behaviour.3 releases · 1 other source · first seen Jul 2026▸
Also counts toward: Command-line interface
release
Adds LLDB target.run-args support so launch now respects pre-configured run arguments.
2026.10.22 · Oct 2026
· source
· release history
Adds LLDB target create -r flag for specifying a remote executable path and process launch -w for setting the working directory.
2026.10.22 · Oct 2026
· source
· release history
Command history and Enter-to-repeat now work on LLDB.
2026.07.29 · Jul 2026
· source
· release history
docs
GDB and LLDB plug-in that enhances debugging for reverse-engineers and exploit developers with low-level utilities.
+Theme managementshippedApplies visual colour themes to pwndbg output so users can customise how information is presented.2 releases · first seen Feb 2017▸
Also counts toward: Command-line interface
release
Moves the pwndbg themes collection into the main repository under the themes/ directory.
2026.07.29 · Jul 2026
· source
· release history
Adds themefile command to save theme settings to a file for ~/.gdbinit
2017.02.01 · Feb 2017
· source
· release history
+Other77 capabilities▸
+LLDB debugging enhancementsshippedExtend LLDB support with Objective-C/Mach-O analysis, fzf completion, register aliases, and arm64e architecture.6 releases · 1 other source · first seen Oct 2025▸
release
Adds objc show-class -n <ClassName> to display Objective-C class metadata in pseudo-ObjC syntax, including method implementations and selector addresses, with -a <address> and -m <module> lookups, and objc list-classes to list Objective-C classes in the main module, where -a includes all modules except the…
2026.10.22 · Oct 2026
· source
· release history
Improved vmmap output on Darwin under LLDB, incorporating DYLD Shared Cache.
2025.10.10 · Oct 2025
· source
· release history
New disasm-reg-alias config option to force disassembly to use register aliases (e.g. aarch64 x29 → fp).
2025.10.10 · Oct 2025
· source
· release history
Adds Objective-C and Mach-O support on Darwin under LLDB.
2025.10.10 · Oct 2025
· source
· release history
Adds fzf (fuzzy finder) tab completion in LLDB.
2025.10.10 · Oct 2025
· source
· release history
Adds arm64e architecture support in LLDB.
2025.10.10 · Oct 2025
· source
· release history
example
Inspect an Objective-C class during macOS/iOS binary analysis to see method selectors and implementation addresses without needing a separate class-dump tool.$ objc show-class -n NSURLSession
2026.10.22 · Oct 2026
· source
+musl mallocng heap inspectionshippedVisualize, dump, explain, and locate slots in the musl mallocng allocator structures.6 releases · 1 other source · first seen Oct 2025▸
Also counts toward: Command-line interface
release
New ng-vis command to visualize the musl mallocng heap.
2025.10.10 · Oct 2025
· source
· release history
New ng-dump command to dump musl mallocng heap state.
2025.10.10 · Oct 2025
· source
· release history
New ng-explain command to explain musl mallocng slot layout.
2025.10.10 · Oct 2025
· source
· release history
New ng-find command to locate a slot, group, or meta by address in musl mallocng.
2025.10.10 · Oct 2025
· source
· release history
New ng-metaarea and ng-ctx commands to inspect musl mallocng internals.
2025.10.10 · Oct 2025
· source
· release history
New ng-slots command to inspect musl mallocng slots.
2025.10.10 · Oct 2025
· source
· release history
example
Inspect musl mallocng heap state for a target binary to find corruption or understand allocator internals during exploit development.$ ng-dump
2025.10.10 · Oct 2025
· source
+Kernel metadata inspection commandsverifiedDump and inspect kernel subsystem state including dmesg, DMA buffers, tasks, syscalls, and modules.5 releases · 1 other source · first seen Oct 2025▸
Also counts toward: Command-line interface
release
New kdmesg command for dumping kernel dmesg during kernel debugging.
2025.10.10 · Oct 2025
· source
· release history
New kdmabuf command for dumping DMA buf info during kernel debugging.
2025.10.10 · Oct 2025
· source
· release history
New ktask command for dumping kernel task info during kernel debugging.
2025.10.10 · Oct 2025
· source
· release history
New ksyscall command for dumping kernel syscall info during kernel debugging.
2025.10.10 · Oct 2025
· source
· release history
New kmod command for dumping kernel module info during kernel debugging.
2025.10.10 · Oct 2025
· source
· release history
command line
sheaf — Dump a slab sheaf at the given address.
2026.10.22 · Oct 2026
· command-line history
+Baremetal debugging supportshippedSupport baremetal debugging workflows for ARM Cortex-M architectures.6 releases · first seen Dec 2019▸
Also counts toward: Command-line interface
release
Adds native GDB portable build for Apple Silicon macOS (remote ELF debugging only).
2025.04.18 · Apr 2025
· source
· release history
Adds portable GDB and LLDB builds for LoongArch64 Linux (*_loongarch64-portable.tar.xz).
2025.04.18 · Apr 2025
· source
· release history
Ships first portable builds for LoongArch64 Linux (GDB and LLDB) and native Apple Silicon GDB (remote ELF debugging).
2025.04.13 · Apr 2025
· source
· release history
Python 3.8, Ubuntu 20.04, and Debian 11 are no longer supported.
2025.01.20 · Jan 2025
· source
· release history
Adds setflag command to set CPU flags register values
2022.08.30 · Aug 2022
· source
· release history
Adds initial support for ARM Cortex-M baremetal debugging workflows
2019.12.09 · Dec 2019
· source
· release history
+PIE and offset-based breakpointingshippedSet breakpoints at specific offsets from the binary base or using relative virtual addresses to support PIE debugging.4 releases · 2 other sources · first seen Jul 2018▸
Also counts toward: Command-line interface
release
Adds $base(objfile_name) function to compute base address of memory pages
2024.02.14 · Feb 2024
· source
· release history
Adds heap_config command to configure heap command settings including symbol addresses
2022.08.30 · Aug 2022
· source
· release history
Add breakrva command to set a breakpoint at an offset relative to the base address of a given executable.
2018.07.29 · Jul 2018
· source
· release history
example
Set a breakpoint at a specific offset from the binary base during PIE debugging.$ breakrva 0x123
2018.07.29 · Jul 2018
· source
Create a dynamic breakpoint using the new rebase expression function.$ break *$rebase(some_address)
2018.07.29 · Jul 2018
· source
+Debugee resource limit configurationverifiedSet soft and hard resource limits on the debugee process using the setrlimit command, controlling resources such as open-file counts and core-file sizes.1 release · 4 other sources · first seen Oct 2026▸
Also counts toward: Command-line interface
release
Adds setrlimit command to set debugee resource limits — e.g. setrlimit nofile 1 2 sets soft and hard open-file limits, setrlimit core infinite sets both core-file limits to unlimited.
2026.10.22 · Oct 2026
· source
· release history
command line
hard — Hard limit value (integer) or 'infinite' (defaults to soft)
2026.10.22 · Oct 2026
· command-line history
soft — Soft limit value (integer) or 'infinite'
2026.10.22 · Oct 2026
· command-line history
Remove the core-dump size limit so a crashing debugee actually writes a full core file for post-mortem analysis.$ setrlimit core infinite
2026.10.22 · Oct 2026
· source
+IBM s390x architecture supportshippedProvide initial debugging and disassembly support for the IBM s390x architecture.4 releases · first seen May 2025▸
release
Adds Sparc branch following support
2026.02.18 · Feb 2026
· source
· release history
Adds PowerPC branch resolution and emulation
2026.02.18 · Feb 2026
· source
· release history
Adds detection of more MIPS architecture variants
2026.02.18 · Feb 2026
· source
· release history
Adds initial support for the IBM s390x architecture.
2025.05.30 · May 2025
· source
· release history
+Thread-local storage detailed inspectionshippedInspect thread-local storage fields in full detail with structured views for diagnosing TLS-related vulnerabilities.2 releases · 2 other sources · first seen Apr 2025▸
Also counts toward: Command-line interface
release
The tls command now renders thread-local storage as a structured tcbhead_t view; new -a flag shows full output.
2025.04.18 · Apr 2025
· source
· release history
Enhances tls command with a structured tcbhead_t view and a -a flag to show the full thread-local storage dump.
2025.04.13 · Apr 2025
· source
· release history
example
Inspect thread-local storage in full detail when debugging TLS-aware exploits.$ tls -a
2025.04.18 · Apr 2025
· source
Inspect all thread-local storage fields in full detail when diagnosing TLS-related vulnerabilities.$ tls -a
2025.04.13 · Apr 2025
· source
+Dynamic process attachmentshippedAttach the cyber tooling to a running process by name, PID, or device file for immediate debugging without restarting.2 releases · 2 other sources · first seen Jan 2022▸
Also counts toward: Command-line interface
release
Adds attachp command to attach to a process by PID, name, or device file
2022.08.30 · Aug 2022
· source
· release history
Adds the attachp command to attach pwndbg to a running process by name or PID
2022.01.05 · Jan 2022
· source
· release history
example
Attach Pwndbg to a running process named vulnerable_app for live debugging$ attachp vulnerable_app
2022.08.30 · Aug 2022
· source
Attach pwndbg to a running chrome process by name for immediate debugging.$ attachp chrome
2022.01.05 · Jan 2022
· source
+Stack frame visualizationshippedVisualize the stack layout of the current thread to inspect local variables and saved registers.2 releases · 1 other source · first seen Sep 2026▸
Also counts toward: Command-line interface
release
Adds stack-vis command to visualize stack frames of the current thread, similar to how vis-heap-chunks visualizes heap chunks.︀︄︇︀︅︉︀︅︀︀︃︀︀︅︅︀︅︊︀︄︆︀︃︄
2026.09.15 · Sep 2026
· source
· release history
Introduces the stack-vis command to visualize stack frames of the current thread.
2026.09.15 · Sep 2026
· source
· release history
example
Visualize the current thread's stack frames at a breakpoint to understand frame layout during exploit development.$ stack-vis
2026.09.15 · Sep 2026
· source
+Go runtime inspectionshippedInspect Go type information, interfaces, and dump structures without requiring full debug symbols.2 releases · 1 other source · first seen Sep 2024▸
Also counts toward: Command-line interface
release
Adds go-type <address> command to inspect Go type information.
2024.08.29 · Sep 2024
· source
· release history
Adds go-dump <type> <address> command to dump Go types (including interface objects via the any type).
2024.08.29 · Sep 2024
· source
· release history
example
Inspect the concrete type hidden inside a Go interface object at a known address, without needing debug symbols.$ go-dump any 0x00c0000b4000
2024.08.29 · Sep 2024
· source
+Enhanced disassembly displayshippedDisplay instruction opcodes in the disassembly context alongside instructions for better analysis.2 releases · first seen Mar 2023▸
Also counts toward: Command-line interface
release
Adds nearpc --opcode / nearpc -o to show opcode bytes sized to the longest instruction in the listing, or nearpc -o 4 for a fixed-width column — without changing nearpc-num-opcode-bytes.︀︄︇︀︅︉︀︅︀︀︃︀︀︅︅︀︅︊︀︄︆︀︃︄
2026.10.22 · Oct 2026
· source
· release history
Enables instruction opcodes in the disasm context via GDB's set nearpc-num-opcode-bytes 9
2023.03.19 · Mar 2023
· source
· release history
+Automatic cyclic pattern detectionshippedDetect cyclic pattern offsets across all registers and memory after a crash.1 release · 1 other source · first seen Oct 2025▸
Also counts toward: Command-line interface
release
Adds --detect flag to cyclic command to detect cyclic sequences in registers and memory.
2025.10.10 · Oct 2025
· source
· release history
example
Detect cyclic pattern offsets automatically across all registers and memory after a crash, instead of manually inspecting each register.$ cyclic --detect
2025.10.10 · Oct 2025
· source
+Capstone engine updateshippedUpdate Capstone disassembly engine to version 6 alpha5.2 releases · first seen May 2025▸
release
Updated Capstone disassembly engine to version 6 alpha5.
2025.10.10 · Oct 2025
· source
· release history
Upgraded Capstone to version 6, enabling new architecture and disassembly improvements.
2025.05.30 · May 2025
· source
· release history
+Disassembly display improvementsshippedConfigure branch jump markers and register aliases in disassembly output.2 releases · first seen Oct 2025▸
release
New disasm-branch-on and disasm-branch-off theme options for branch jump markers in disassembly.
2025.10.10 · Oct 2025
· source
· release history
New disasm-reg-alias config option to force disassembly to use register aliases (e.g. aarch64 x29 → fp).
2025.10.10 · Oct 2025
· source
· release history
+LLDB help and completion updatesshippedAdd 'help set' command and fzf tab completion support in LLDB.2 releases · first seen Oct 2025▸
Also counts toward: Command-line interface
release
Adds fzf (fuzzy finder) tab completion in LLDB.
2025.10.10 · Oct 2025
· source
· release history
+Portable build enhancementsshippedInclude Zig compiler in portable builds and add one-liner installation support.2 releases · first seen May 2025▸
Also counts toward: Command-line interface
release
Portable releases now include zig, enabling commands such as cyclic in portable builds.
2025.10.10 · Oct 2025
· source
· release history
One-liner portable install now available for Linux and macOS (both GDB and LLDB variants).
2025.05.30 · May 2025
· source
· release history
+VMMap output improvementsshippedImprove vmmap output for Darwin and kernel debugging sessions.2 releases · first seen Oct 2025▸
release
Improved vmmap output on Darwin under LLDB, incorporating DYLD Shared Cache.
2025.10.10 · Oct 2025
· source
· release history
Improved vmmap output for kernel debugging sessions.
2025.10.10 · Oct 2025
· source
· release history
+ARM Cortex-M exception debuggingshippedInspect ARM Cortex-M exception states, including register frames and context handling.2 releases · first seen May 2025▸
Also counts toward: Command-line interface
release
New dump-register-frame command dumps saved register frames, useful for ARM Cortex-M exception/interrupt debugging.
2025.05.30 · May 2025
· source
· release history
Adds Cortex-M exception return address resolution and context handling.
2025.05.30 · May 2025
· source
· release history
+IDA variable lookup integrationshippedLook up IDA-named stack variables by name inside debugger expressions.1 release · 1 other source · first seen May 2025▸
release
Supports stack variable lookup in IDA integration via $ida("var_name").
2025.05.30 · May 2025
· source
· release history
example
Look up an IDA-named stack variable by name inside a pwndbg expression while reversing a function.$ p $ida("var_10")
2025.05.30 · May 2025
· source
+Linux buddy allocator inspectionshippedInspect the Linux kernel buddy allocator free-page state.1 release · 1 other source · first seen May 2025▸
Also counts toward: Command-line interface
release
New buddydump command inspects Linux kernel buddy allocator state on x86-64.
2025.05.30 · May 2025
· source
· release history
example
Inspect the Linux kernel buddy allocator's free-page state while debugging a kernel with QEMU.$ buddydump
2025.05.30 · May 2025
· source
+MSR read/writeshippedRead or write Model-Specific Registers during ring0 kernel debugging.1 release · 1 other source · first seen May 2025▸
Also counts toward: Command-line interface
release
New msr command reads/writes Model-Specific Registers during ring0 kernel debugging.
2025.05.30 · May 2025
· source
· release history
example
Read or write a Model-Specific Register during kernel (ring0) debugging to inspect CPU state.$ msr
2025.05.30 · May 2025
· source
+Breakpoint display markersshippedVisually mark user-set breakpoints directly in the disassembly context panel.2 releases · first seen Apr 2025▸
release
Context disasm panel now marks user-set breakpoints inline (shown as b+ by default).
2025.04.18 · Apr 2025
· source
· release history
Adds breakpoint markers in the context disasm panel, displayed as b+ next to breakpointed instructions.
2025.04.13 · Apr 2025
· source
· release history
+Binary Ninja integrationshippedSynchronize views and symbols between the debugger and Binary Ninja.2 releases · first seen Sep 2024▸
release
IDA and Binary Ninja integration servers can now be configured via PWNDBG_IDA_SERVER_HOST, PWNDBG_IDA_SERVER_PORT, PWNDBG_BINJA_SERVER_HOST, and PWNDBG_BINJA_SERVER_PORT environment variables.
2025.02.19 · Feb 2025
· source
· release history
Adds Binary Ninja integration to synchronize Binary Ninja view and symbols with Pwndbg.
2024.08.29 · Sep 2024
· source
· release history
+nftables kernel inspectionshippedInspect Linux kernel nftables internals including tables, chains, rules, and sets for firewall analysis.1 release · 1 other source · first seen Feb 2025▸
Also counts toward: Command-line interface
release
Adds eight new kernel nftables inspection commands: knft_dump, knft_list_tables, knft_list_chains, knft_list_rules, knft_list_exprs, knft_list_sets, knft_list_objects, and knft_list_flowtables.
2025.02.19 · Feb 2025
· source
· release history
example
Dump all nftables internals on a live kernel to quickly map firewall rules during incident response.$ knft_dump
2025.02.19 · Feb 2025
· source
+File descriptor hijackingshippedRedirect a process's file descriptors to controlled files mid-session to intercept or inject I/O.1 release · 1 other source · first seen Jan 2025▸
Also counts toward: Command-line interface
release
New hijack-fd <fd> <newfile> command modifies a process file descriptor.
2025.01.20 · Jan 2025
· source
· release history
example
Redirect a process's file descriptor to a controlled file mid-session to intercept or inject I/O.$ hijack-fd 1 /tmp/capture.txt
2025.01.20 · Jan 2025
· source
+jemalloc heap inspectionshippedInspect and visualize jemalloc allocator structures including extents, chunks, and arenas during debugging.1 release · 1 other source · first seen Jan 2025▸
Also counts toward: Command-line interface
release
New jemalloc_heap, jemalloc_extent_info, and jemalloc_find_extent commands inspect jemalloc heap allocator structures.
2025.01.20 · Jan 2025
· source
· release history
example
Inspect jemalloc heap structures when exploiting a target that uses the jemalloc allocator.$ jemalloc_heap
2025.01.20 · Jan 2025
· source
+Assembly pattern search and breakpointingshippedSearch memory for specific assembly instructions or set breakpoints on matching code sequences.1 release · 1 other source · first seen Sep 2024▸
release
Extends search with --asm <code> to find assembly instructions and --asmbp <code> to set breakpoints on matching instructions.
2024.08.29 · Sep 2024
· source
· release history
example
Find all ROP gadgets matching an assembly pattern and immediately set breakpoints on each — useful during exploit development to stop at specific instruction sequences.$ search --asmbp 'pop rdi; ret'
2024.08.29 · Sep 2024
· source
+Memory gap detectionshippedIdentify unmapped memory regions between allocated segments for analysis or exploitation.1 release · 1 other source · first seen Sep 2024▸
release
Adds vmmap --gaps to display unmapped memory gaps alongside mapped regions.
2024.08.29 · Sep 2024
· source
· release history
example
Identify unmapped memory gaps in a process — helpful for spotting guard pages or finding injection targets.$ vmmap --gaps
2024.08.29 · Sep 2024
· source
+Memory sprayingshippedSpray memory at a target address with specific data values for testing or exploitation purposes.1 release · 1 other source · first seen Jul 2023▸
Also counts toward: Command-line interface
release
Added spray <addr> ... command to spray memory with given values
2023.07.17 · Jul 2023
· source
· release history
example
Spray memory at a target address with specific data.$ (gdb) spray 0xdeadbeef b'AAAA'
2023.07.17 · Jul 2023
· source
+Thread managementshippedKill specific threads by ID during a debugging session.1 release · 1 other source · first seen Jul 2023▸
Also counts toward: Command-line interface
release
Added killthreads [<ids...>] command to kill threads with given IDs
2023.07.17 · Jul 2023
· source
· release history
example
Kill specific threads by ID during debugging.$ (gdb) killthreads 1234 5678
2023.07.17 · Jul 2023
· source
+Pointer chain analysisshippedSearch for pointer chains starting from a specific address to trace heap structures or follow P2P links.1 release · 1 other source · first seen Jan 2022▸
Also counts toward: Command-line interface
release
Adds the p2p command for pointer chain search (P2P) via source code
2022.01.05 · Jan 2022
· source
· release history
example
Search for pointer chains starting from a specific address to trace heap structures.$ p2p <address>
2022.01.05 · Jan 2022
· source
+Leak finding automationshippedAutomate the discovery of memory leaks during debugging sessions using a dedicated algorithm.1 release · 1 other source · first seen Dec 2019▸
Also counts toward: Command-line interface
release
Adds the leakfind command to automate finding memory leaks during debugging sessions
2019.12.09 · Dec 2019
· source
· release history
example
Run the new leak finding algorithm to identify potential memory corruption or leaks in your target process.$ leakfind
2019.12.09 · Dec 2019
· source
+Diagnostic report generationshippedGenerate a diagnostic report for debugging issues using a dedicated command or subcommand.1 release · 1 other source · first seen Jan 2019▸
Also counts toward: Command-line interface
release
bugreport new subcommand added for generating diagnostics
2019.01.25 · Jan 2019
· source
· release history
example
Generate a diagnostic report for a debugging issue.$ bugreport
2019.01.25 · Jan 2019
· source
+Conditional syscall steppingshippedStep execution in stepsyscall only until a specific register value or condition is met.1 other source · first seen Jul 2026▸
example
Run stepsyscall only when a register hits a specific value.$ stepsyscall write -c '$rdi==0'
2026.07.29 · Jul 2026
· source
+Context backtrace hexadecimal offsetsshippedDisplay offsets in backtrace sections of the context panel in hexadecimal format.1 release · first seen Feb 2026▸
release
Adds set context-backtrace-hex on to display backtrace offsets in hexadecimal
2026.02.18 · Feb 2026
· source
· release history
+Context stack variable displayshippedDisplay stack variable names and offsets in the context panel when debug info is available.1 release · first seen Feb 2026▸
release
Adds stack variable names and offsets in the context display when debug info is present
2026.02.18 · Feb 2026
· source
· release history
+Decompiler integrationshippedIntegrate with decompilers like IDA Pro, Binary Ninja, Ghidra, and angr-management to provide decompiled code views.1 release · first seen Feb 2026▸
release
Adds decompiler integration via decomp2dbg, supporting IDA, Binary Ninja, Ghidra, and angr-management as backends; works with both GDB and LLDB
2026.02.18 · Feb 2026
· source
· release history
+Enhanced ROP gadget scanningshippedScan executable memory for gadgets with improved integration and color support.1 release · first seen Feb 2026▸
release
Improves ropgadget integration with color support
2026.02.18 · Feb 2026
· source
· release history
+Last signal context panelshippedDisplay information about the last signal received by the debugee in the context view.1 release · first seen Feb 2026▸
release
Adds a last-signal context panel showing the last signal received by the debugee
2026.02.18 · Feb 2026
· source
· release history
+LLDB core file debuggingshippedLoad and debug core files using the LLDB backend.1 release · first seen Feb 2026▸
release
Adds LLDB support for core file loading and debugging
2026.02.18 · Feb 2026
· source
· release history
+Memory dump to C/Python arraysshippedDump memory regions as C or Python code arrays for use in exploit development.1 other source · first seen Feb 2026▸
Also counts toward: Python scripting support, Scripting language support
example
Dump a memory region as a C array for use in an exploit or test harness.$ hexdump -C c 0x7fffffffd000 256
2026.02.18 · Feb 2026
· source
+Memory Protection Keys for Userspace (PKU) detectionshippedDetect Intel PKU violations in userspace and display detailed information.1 release · first seen Feb 2026▸
release
Adds Intel PKU (Memory Protection Keys for Userspace) violation detection with detailed info messages
2026.02.18 · Feb 2026
· source
· release history
+Page table walking for kernel tasksshippedWalk page tables for different kernel tasks in the vmmap and pagewalk commands when debug info is present.1 release · first seen Feb 2026▸
release
Extends pagewalk to walk page tables of different kernel tasks when debug info is present
2026.02.18 · Feb 2026
· source
· release history
+Portable build debuginfod clientshippedAutomatically fetch debug symbols from a hosted server for portable releases.1 release · first seen Feb 2026▸
release
Enables debuginfod client by default in portable releases, automatically fetching debug symbols from a hosted server covering Ubuntu, Debian, Fedora, Arch, NixOS, and more
2026.02.18 · Feb 2026
· source
· release history
+PowerPC branch resolutionshippedResolve and emulate branches in PowerPC architectures to support accurate disassembly.1 release · first seen Feb 2026▸
release
Adds PowerPC branch resolution and emulation
2026.02.18 · Feb 2026
· source
· release history
+Sparc architecture supportshippedProvide debugging and disassembly support for the Sparc architecture.1 release · first seen Feb 2026▸
release
Adds Sparc branch following support
2026.02.18 · Feb 2026
· source
· release history
+Kernel BPF inspectionshippedInspect kernel BPF program internals during live kernel debugging.1 release · first seen Oct 2025▸
Also counts toward: Command-line interface
release
Adds kbpf command for inspecting kernel BPF internals during live kernel debugging sessions.
2025.10.20 · Oct 2025
· source
· release history
+Kernel page marker detectionshippedDetect page markers without requiring debug symbols to broaden kernel debugging coverage.1 release · first seen Oct 2025▸
release
Enables page marker detection without requiring debug symbols, broadening kernel debugging coverage.
2025.10.20 · Oct 2025
· source
· release history
+Apple commpage inspectionshippedDump Apple commpage memory mapping information.1 release · first seen Oct 2025▸
Also counts toward: Command-line interface
release
New commpage command in LLDB to dump Apple commpage memory mapping.
2025.10.10 · Oct 2025
· source
· release history
+Configuration and display optionsshippedAdd max-decimal-number config and remove PWNDBG_DISABLE_COLORS support.1 release · first seen Oct 2025▸
release
New max-decimal-number config option to set the threshold above which values display in hex instead of decimal.
2025.10.10 · Oct 2025
· source
· release history
+Go binary architecture supportshippedAdd support for Go binaries on MIPS, LoongArch64, and s390x architectures.1 release · first seen Oct 2025▸
release
Adds Go binaries support for mips, loongarch64, and s390x architectures.
2025.10.10 · Oct 2025
· source
· release history
+Branch condition emulation markersshippedMark branches that will not be taken in the disassembly output using emulation.1 release · first seen May 2025▸
release
Disassembly now marks branches that will NOT be taken with a ✘ marker via emulation.
2025.05.30 · May 2025
· source
· release history
+x64 register exposure for QEMUshippedExpose additional x64 registers for use in QEMU-system kernel debugging.1 release · first seen May 2025▸
release
Exposes additional x64 registers for QEMU-system kernel debugging.
2025.05.30 · May 2025
· source
· release history
+LLDB API controlsshippedExpose programmatic debugger controls via an API for scripting and testing within the LLDB backend.1 release · first seen Apr 2025▸
Also counts toward: Scripting API
release
LLDB gains programmatic debugger controls, usable as an API for scripting and tests.
2025.04.18 · Apr 2025
· source
· release history
+Executable gadget scanningshippedScan all executable memory regions for ROP/RISC gadgets to assist in exploitation.1 release · first seen Jan 2025▸
release
The ropgadget command now scans all executable memory regions for gadgets.
2025.01.20 · Jan 2025
· source
· release history
+Global Descriptor Table inspectionshippedDump and inspect Global Descriptor Table entries from a specified address.1 release · first seen Jan 2025▸
Also counts toward: Command-line interface
release
New gdt <addr> command dumps Global Descriptor Table entries from a given address.
2025.01.20 · Jan 2025
· source
· release history
+Linux kernel symbol table lookupshippedProvide helpers to look up Linux kernel symbols directly from the kernel symbol table.1 release · first seen Jan 2025▸
Also counts toward: Command-line interface
release
New kallsyms and klookup commands provide Linux kernel symbol table lookup helpers.
2025.01.20 · Jan 2025
· source
· release history
+Memory string searchshippedSearch memory regions for readable strings, similar to the standard strings CLI utility.1 release · first seen Jan 2025▸
Also counts toward: Command-line interface
release
New strings command searches memory for readable strings, similar to the strings CLI utility.
2025.01.20 · Jan 2025
· source
· release history
+Android Binder inspectionshippedDisplay information related to the Android Binder driver for IPC debugging.1 release · first seen Sep 2024▸
Also counts toward: Command-line interface
release
Adds commands to display Android Binder driver info (experimental).
2024.08.29 · Sep 2024
· source
· release history
+Per-CPU page cache inspectionshippedPrint Linux kernel per-CPU page cache information for performance analysis.1 release · first seen Sep 2024▸
Also counts toward: Command-line interface
release
Adds pcp command to print Linux kernel per-cpu page cache.
2024.08.29 · Sep 2024
· source
· release history
+Assembly steppingshippedStep execution until a specific assembly instruction string is encountered.1 release · first seen Feb 2024▸
Also counts toward: Command-line interface
release
Adds stepuntilasm <asm> command to step until a matching instruction string is found
2024.02.14 · Feb 2024
· source
· release history
+Branch condition breakpointingshippedSet breakpoints that trigger only when a conditional branch is taken or not taken.1 release · first seen Feb 2024▸
Also counts toward: Command-line interface
release
Adds break-if-taken <loc> and break-if-not-taken <loc> commands to set branch condition breakpoints
2024.02.14 · Feb 2024
· source
· release history
+GOT trackingshippedMonitor calls to the Global Offset Table to detect dynamic symbol resolution or overwrites.1 release · first seen Feb 2024▸
Also counts toward: Command-line interface
release
Adds track-got {enable,disable,info,query} command for GOT tracking
2024.02.14 · Feb 2024
· source
· release history
+Linked list inspectionshippedPrint and traverse linked lists stored in memory by following pointers.1 release · first seen Feb 2024▸
Also counts toward: Command-line interface
release
Adds plist ... command to print linked lists
2024.02.14 · Feb 2024
· source
· release history
+Sigreturn frame inspectionshippedPrint and analyze sigreturn frames for x86-64 architectures.1 release · first seen Feb 2024▸
release
Adds mmap ... and mprotect ... commands to invoke syscalls in the debugged program
2024.02.14 · Feb 2024
· source
· release history
+AI session assistanceshippedAllow users to ask an AI about the current debugging session state using a dedicated command.1 release · first seen Mar 2023▸
Also counts toward: Command-line interface
release
Adds ai command to ask an AI about the current debugging session (requires OpenAI API key)
2023.03.19 · Mar 2023
· source
· release history
+Rizin backend supportshippedUse pwndbg with Rizin as a backend for debugging workflows.1 release · first seen Mar 2023▸
release
Adds support for Rizin as a backend
2023.03.19 · Mar 2023
· source
· release history
+Virtual list inspectionshippedDump and inspect the contents of a va_list structure at a given address to analyze variable arguments.1 release · first seen Mar 2023▸
Also counts toward: Command-line interface
release
Adds valist command to dump arguments of a va_list structure at a given address
2023.03.19 · Mar 2023
· source
· release history
+Interactive Python shellshippedProvide an embedded IPython prompt within the debugger for programmatic interaction and scripting.1 other source · first seen Dec 2022▸
Also counts toward: Python scripting support, Scripting language support
example
Interact with the debugger programmatically using full Python syntax.$ (gdb) ipi
2022.12.19 · Dec 2022
· source
+Memory patchingshippedModify memory contents directly during debugging sessions to test exploits or modify execution flow.1 release · first seen Dec 2022▸
+Return offset steppingshippedSupport specifying return offsets when using the start method to control execution flow.1 release · first seen Jun 2021▸
release
start method now supports return offsets via return_offset argument
2021.06.22 · Jun 2021
· source
· release history
+x86_16 architecture supportshippedProvide debugging support for the i8086 architecture for x86_16 debug sessions.1 release · first seen Jun 2021▸
release
New i8086 architecture support for x86_16 debug sessions
2021.06.22 · Jun 2021
· source
· release history
+Enhanced heap analysisshippedImprove heap analysis capabilities by recognizing specific checked memory functions.1 release · first seen Dec 2019▸
release
Adds __read_chk, __fread_chk and __pread_chk to recognized functions for improved heap analysis
2019.12.09 · Dec 2019
· source
· release history
+Module-based hexdumpingshippedAllow hexdumps to be filtered or targeted by module name using vmmap syntax.1 release · first seen Dec 2019▸
release
Allows hexdump by module name using the existing vmmap syntax
2019.12.09 · Dec 2019
· source
· release history
+Leak scanningshippedScan for pointers within specified memory regions to identify potential information leaks.1 release · first seen Jul 2018▸
Also counts toward: Command-line interface
release
Add probeleak command to scan for pointers within specified memory regions.
2018.07.29 · Jul 2018
· source
· release history
+Return instruction steppingshippedStep execution until a return instruction is hit using the stepret command.1 release · first seen Jul 2018▸
release
Add stepret command to step execution until a return instruction is hit.
2018.07.29 · Jul 2018
· source
· release history
Lines in monospace are the tool's own words: help text
parsed from its source, or an endpoint from its API document. Under
release, a line is our summary of a dated release. Under
docs, it is quoted from the tool's own documentation or
website. Each links back to the source it came from.
Command line
View
Source
No command matches.
load a captured run
composed command
No matchesTry a different search, or clear a filter to see more.
option surface across analysed releases
options at that releaseadded, per releaseremoved, per release
option
found in
since
description
No matchesTry a different search, or clear a filter to see more.
option changes per release — drag across the rail to set a range
→
Values are placeholders taken from each option’s declared default.
Nothing is executed here — the output shown is a recording of a run
that already happened.
Screenshots
From the release notes, newest first. Click one to see it full size.
Breaking-change disciplinehow rarely a release breaks users, and notice given
Maintenance riskquiet time against its own cadence, maintainers
Innovation & surfacenew capabilities, API and MCP surface
Community health
Contributor trenddistinct committers, this year against last
Maintainer concentrationbus factor now against a year ago
Issue backlog trendissues closed per issue opened, 12 months
Responsivenessmedian time to a maintainer’s first reply
Nine scores for pwndbg, each built from the releases, notes and API history this site tracks — and, on Researcher and Business, where it stands among every measured tool in its category and how that has moved.
Each score is 0–100 on a published rubric, derived from data this site already shows.
A dimension we cannot measure says so — it is never scored 0 and never enters a rank.
How this is scored
Shipping velocity — releases a month over the last 12 months, on a log scale where 16 a month scores 100. Needs 3 releases in the window.
Documentation quality — the release-notes rubric published on the analytics page, unchanged.
Breaking-change discipline — the share of releases carrying a breaking change (none scores 100, half or more scores 0). Only projects that label breaking changes are measured: a clean record cannot be told from an unlabelled one.
Maintenance risk — quiet time measured against the tool's own release cadence (quiet longer than 90 days and three typical gaps scores 0), plus the number of active maintainers and whether contributors are growing, where known. Higher is lower risk.
Innovation & surface — new capabilities in the feature ledger this year, API and MCP operations added, and the share of commits that are features: the mean of whichever we hold.
Community health (open-source tools only) — each is a direction, not a size: contributors this year against last, the bus factor now against a year ago, and issues closed per issue opened, where steady scores 50, doubled 100 and halved 0; plus the median time to a maintainer's first reply (an hour scores about 100, a month or more 0). A commercial card has no repository and carries none of the four.
Documented delivery (commercial tools) — when a vendor's documented new capabilities have slowed against its own baseline, that counts against the overall standing as heavily as two low dimensions. Steady delivery, or too little history to judge, leaves the standing alone; it is never a sixth score.
Open-source tools are scored on repository signals; commercial tools on their published changelog. Ranks compare tools within one category and one profile and need at least five measured peers; the overall standing needs three ranked dimensions. Best-in-breed or consolidator is a shape, not a quality, and is never scored.
Release-note detail over time
See how much detail pwndbg puts in its release notes, quarter by quarter, and compare it with tracked tools in the same category. This history uses up to ten retained, reviewed notes per tool; sparse or blank older quarters may reflect that limit.
Issue, contributor and maintainer activity in pwndbg/pwndbg, 2023-10 – 2026-09,
as of 2026-09-25. Twelve-month figures first; the trend lines run
the whole window.
Contributors78+11 vs prior 12 months
Maintainers8+4 joined · −3 left, last 12 months
Bus factor4committers behind half the commits
Community-filed73%of issues opened, last 12 months
Median time to close49 daysfirst maintainer reply 2.7 days
Open backlog202of 1,361 issues ever filed
Issues opened / month10 · 9communitymaintainers
Open backlog202
Contributors / month16
Commits / month62
Stars10,872
Issue themes, last 12 months
bugs 60%
features 18%
questions 2%
docs 0%
other 20%
Counts from the project's public repository and git history; no individuals
are identified. Maintainers are the committers covering 80% of the last year's
commits. how we measure this
Ships a vulnerable library
What its latest release locks, checked against known advisories.
certifi 2025.8.3 in its image
critical
pwndbg 2026.10.28 builds its image from uv.lock, which locks certifi 2025.8.3. That version has GHSA-6q48-6c7w-9gw2.
Fixed in certifi 2026.10.18. No pwndbg release includes it yet; its main branch already has it.
pwndbg 2026.10.28 builds its image from uv.lock, which locks gitpython 3.1.45. That version has GHSA-284h-m62q-gf8w and 28 other high or critical flaws.
Fixed in gitpython 3.2.1. No pwndbg release includes it yet.
pwndbg 2026.10.28 builds its image from uv.lock, which locks cryptography 46.0.7. That version has GHSA-537c-gmf6-5ccf and 2 other high or critical flaws.
Fixed in cryptography 50.0.0. No pwndbg release includes it yet.